. 2021 Apr;35(4):1108-1120.
doi: 10.1038/s41375-020-1002-y. Epub 2020 Aug 4.

Complex landscape of alternative splicing in myeloid neoplasms

Affiliations

Complex landscape of alternative splicing in myeloid neoplasms

Courtney E Hershberger et al. Leukemia. 2021 Apr.

Erratum in

  • Correction: complex landscape of alternative splicing in myeloid neoplasms.
    Hershberger CE, Moyer DC, Adema V, Kerr CM, Walter W, Hutter S, Meggendorfer M, Baer C, Kern W, Nadarajah N, Twardziok S, Sekeres MA, Haferlach C, Haferlach T, Maciejewski JP, Padgett RA. Hershberger CE, et al. Leukemia. 2021 Apr;35(4):1226. doi: 10.1038/s41375-021-01197-2. Leukemia. 2021. PMID: 33714977 Free PMC article. No abstract available.

Abstract

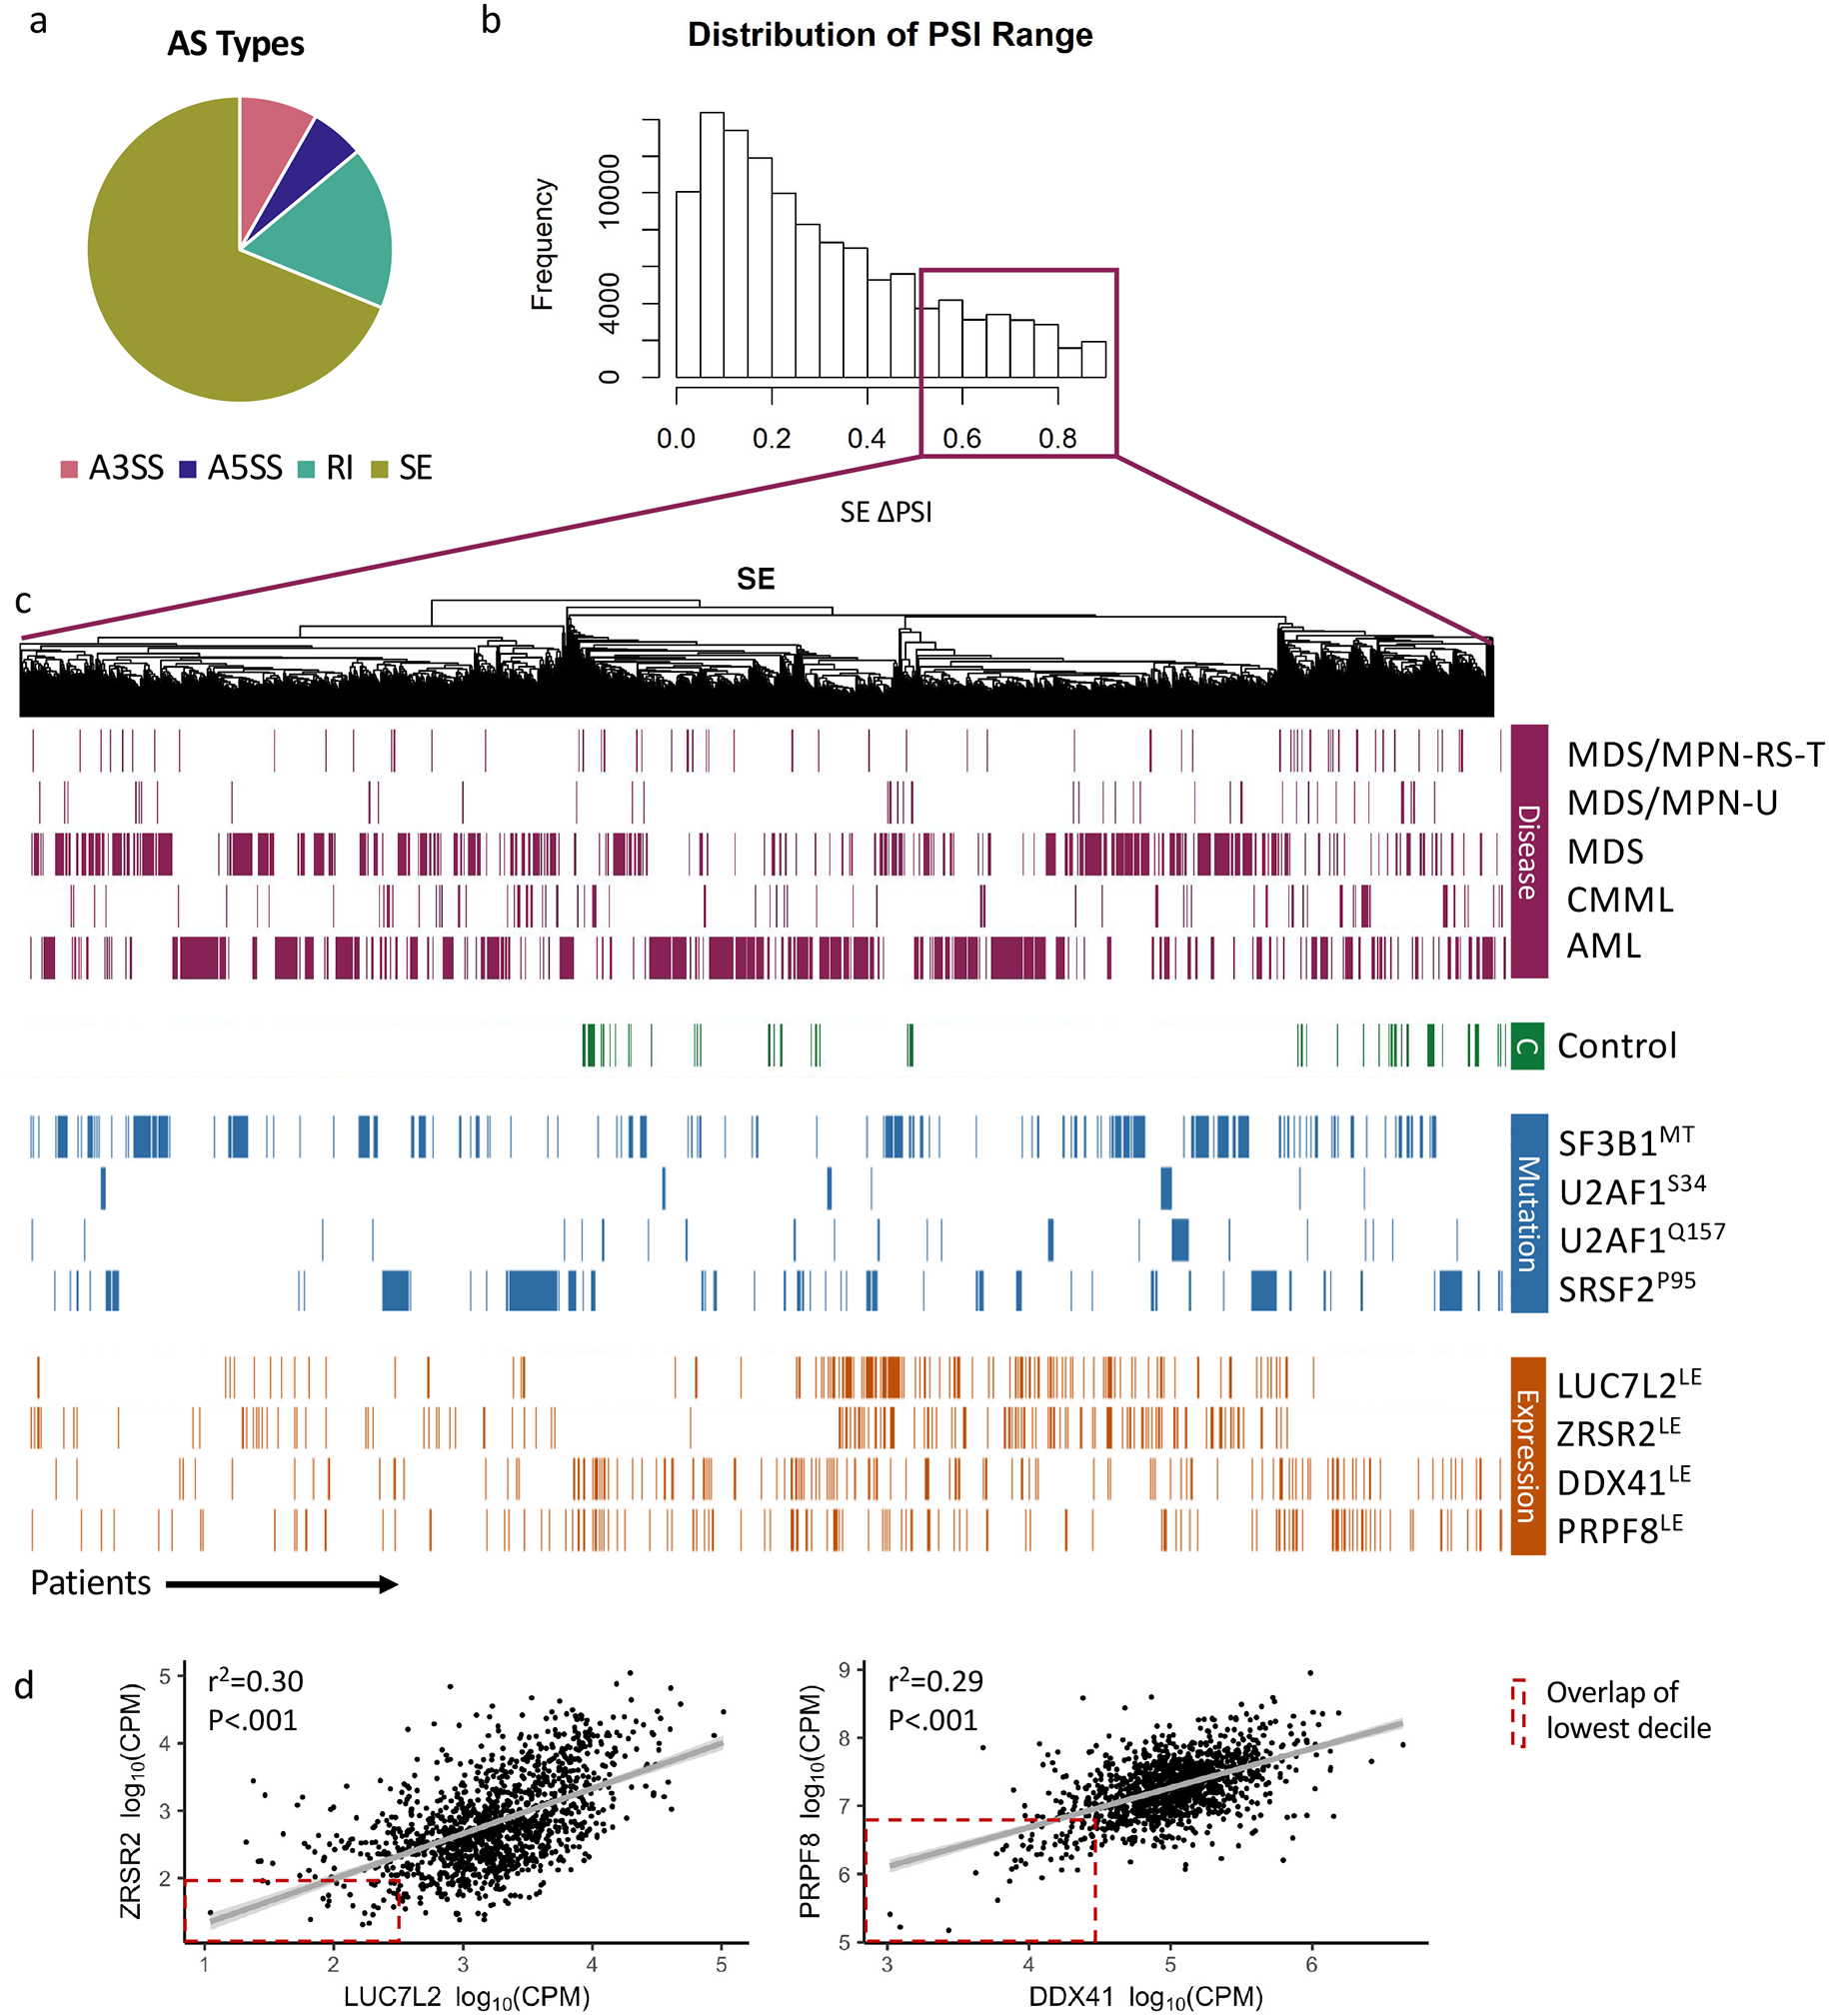
Myeloid neoplasms are characterized by frequent mutations in at least seven components of the spliceosome that have distinct roles in the process of pre-mRNA splicing. Hotspot mutations in SF3B1, SRSF2, U2AF1 and loss of function mutations in ZRSR2 have revealed widely different aberrant splicing signatures with little overlap. However, previous studies lacked the power necessary to identify commonly mis-spliced transcripts in heterogeneous patient cohorts. By performing RNA-Seq on bone marrow samples from 1258 myeloid neoplasm patients and 63 healthy bone marrow donors, we identified transcripts frequently mis-spliced by mutated splicing factors (SF), rare SF mutations with common alternative splicing (AS) signatures, and SF-dependent neojunctions. We characterized 17,300 dysregulated AS events using a pipeline designed to predict the impact of mis-splicing on protein function. Meta-splicing analysis revealed a pattern of reduced levels of retained introns among disease samples that was exacerbated in patients with splicing factor mutations. These introns share characteristics with "detained introns," a class of introns that have been shown to promote differentiation by detaining pro-proliferative transcripts in the nucleus. In this study, we have functionally characterized 17,300 targets of mis-splicing by the SF mutations, identifying a common pathway by which AS may promote maintenance of a proliferative state.


Conflict of interest statement

Competing Interests

T.H., C.H. and W.K. serve as the management board of the MLL Munich Leukemia Laboratory. N.N, S.T., S.H, M.M., W.W., and C.B. are employed by the MLL Munich Leukemia Laboratory. The MLL offers diagnostic services for leukaemias and lymphomas, including cytomorphology, cytochemistry, immunophenotyping, cytogenetics, FISH, and a broad spectrum of molecular assays. In addition, MLL runs several research studies based on a combination of methods for routine use and also including whole genome sequencing and whole transcriptome sequencing.

Figures

Figure 1:
Figure 1:. Overview of splicing factor (SF) mutations and expression levels in the cohorts.
(a) Percentage of patients harboring SF mutations. (b) Frequency of SF mutations in the cohort listed by disease from patients with one of five myeloid neoplasms (AML=213/565, MDS=365/486, CMML=63/95, MDS/MPN-U=42/66, MDS/MPN-RS-T=45/46). (c) mRNA expression in log2 counts per million reads (CPM) of SFs in healthy BM controls and in myeloid neoplasm patient samples, with and without mutations and/or chromosomal deletions. ZRSR2, an X-linked gene, is grouped by patient sex.
Figure 2:
Figure 2:
Overview of alternative splicing (AS) events observed in patient and control samples and quantified by rMATS. (a) Distribution of AS types across 170,006 AS events: alternatively spliced / skipped exons (SE), 68.8%; alternatively spliced introns / retained introns (RI), 17.2%; exons with alternative 5’ splice sites (A5SS), 5.7%; and exons with alternative 3’ splice sites (A3SS), 8.3%. (b) Distribution of the percent spliced in (PSI) Range observed across all samples. (c) Unsupervised hierarchical clustering of the 20,000 alternative spliced exons with the largest range. Samples are annotated by disease, splicing factor mutation (SF3B1, SRSF2, U2AF1) or splicing factor expression (DDX41, LUC7L2, PRPF8, ZRSR2). “LE” indicates that the sample is among the 10% lowest expressers (samples were ranked by Log2CPM) in the cohort. (d) Correlations of ZRSR2 expression with LUC7L2 expression and DDX41 expression with PRPF8 expression (r2 and p value generated by linear regression). Overlap of low expressers indicated with red box.
Figure 3:
Figure 3:. Distribution of dysregulated alternative splicing events by disease and SF mutation or expression.
(a) Schematic showing identification of mis-spliced AS events. (b) Overlap of dysregulated splicing events comparing splicing factor group to disease controls and healthy controls. The number of AS events commonly dysregulated are in green. Of all significant AS events in SF group vs disease control, the percentage of those that were also significant in SF group vs healthy control is displayed. (c) Number of mis-spliced (ΔPSI ≥ 5%, q-value ≤ 0.05) AS events in samples with SF mutations compared with disease controls. Cohorts are divided by disease and SF mutation status. Lighter color indicates enhanced exclusion of exon or intron; darker color indicates enhanced inclusion of exon or intron. (d) Number of mis-spliced AS events in samples with low expression (10% lowest of cohort) of DDX41, LUC7L2, PRPF8, or ZRSR2 compared to high expressers (10% highest in cohort), legend description as in figure 3c.
Figure 4:
Figure 4:. Predicted impact of AS on biological and clinical outcomes.
(a) Selection of most frequently dysregulated AS events from Figure 3c. (b) AS event IDs: Gene symbols, AS type, and custom exon identifier of the AS event. Exon Ontology: Binary chart showing the presence of exon ontology features in dysregulated exons. AS events were classified as containing structural elements, PTMs (post translational modifications), localization signatures, catalytic domains, or binding sites based on intersection with Exon Ontology DB annotation. Gene Expression: The cohorts were stratified by the inclusion of each AS event and plotted the expression level difference between the two groups, identifying many AS events whose inclusion correlated with changes in gene expression. Survival Correlation: Correlation of significant AS events and survival in each cohort using RMATS-SURVIV. Results are displayed as –log10 transformed q-values, indicating the false discovery rate (FDR). (c) MDS and AML cohorts were combined and stratified by AS event inclusion level. Pathway analysis revealed dysregulated expression of Hallmark Gene sets in low- versus high inclusion groups.
Figure 5:
Figure 5:. Enhanced exclusion of RIs in SF groups compared to healthy controls.
(a)Top 5 mis-spliced gene in each SF group compared to healthy bone marrow (significant in 4 diseases, largest median ΔPSI). (b) Distribution of AS types in 494 AS events found to be significant in >= 20 SF groups compared to healthy controls. (c) Mean PSI of each SF group for each excluded RI identified in Fig. 6A. (d) Length of all introns and RIs in (b) (T-test, unpaired, two-tailed, unequal variances, P<0.001); retained introns are shorter (2393 bp vs. 6190bp). (e) Most significant GO terms describing RIs in (b).
Figure 6:
Figure 6:. Characterization of rare somatic mutations in SFs and identification of neojunctions.
(a) Plot of PSIs for the two strongest AS events, found in at least 3 disease groups. Rare mutations that have not been recorded by the three databases (COSMIC, ClinVar, Cancer Hotspot) or have not been confirmed to be somatic in COSMIC or pathogenic in ClinVar are displayed as labeled rectangles. (b) Schematic of disease-specific splicing events (DSSE): identification and filtering to identify strong and reproducible DSSEs. (c) Disease specific splicing events in MDS and AML that are found in ≥50% patients in at least one SF group and never in healthy controls.

References

    1. Yoshida K, Sanada M, Shiraishi Y, Nowak D, Nagata Y, Yamamoto R, et al. Frequent pathway mutations of splicing machinery in myelodysplasia. Nature. 2011;478 (7367):64–9. - PubMed
    1. Makishima H, Visconte V, Sakaguchi H, Jankowska AM, Abu Kar S, Jerez A, et al. Mutations in the spliceosome machinery, a novel and ubiquitous pathway in leukemogenesis. Blood. 2012;119(14):3203–10. - PMC - PubMed
    1. Haferlach T, Nagata Y, Grossmann V, Okuno Y, Bacher U, Nagae G, et al. Landscape of genetic lesions in 944 patients with myelodysplastic syndromes. Leukemia. 2014;28(2):241–7. - PMC - PubMed
    1. Madan V, Kanojia D, Li J, Okamoto R, Sato-Otsubo A, Kohlmann A, et al. Aberrant splicing of U12-type introns is the hallmark of ZRSR2 mutant myelodysplastic syndrome. Nature communications. 2015;6:6042. - PMC - PubMed
    1. Polprasert C, Schulze I, Sekeres MA, Makishima H, Przychodzen B, Hosono N, et al. Inherited and Somatic Defects in DDX41 in Myeloid Neoplasms. Cancer cell. 2015;27(5):658–70. - PMC - PubMed

Publication types

MeSH terms