. 2020 Aug 4;10(1):13130.
doi: 10.1038/s41598-020-69917-9.

Systematized reporter assays reveal ZIC protein regulatory abilities are Subclass-specific and dependent upon transcription factor binding site context

Affiliations

Systematized reporter assays reveal ZIC protein regulatory abilities are Subclass-specific and dependent upon transcription factor binding site context

Jehangir N Ahmed et al. Sci Rep. .

Abstract

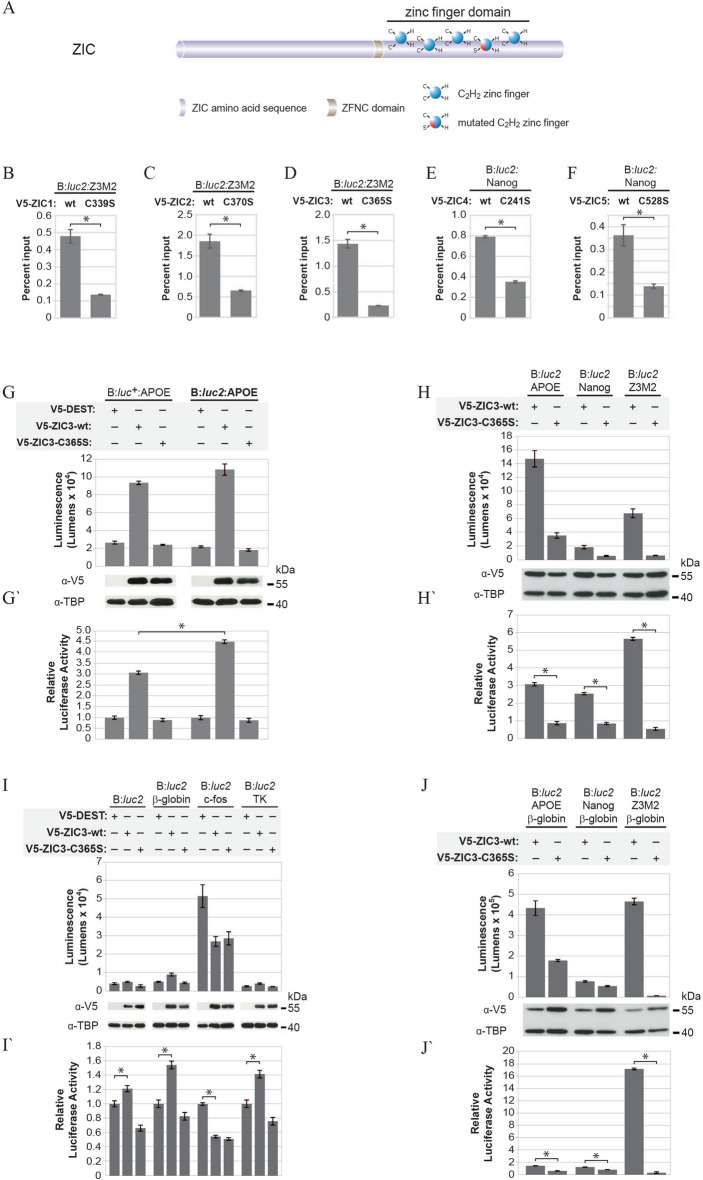
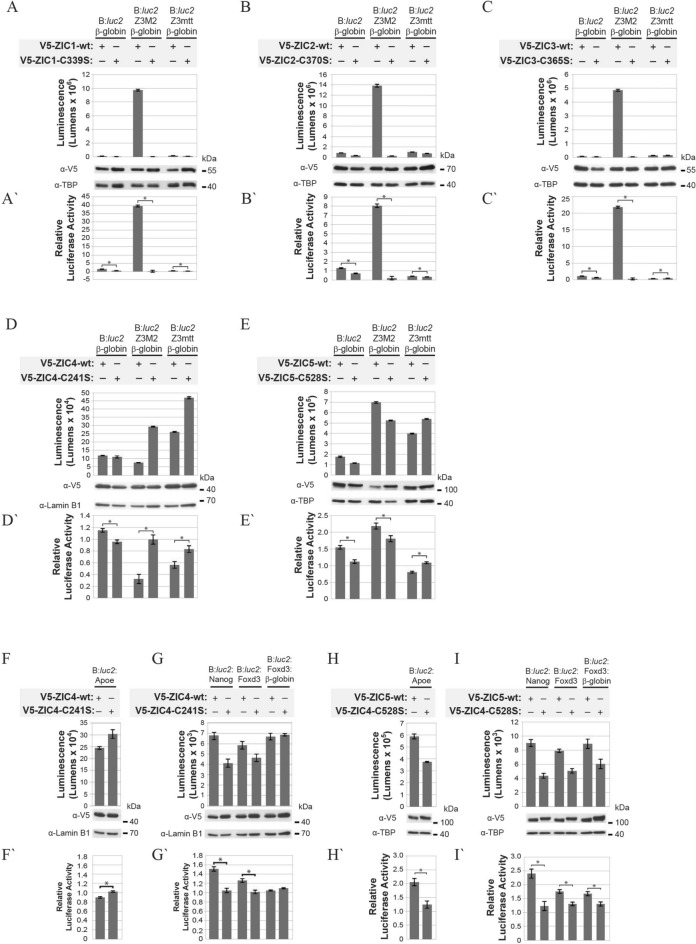
The ZIC proteins are a family of transcription regulators with a well-defined zinc finger DNA-binding domain and there is evidence that they elicit functional DNA binding at a ZIC DNA binding site. Little is known, however, regarding domains within ZIC proteins that confer trans-activation or -repression. To address this question, a new cell-based trans-activation assay system suitable for ZIC proteins in HEK293T cells was constructed. This identified two previously unannotated evolutionarily conserved regions of ZIC3 that are necessary for trans-activation. These domains are found in all Subclass A ZIC proteins, but not in the Subclass B proteins. Additionally, the Subclass B proteins fail to elicit functional binding at a multimerised ZIC DNA binding site. All ZIC proteins, however, exhibit functional binding when the ZIC DNA binding site is embedded in a multiple transcription factor locus derived from ZIC target genes in the mouse genome. This ability is due to several domains, some of which are found in all ZIC proteins, that exhibit context dependent trans-activation or -repression activity. This knowledge is valuable for assessing the likely pathogenicity of variant ZIC proteins associated with human disorders and for determining factors that influence functional transcription factor binding.


Conflict of interest statement

The authors declare no competing interests.

Figures

Figure 1
Figure 1
A new trans-activation assay for ZIC proteins. (A) Schematic representation of the missense mutation [second cysteine (C) converted to serine (S)] introduced into each ZIC protein. (BF) qPCR (N = 3) output following pIP from HEK293T cells co-transfected with the reporter construct (above line) and expression constructs (below line) shown. Error bars represent SD between three repeats, *p < 0.01 t-Test. (GJ) HEK293T cells were co-transfected with the reporter constructs (above line) and expression constructs (below line) shown. V5-DEST was also co-transfected with each reporter construct to measure background (not shown in panels H and J, see Fig. S1 for all data). For each transfection, luminescence was measured 24 h post-transfection in each of three replicate samples and each transfection repeated three times (N = 3). In each panel, the top graph (GJ) shows one representative experiment with the corresponding western blot. Error bars represent the SD between the three replicates. Expression of transfected proteins was confirmed with α-V5 and the α-TBP blot served as nuclear fraction loading control. Although cropped blots were used, the gels were run under the same experimental conditions. The bottom graph (G′J′) shows the mean RLA (normalised to V5-DEST such that the V5-DEST value becomes 1; not shown in H′ and J′) value from three independent repeats, Error bars represent SEM. *p < 0.01 ANOVA.
Figure 2
Figure 2
Trans-activation spectrum of ZIC proteins. HEK293T cells were co-transfected with the reporter constructs (above line) and expression constructs (below line) shown. V5-DEST was also co-transfected with each reporter to measure background (not shown, see Fig. S2 for all data). For each transfection, luminescence was measured 24 h post-transfection in each of three replicate samples and each transfection repeated three times (N = 3). In each panel, the top graph (A–I) shows one representative experiment with the corresponding western blot. Error bars represent the SD between the three replicates. Expression of transfected proteins was confirmed with α-V5 and the α-TBP or α-Lamin B1 blot served as nuclear fraction loading control. Although cropped blots were used, the gels were run under the same experimental conditions. The bottom graph (A′I′) shows the mean RLA value (normalised to V5-DEST such that the V5-DEST value becomes 1; note the normalised V5-DEST is not shown) calculated from three independent repeats. Error bars represent SEM. *p < 0.01 ANOVA.
Figure 3
Figure 3
C-terminal regions and ZFD of ZIC3 are required for trans-activation. (A, B) Schematic representation of wildtype ZIC3 and (A) PTC-containing mutants or (B) ZF mutants containing a missense mutation in the second cysteine (C) [converted to serine (S)]. (CF) HEK293T cells were co-transfected with the reporter construct (above line) and expression constructs (below line) shown. For each transfection, luminescence was measured 24 h post-transfection in each of three replicate samples and each transfection repeated three times (N = 3). In each panel, the top graph (CF) shows one representative experiment with the corresponding western blot. Error bars represent SD between the three replicates. Expression of the transfected proteins was confirmed with α-V5 and the α-LaminB1 (C, D) or α-TBP (E, F) blots served as nuclear fraction loading control. Although cropped blots were used, the gels were run under the same experimental conditions. The bottom graph (C′F′) shows mean RLA (normalised to V5-DEST such that the V5-DEST value becomes 1), N = 3. Error bars represent SEM. a, b and c: p < 0.01 ANOVA.
Figure 4
Figure 4
N-terminal of ZIC3 is required for trans-activation. (A) Schematic representation of the ZIC3 deletion mutants used. ZIC3-ZOCdel is missing the ZOC domain (green band); ZIC3-ZFNCdel is missing the ZFNC domain (brown band); ZIC3-Ndel is missing the entire N-terminal (amino acids preceding ZF1); ZIC3-Aladel is missing the Alanine tract (orange band); and ZIC3-Hisdel is missing the Histidine tract (yellow band). (BE) HEK293T cells were co-transfected with the reporter construct (above line) and expression constructs (below line) shown. For each transfection, luminescence was measured 24 h post-transfection in each of three replicate samples and each transfection repeated three times (N = 3). In each panel, the top graph (BE) shows one representative experiment with the corresponding western blot. Error bars represent SD between the three replicates. Expression of the transfected proteins was confirmed with α-V5 and the α-TBP blot served as nuclear fraction loading control. Although cropped blots were used, the gels were run under the same experimental conditions. The bottom graph (B′E′) shows mean RLA (normalised to V5-DEST such that the V5-DEST value becomes 1), N = 3. Error bars represent SEM. a, b, c and d: p < 0.01 ANOVA.
Figure 5
Figure 5
Subclass A ZIC proteins contain two evolutionary conserved regions that regulate transcription. (A, B) ZIC protein sequence alignment of (A) the N-terminal (SANC) and (B) the C-terminal (SACC) evolutionary conserved regions found in a variety of metazoan species: Ap, Asterina pectinifera; Sp, Strongylocentrotus purpuratus; Bf, Branchiostoma floridae; Cj, Corbicula sp.; Sso, Spisula solidissima; Lb, Loligo bleekeri; Hs, Homo sapiens; Mm, Mus musculus; Xl, Xenopus laevis; Dr, Danio rerio. Asterick (*) = identical residues. Colon (:) = functionally conserved residues. Period (.) = weak conservation of residue. (C) Schematic representation of the ZIC3 deletion mutants created. ZIC3-SANCdel is missing the SANC domain; ZIC3-SACCdel is missing the SACC domain. (D, E) HEK293T cells were co-transfected with the reporter construct (above line) and expression constructs (below line) shown. For each transfection, luminescence was measured 24 h post-transfection in each of three replicate samples and each transfection repeated three times (N = 3). In each panel, the top graph (D, E) shows one representative experiment with the corresponding western blot. Error bars represent SD between three internal replicates. Expression of the transfected proteins was confirmed with α-V5 and the α-TBP blot served as nuclear fraction loading control. Although cropped blots were used, the gels were run under the same experimental conditions. The bottom graph (D′, E′) shows mean RLA (normalised to V5-DEST such that the V5-DEST value becomes 1). Error bars represent SEM. a, b, and c: p < 0.01 ANOVA.

References

    1. Ali RG, Bellchambers HM, Arkell RM. Zinc fingers of the cerebellum (Zic): Transcription factors and co-factors. Int. J. Biochem. Cell Biol. 2012;44:2065–2068. - PubMed
    1. Houtmeyers R, Souopgui J, Tejpar S, Arkell RM. The ZIC gene family encodes multi-functional proteins essential for patterning and morphogenesis. Cell. Mol. Life Sci. 2013;70:3791–3811. - PMC - PubMed
    1. Aruga J, et al. A wide-range phylogenetic analysis of Zic proteins: Implications for correlations between protein structure conservation and body plan complexity. Genomics. 2006;87:783–792. - PubMed
    1. Hatayama M, Aruga J. Characterization of the tandem CWCH2 sequence motif: A hallmark of inter-zinc finger interactions. BMC Evol. Biol. 2010;10:53. - PMC - PubMed
    1. Koyabu Y, Nakata K, Mizugishi K, Aruga J, Mikoshiba K. Physical and Functional Interactions between Zic and Gli Proteins. J. Biol. Chem. 2001;276:6889–6892. - PubMed

Publication types

Substances