. 2020 Jul 10:11:1283.
doi: 10.3389/fpsyg.2020.01283. eCollection 2020.

Beyond Screen Time: A Synergistic Approach to a More Comprehensive Assessment of Family Media Exposure During Early Childhood

Affiliations

Beyond Screen Time: A Synergistic Approach to a More Comprehensive Assessment of Family Media Exposure During Early Childhood

Rachel Barr et al. Front Psychol. .

Abstract

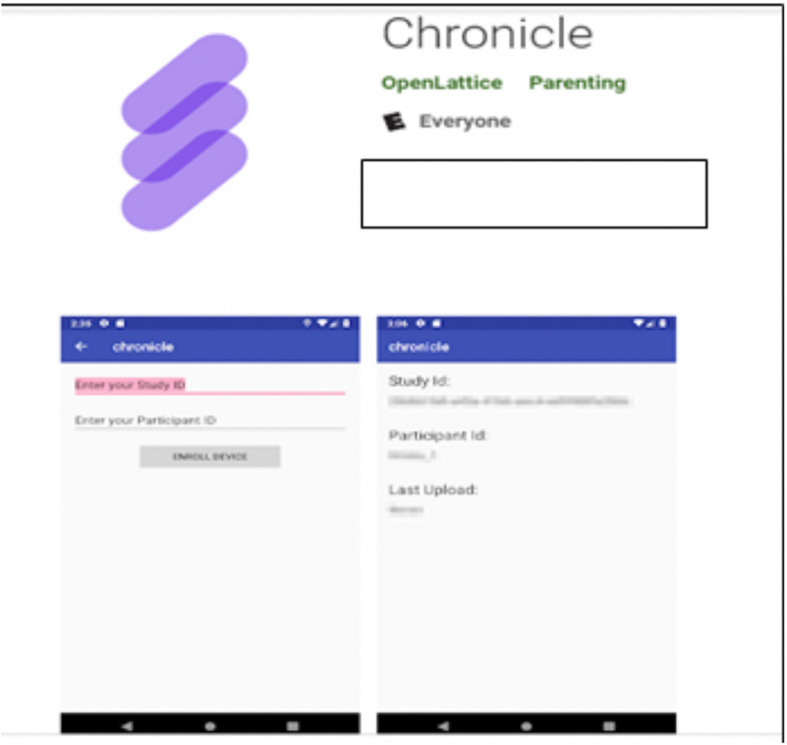
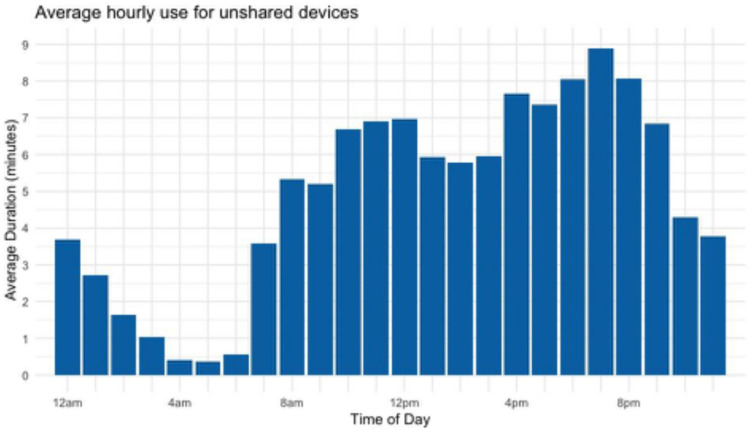
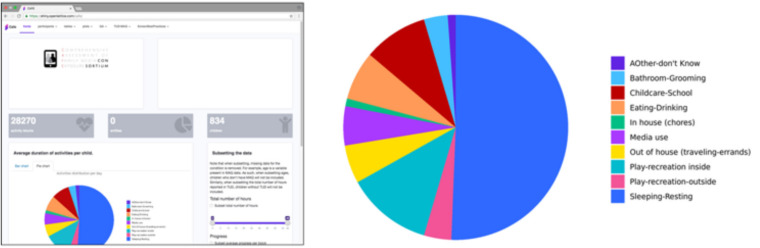
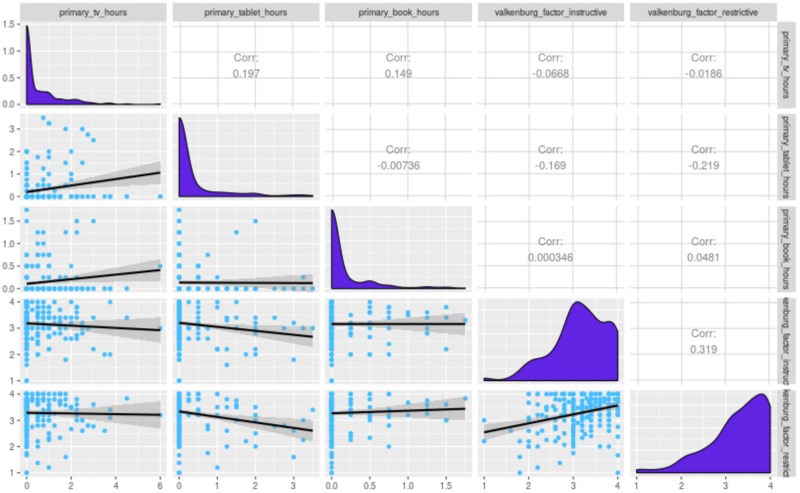
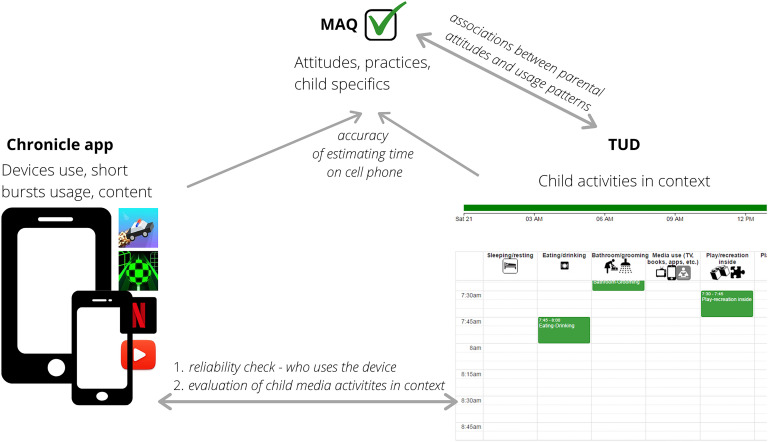
Digital media availability has surged over the past decade. Because of a lack of comprehensive measurement tools, this rapid growth in access to digital media is accompanied by a scarcity of research examining the family media context and sociocognitive outcomes. There is also little cross-cultural research in families with young children. Modern media are mobile, interactive, and often short in duration, making them difficult to remember when caregivers respond to surveys about media use. The Comprehensive Assessment of Family Media Exposure (CAFE) Consortium has developed a novel tool to measure household media use through a web-based questionnaire, time-use diary, and passive-sensing app installed on family mobile devices. The goal of developing a comprehensive assessment of family media exposure was to take into account the contextual factors of media use and improve upon the limitations of existing self-report measures, while creating a consistent, scalable, and cost-effective tool. The CAFE tool captures the content and context of early media exposure and addresses the limitations of prior media measurement approaches. Preliminary data collected using this measure have been integrated into a shared visualization platform. In this perspective article, we take a tools-of-the-trade approach (Oakes, 2010) to describe four challenges associated with measuring household media exposure in families with young children: measuring attitudes and practices; capturing content and context; measuring short bursts of mobile device usage; and integrating data to capture the complexity of household media usage. We illustrate how each of these challenges can be addressed with preliminary data collected with the CAFE tool and visualized on our dashboard. We conclude with future directions including plans to test reliability, validity, and generalizability of these measures.

Keywords: digital media; early childhood; household usage patterns; joint media engagement; passive sensing; technoference; time use activity data.


Figures

FIGURE 1
FIGURE 1
CAFE Consortium sites around the globe. Data collection is ongoing or planned at each site.
FIGURE 2
FIGURE 2
A correlogram depicting parents’ responses to the Valkenburg et al. (1999) mediation scale.
FIGURE 3
FIGURE 3
Illustration of a completed time-use diary. A help button contains instructional videos describing how to complete the diary, how to delete an activity, and how to know that the diary is complete. Parents click-and-drag to fill 15-min time blocks of child activities across the day. After creating a time block, they click on the time block to complete follow-up questions. The horizontal timeline at the top and the bottom of the diary indicates when each time block is complete by changing color from gray to green.
FIGURE 4
FIGURE 4
Mean parent-reported primary and background TV on the previous day (using the TUD) as a function of parent education (using the MAQ). Primary TV is reported by selecting media use as a primary activity on the time diary grid and indicating that the media type was TV during the follow-up questions about media content and context. Background TV is reported by selecting one of several other primary activities (e.g., sleeping, playing, eating) and indicating that TV was on in the background during the follow-up questions about context. This figure is based on a subset of participants with a TUD (n = 493, 70%) who provided their education level, reported at least 18 h (but not more than 26 h) on the diary and who opened the follow-up questions for at least 90% of the activity blocks in their TUD.
FIGURE 5
FIGURE 5
Illustration of the amount of time parents reported background TV (top) and parent mobile device use (bottom) were present (blue/true) or absent (purple/false) during each activity in the TUD. Background TV and parent mobile device use are reported during the follow-up questions about media context for some activities. Gray shading indicates that the follow-up questions did not ask about background TV or parent mobile device use for a particular category (if the entire bar is gray), or the parent did not answer the follow-up question for one or more blocks of time (bars with one small gray segment). This figure is based on a subset of participants with a TUD (n = 500, 71%) who reported at least 18 h (but not more than 26 h) on the diary and who opened the follow-up questions for at least 90% of the activity blocks in their TUD.
FIGURE 6
FIGURE 6
The interface that parents receive on downloading the Chronicle application from the Google Play Store. Participants receive a unique ID number.
FIGURE 7
FIGURE 7
Average hourly usage by time of day, aggregated over all children with their own individual tablets as tracked by Chronicle. Generated from data collected in Michigan from August 2018 to May 2019. n = 37, aged 36–60 months.
FIGURE 8
FIGURE 8
Screenshot from the dashboard landing page (left) that provides data visualization of the time use activities (expanded on the right), the number of participants, and options for subsetting the data for further visualization and analysis.
FIGURE 9
FIGURE 9
Distributions, scatterplots, and correlations between the primary TV hours, tablet hours, and book hours from the TUD and the Valkenburg instructive and restrictive scales from the MAQ. Along the diagonal are distributions of each variable. Above the diagonal are Pearson correlation coefficients. Below the diagonal are scatterplots between the variables. Initial visual inspection of the data suggests associations between tablet use and parental mediation may exist, which can be further tested in the dashboard. This figure is based on a subset of participants with a TUD (n = 231) who were between 30 and 72 months, reported at least 18 h (but not more than 26 h) on the diary, and opened the follow-up questions for at least 90% of the activity blocks in their TUD.
FIGURE 10
FIGURE 10
Comparison of parent-reported child mobile device use category from the MAQ to median daily usage calculated from Chronicle on weekdays (top) and weekends (bottom). This figure is based on a small sample collected in Michigan (n = 37 parents with a child 36–60 months old).
FIGURE 11
FIGURE 11
Conceptual overview linking the MAQ, TUD, and Chronicle to support reliability and validity testing. This work is ongoing.

References

    1. Abidin R. R. (1995). Parenting Stress Index: Professional Manual, 3rd Edn Lutz, FL: Psychological Assessment Resources, Inc.
    1. Acevedo-Polakovich I. D., Lorch E. P., Milich R., Ashby R. D. (2006). Disentangling the relation between television viewing and cognitive processes in children with attention-deficit/hyperactivity disorder and comparison children. Arch. Pediatric. Adolesc. Med. 160 354–360. - PubMed
    1. Anand S., Krosnick J. (2005). Demographic predictors of media use among infants, toddlers, and preschoolers. Am. Behav. Sci. 48 539–561. 10.1177/0002764204271512 - DOI
    1. Anderson D. R., Field D. E., Collins P. A., Lorch E. P., Nathan J. G. (1985). Estimates of young children’s time with television: a methodological comparison of parent reports with time-lapse video home observation. Child Dev. 56 1345–1357. - PubMed
    1. Anderson D. R., Hanson K. G. (2017). Screen Media and Parent-Child Interactions. Media Exposure During Infancy and Early Childhood: The Effect of Content and Context on Learning and Development. New York, NY: Springer, 173–194.