. 2020 Jul 10:11:1426.
doi: 10.3389/fimmu.2020.01426. eCollection 2020.

Profiling the Course of Resolving vs. Persistent Inflammation in Human Monocytes: The Role of IL-1 Family Molecules

Affiliations

Profiling the Course of Resolving vs. Persistent Inflammation in Human Monocytes: The Role of IL-1 Family Molecules

Paola Italiani et al. Front Immunol. .

Abstract

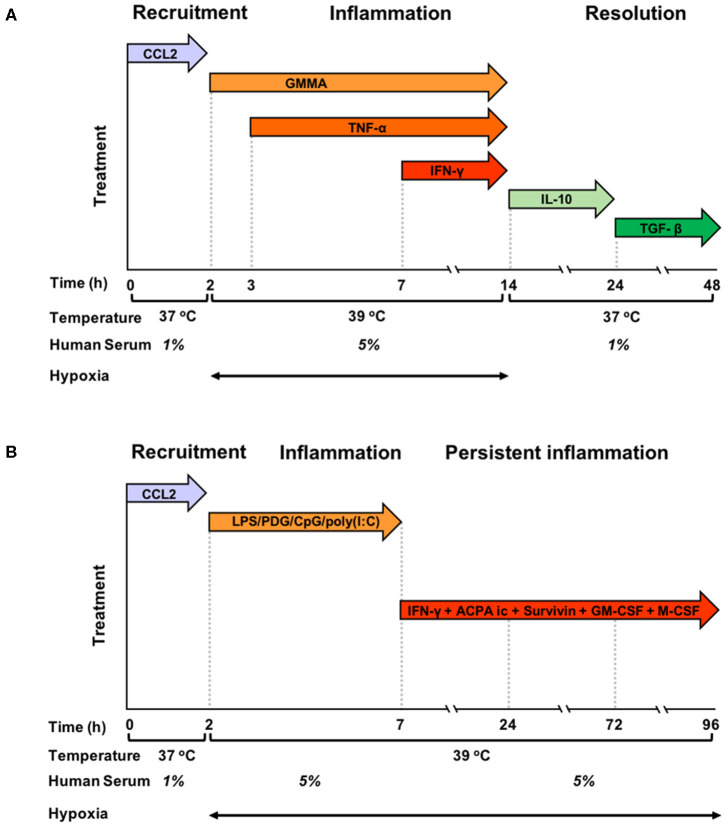
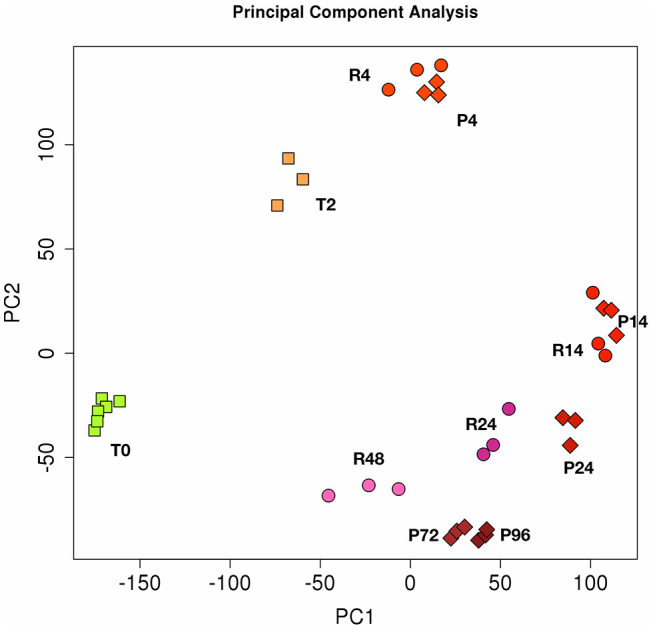
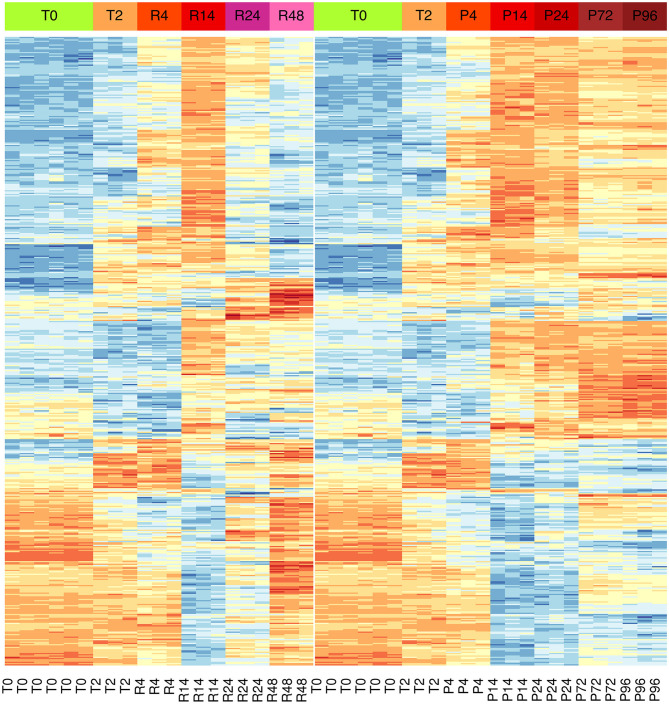
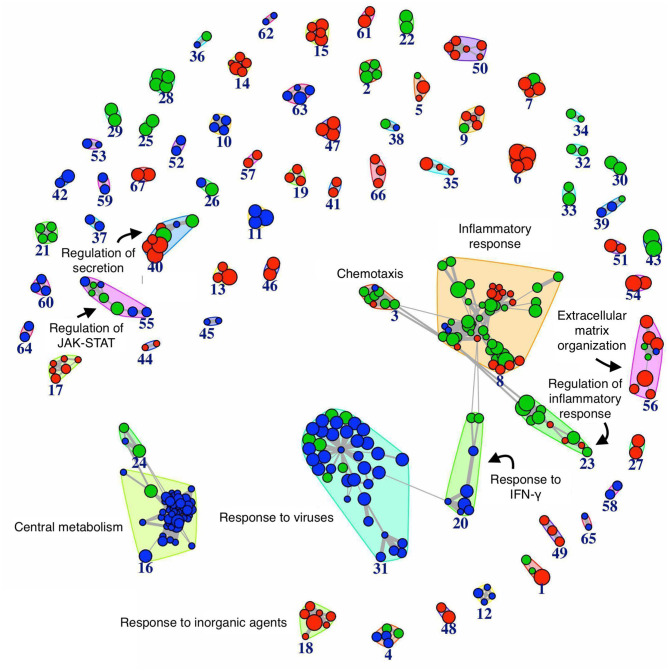
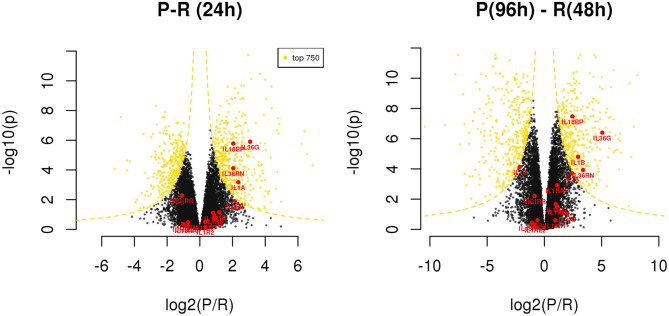
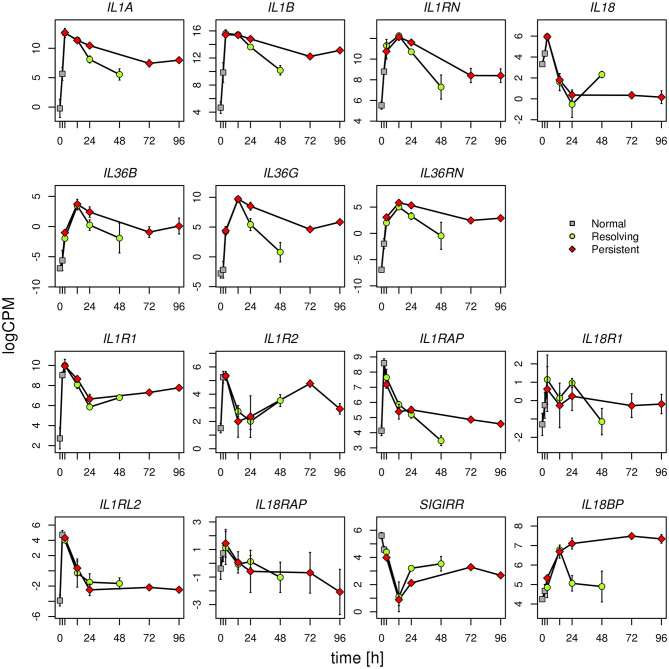
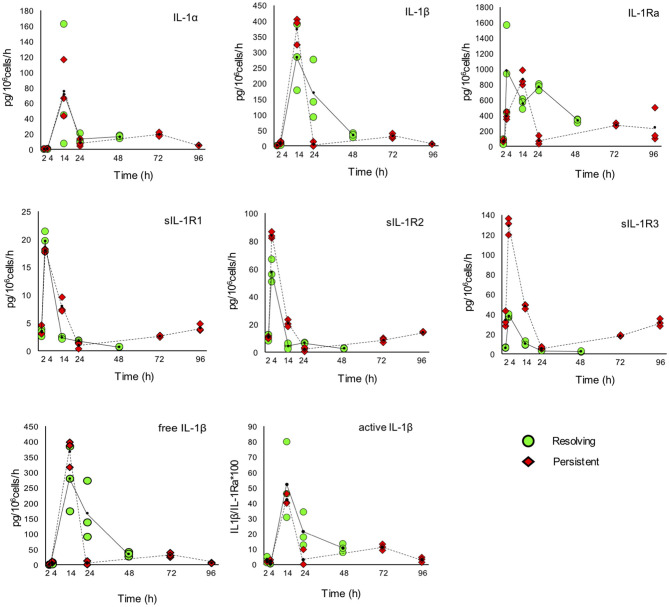
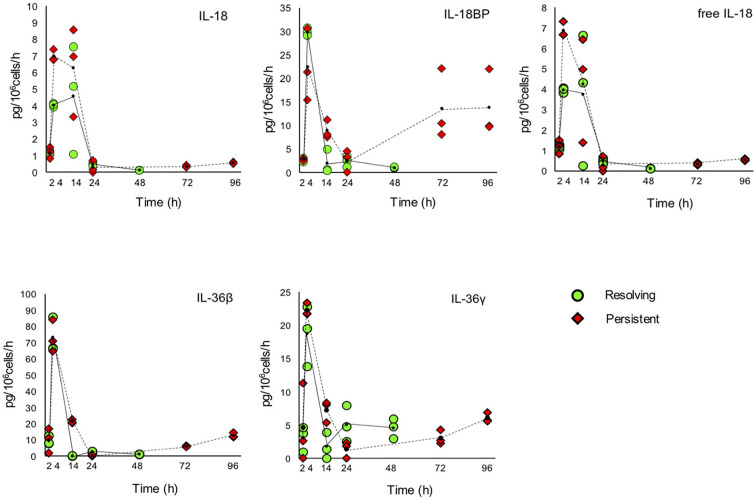
Monocytes and macrophages have a central role in all phases of an inflammatory reaction. To understanding the regulation of monocyte activation during a physiological or pathological inflammation, we propose two in vitro models that recapitulate the different phases of the reaction (recruitment, initiation, development, and resolution vs. persistence of inflammation), based on human primary blood monocytes exposed to sequential modifications of microenvironmental conditions. These models exclusively describe the functional development of blood-derived monocytes that first enter an inflammatory site. All reaction phases were profiled by RNA-Seq, and the two models were validated by studying the modulation of IL-1 family members. Genes were differentially modulated, and distinct clusters were identified during the various phases of inflammation. Pathway analysis revealed that both models were enriched in pathways involved in innate immune activation. We observe that monocytes acquire an M1-like profile during early inflammation, and switch to a deactivated M2-like profile during both the resolving and persistent phases. However, during persistent inflammation they partially maintain an M1 profile, although they lose the ability to produce inflammatory cytokines compared to M1 cells. The production of IL-1 family molecules by ELISA reflected the transcriptomic profiles in the distinct phases of the two inflammatory reactions. Based on the results, we hypothesize that persistence of inflammatory stimuli cannot maintain the M1 activated phenotype of incoming monocytes for long, suggesting that the persistent presence of M1 cells and effects in a chronically inflamed tissue is mainly due to activation of newly incoming cells. Moreover, being IL-1 family molecules mainly expressed and secreted by monocytes during the early stages of the inflammatory response (within 4-14 h), and the rate of their production decreasing during the late phase of both resolving and persistent inflammation, we suppose that IL-1 factors are key regulators of the acute defensive innate inflammatory reaction that precedes establishment of longer-term adaptive immunity, and are mainly related to the presence of recently recruited blood monocytes. The well-described role of IL-1 family cytokines and receptors in chronic inflammation is therefore most likely dependent on the continuous influx of blood monocytes into a chronically inflamed site.

Keywords: IL-1 family; in vitro model; inflammation; macrophages; monocytes.


Figures

Figure 1
Figure 1
Graphic representation of the kinetic development of resolving and persistent inflammation in the human monocyte-based in vitro models. (A) Freshly isolated human blood monocytes were first exposed to the chemokine CCL2 for 2 h at 37°C with 1% serum in normoxic conditions, then, after washing, to GMMA (from 2 h), TNF-α (from 3 h, without washing), and IFN-γ (from 7 h, without washing) at 39°C with 5% serum in hypoxic conditions. At 14 h, the inflammatory stimuli were washed off, temperature and serum concentration brought back to 37°C and 1%, respectively, and fresh medium containing IL-10 added. At 24 h, IL-10 was washed off and monocytes were exposed to TGF-β until the end of the experiment. (B) Freshly isolated human blood monocytes were first exposed to the chemokine CCL2 for 2 h at 37°C with 1% serum in normoxic conditions, then, after washing to LPS, PDG, poly(I:C), and CpG (from 2 to 7 h) at 39°C with 5% serum in hypoxic conditions. At 7 h, the inflammatory stimuli were washed off, and fresh medium containing ACPA complexes, GM-CSF, M-CSF, Survivin, and IFN-γ was added. The temperature was kept to 39°C, serum at 5% and oxygen tension at hypoxic levels until the end of the experiment. Cells were harvested at 0, 2, 4, 14, 24, and 48 h for the resolving model, and at 0, 2, 4, 14, 24, 72, and 96 h in the persistent model. Supernatants were collected at the same time points, except for time 0.
Figure 2
Figure 2
Principal component analysis (PCA) of gene expression in resolving and persistent inflammatory models. Each dot represents a sample. Six samples (monocytes from 6 different donors) were analysed at time 0 (T0) and three after 2 h with CCL2 (T2). Three samples were examined for each time point of the two models after sequential stimulations as described in the Figures 1A,B (3 donors for the resolving model, R; and 3 donors for the persistent model, P). Numbers represent the time points: 4, 14, 24, and 48 h for resolving inflammation; 4, 14, 24, 72, and 96 h for persistent inflammation. The samples cluster in different areas from left to right, based on the time points of stimulation, which correspond to different phases of inflammatory reactions.
Figure 3
Figure 3
Differential gene expression during the inflammation phases of the resolving and persistent inflammatory models. Heat-maps of the 500 genes with the most significant expression differences (limma moderated F-statistics, FDR < 0.05) between the two models at any time point (Supplementary Table 3). Left: resolving inflammation model; right: persistent inflammation model. The gene clusters show that the two models are very similar from 0 to 14 h, but they begin to diverge from 14 to 24 h. Colors represent gene expression (gene-wise z-score); blue: low; red: high.
Figure 4
Figure 4
Network of biological pathways enriched in differentially expressed genes between resolving and persistent inflammation. Network of pathways significantly enriched (see Materials and Methods) in genes differentially expressed between the two models at 24 h, and between resolving inflammation at 48 h (R48) and persistent inflammation at 96 h (P96). The bigger the circle, the higher the number of genes in the pathway. Circle colors reflect pathway occurrence among the top 500 pathways at 24 h only (blue), between P96 vs. R48 (red), or both (green). Links are reported only between any pathway pair (X, Y) with overlap coefficient O(X,Y)=|XY|min(|X|,|Y|)0.7. See Supplementary Tables 4, 5.
Figure 5
Figure 5
Differentially expressed genes between resolving and persistent models. For each comparison, genes are reported on considering BH adjusted P-value (y axis) and log2 fold change (x axis); the yellow dotted lines depict the hyperboles that separate the top 750 genes (yellow points) ranked by s score (see Materials and Methods), i.e., the product between the quantities reported on the two axes. See Supplementary Table 6.
Figure 6
Figure 6
Gene expression profiles of IL-1 family cytokines and receptors. Expression levels of the genes of IL-1 family during the resolving and persistent inflammatory reactions. The mean expression values from three different donors for each model are reported. logCPM: log count per million. Bars indicate standard deviation across biological replicates. Statistically significant differences are as follows (R = resolving; P = persistent): IL1A R24 vs. P24 P < 0.001; R48 vs. P96 P < 0.0001 IL1B R48 vs. P96 P < 0.0001 IL18 R48 vs. P96 P < 0.0001 IL36B R24 vs. P24 P < 0.05 IL36G R24 vs. P24 P < 0.0001; R48 vs. P96 P < 0.0001 IL36RN R24 vs. P24 P < 0.0001; R48 vs. P96 P < 0.001 IL1RAP R48 vs. P96 P < 0.05 SIGIRR R24 vs. P24 P < 0.05; R48 vs. P96 P < 0.05 IL18BP R24 vs. P24 P < 0.0001; R48 vs. P96 P < 0.0001 All other differences have a P > 0.05.
Figure 7
Figure 7
Production of IL-1 family cytokines and receptors during resolving and persistent in vitro inflammatory reactions. Production of IL-1 family cytokines and soluble receptors during the resolving (green circles, continuous line) and persistent (red triangles, dashed line) in vitro inflammatory reactions. Production of soluble proteins released in the supernatant is reported in terms of rate of production, i.e., the amount of protein produced per million cells per hour. The individual values of three different donors are reported, with a small black dot representing the mean value. Statistical significance was calculated with one-way ANOVA followed by Tukey's multiple comparisons test for significant differences between two consecutive experimental time points within a model and between the two models. A P-value < 0.05 was considered statistically significant. The full statistical evaluation is reported in the Supplementary Tables 7, 8.
Figure 8
Figure 8
Production of IL-1 family cytokines and receptors during resolving and persistent in vitro inflammatory reactions. Production of IL-1 family cytokines and soluble receptors during the resolving (green circles, continuous line) and persistent (red triangles, dashed line) in vitro inflammatory reactions. Production of soluble proteins released in the supernatant is reported in terms of rate of production, i.e., the amount of protein produced per million cells per hour. The individual values of three different donors are reported, with a small black dot representing the mean value. Statistical significance was calculated with one-way ANOVA followed by Tukey's multiple comparisons test for significant differences between two consecutive experimental time points within a model and between the two models. A P-value < 0.05 was considered statistically significant. The full statistical evaluation is reported in the Supplementary Tables 7, 9.
Figure 9
Figure 9
Differentially expressed inflammasome and NLR genes during resolving and persistent in vitro inflammatory reactions. Heat-maps represent fold-expression levels of the inflammasome-related and NLR genes in the in vitro models of resolving (left) and persistent inflammation (right). Time points are indicated as described for Figure 2.

References

    1. Medzhitov R. Inflammation 2010: new adventures of an old flame. Cell. (2010) 140:771–6. 10.1016/j.cell.2010.03.006 - DOI - PubMed
    1. Kotas ME, Medzhitov R. Homeostasis, inflammation, and disease susceptibility. Cell. (2015) 160:816–27. 10.1016/j.cell.2015.02.010 - DOI - PMC - PubMed
    1. Murray PJ. Macrophage polarization. Annu Rev Physiol. (2017) 79:541–66. 10.1146/annurev-physiol-022516-034339 - DOI - PubMed
    1. Ginhoux F, Jung S. Monocytes and macrophages: developmental pathways and tissue homeostasis. Nat Rev Immunol. (2014) 14:392–404. 10.1038/nri3671 - DOI - PubMed
    1. Ginhoux F, Guilliams M. Tissue-resident macrophage ontogeny and homeostasis. Immunity. (2016) 44:439–49. 10.1016/j.immuni.2016.02.024 - DOI - PubMed

Publication types

LinkOut - more resources