. 2020 Oct 1;31(21):2315-2330.
doi: 10.1091/mbc.E20-04-0252. Epub 2020 Aug 5.

PP1 promotes cyclin B destruction and the metaphase-anaphase transition by dephosphorylating CDC20

Affiliations

PP1 promotes cyclin B destruction and the metaphase-anaphase transition by dephosphorylating CDC20

James Bancroft et al. Mol Biol Cell. .

Erratum in

  • Correction.
    [No authors listed] [No authors listed] Mol Biol Cell. 2021 Apr 1;32(7):634. doi: 10.1091/mbc.E20-04-0252-corr. Mol Biol Cell. 2021. PMID: 33793323 Free PMC article. No abstract available.

Abstract

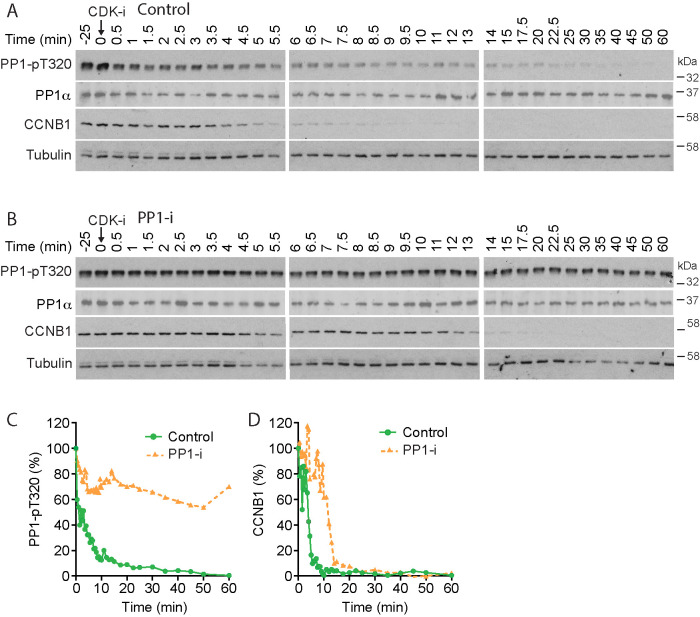
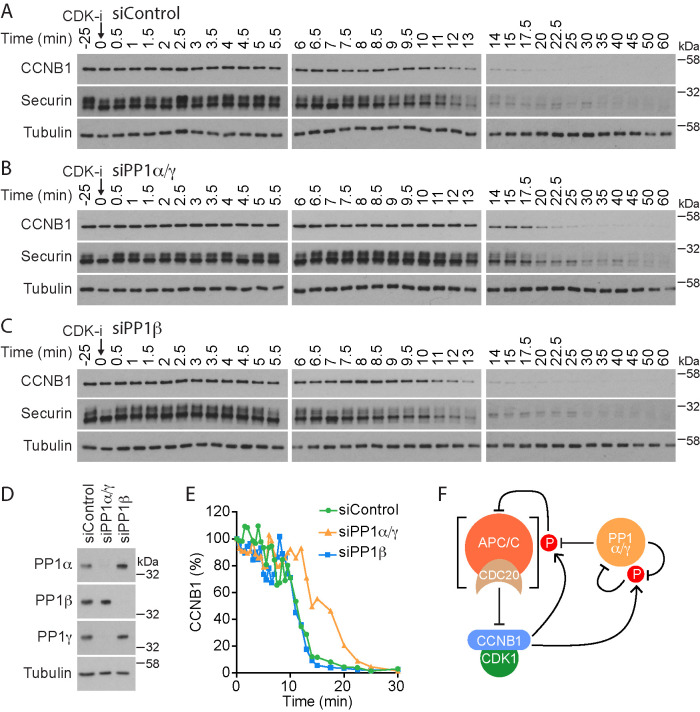
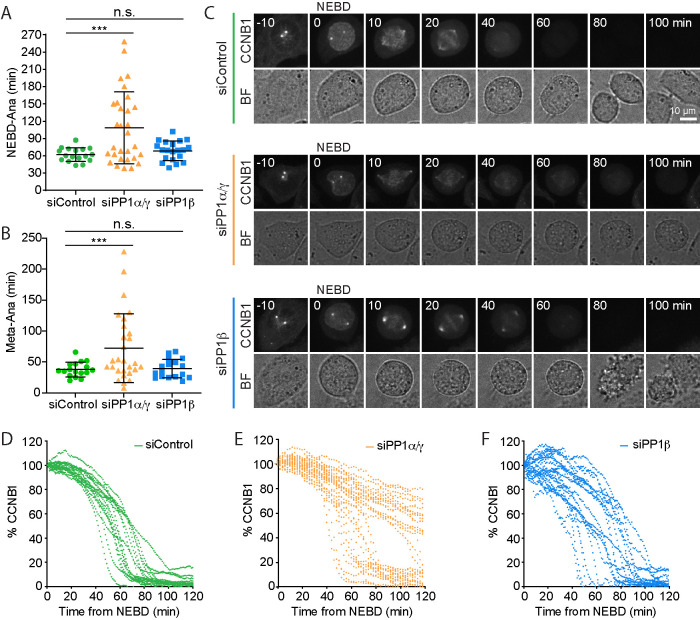
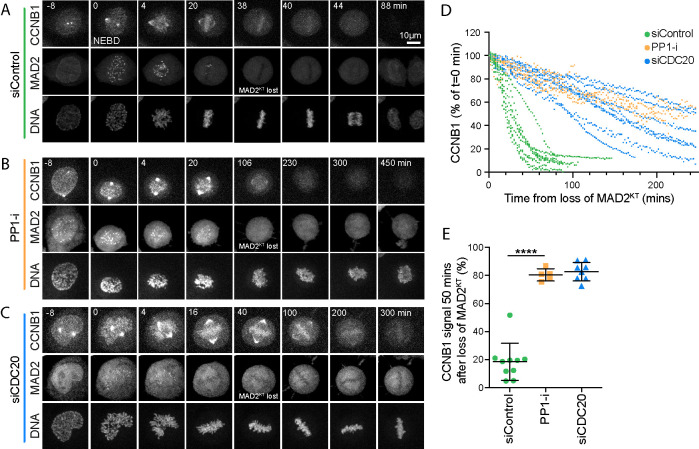
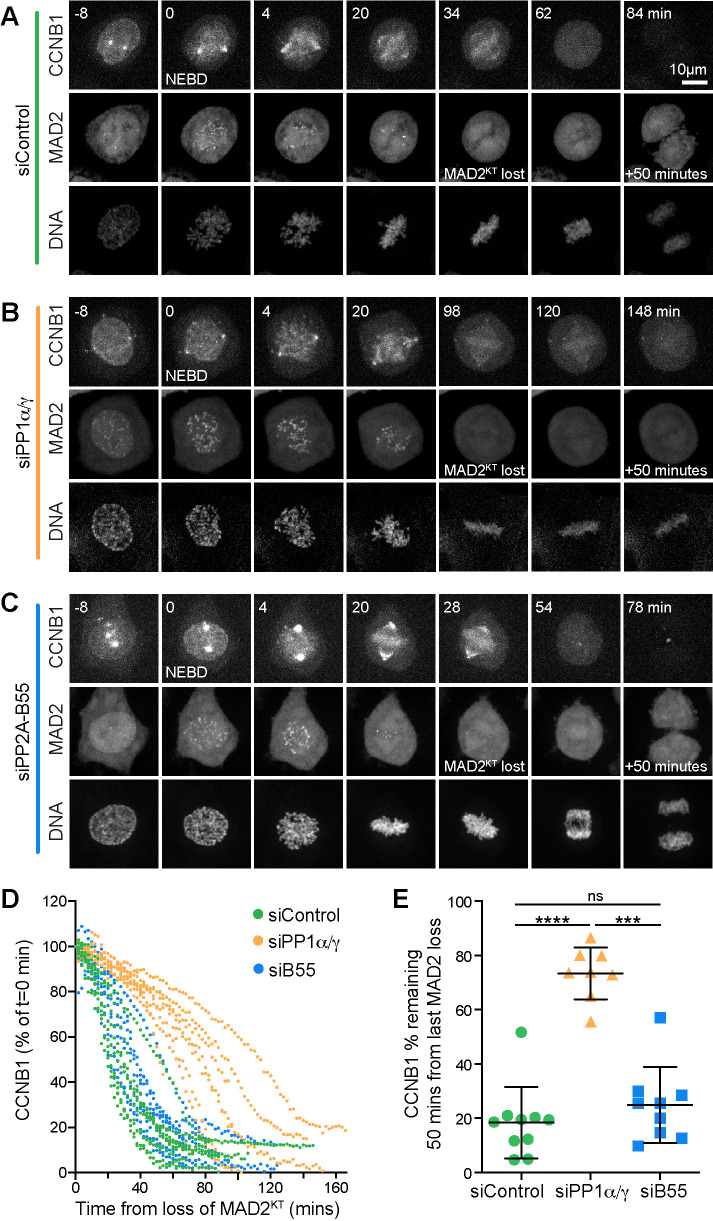
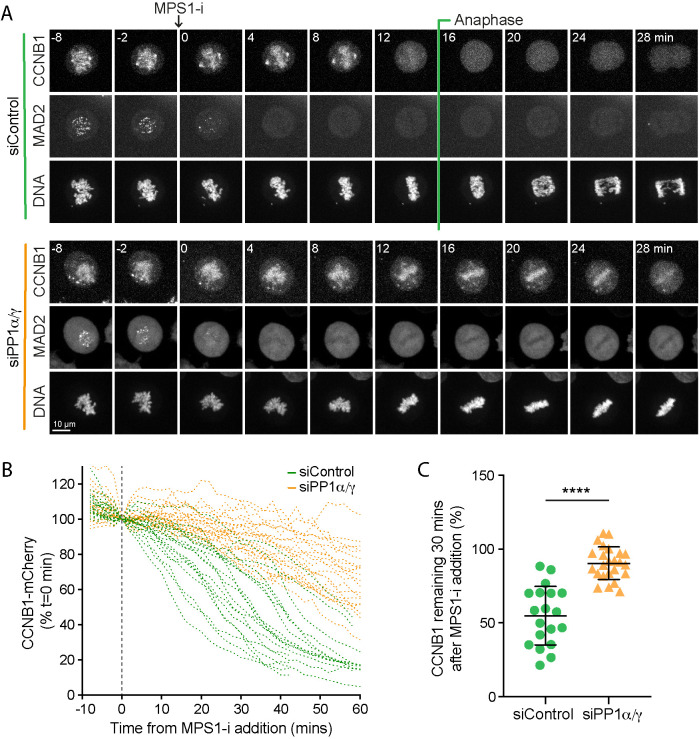
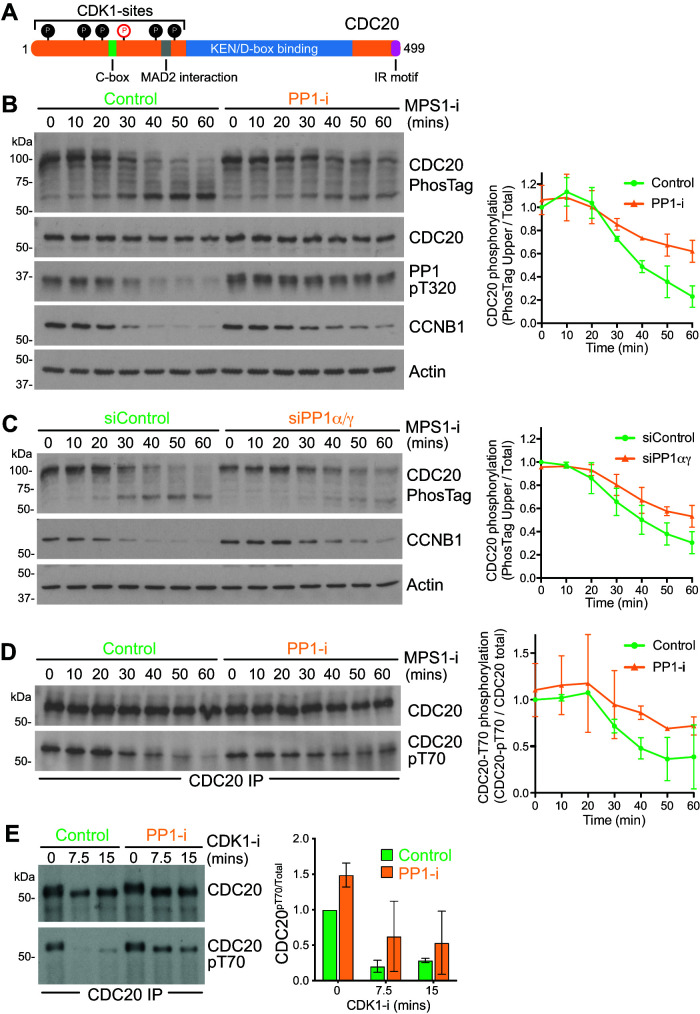
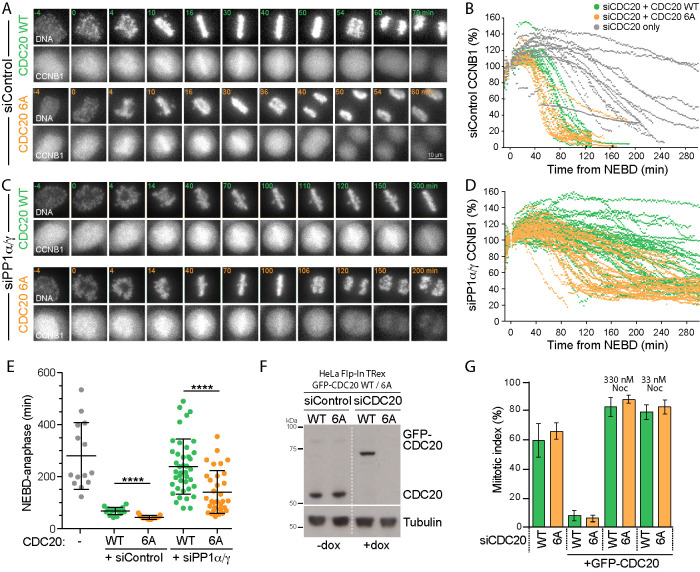
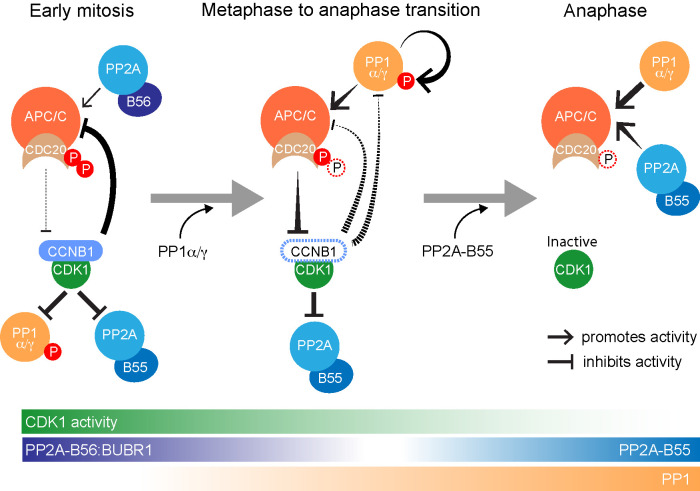
Ubiquitin-dependent proteolysis of cyclin B and securin initiates sister chromatid segregation and anaphase. The anaphase-promoting complex/cyclosome and its coactivator CDC20 (APC/CCDC20) form the main ubiquitin E3 ligase for these two proteins. APC/CCDC20 is regulated by CDK1-cyclin B and counteracting PP1 and PP2A family phosphatases through modulation of both activating and inhibitory phosphorylation. Here, we report that PP1 promotes cyclin B destruction at the onset of anaphase by removing specific inhibitory phosphorylation in the N-terminus of CDC20. Depletion or chemical inhibition of PP1 stabilizes cyclin B and results in a pronounced delay at the metaphase-to-anaphase transition after chromosome alignment. This requirement for PP1 is lost in cells expressing CDK1 phosphorylation-defective CDC206A mutants. These CDC206A cells show a normal spindle checkpoint response and rapidly destroy cyclin B once all chromosomes have aligned and enter into anaphase in the absence of PP1 activity. PP1 therefore facilitates the metaphase-to-anaphase transition by promoting APC/CCDC20-dependent destruction of cyclin B in human cells.


Figures

FIGURE 1:
FIGURE 1:
PP1 counteracts CDK1 regulation of APC/C during mitotic exit. (A, B) HeLa cells were arrested in mitosis and incubated for 25 min with either (A) DMSO (Control) or (B) 5 µM tautomycetin PP1 inhibitor (PP1-i). CDK1 was then inhibited (CDK-i) using 5 µM flavopiridol, and samples of the culture were taken at the times indicated and Western blotted for the indicated markers. (C) PP1α-pT320 and (D) CCNB1 levels were measured as a function of time and plotted in the line graphs for the representative experiments shown in A and B.
FIGURE 2:
FIGURE 2:
Identification of the major PP1 isoforms counteracting CDK1 regulation of APC/C. (A–C) HeLa cells were either (A) treated with control siRNA (siControl) or depleted for catalytic subunits of (B) PP1α/γ (PP1α/γ) or (C) PP1β (PP1β) and then arrested in mitosis. Mitotic exit was then triggered by CDK1 inhibition (CDK-i), and samples were taken for Western blot at the times indicated. (D) Western blot confirming efficient depletion of PP1 catalytic subunits. (E) CCNB1 levels were measured as a function of time in siControl, siPP1α/γ, and siPP1β for the representative experiments shown in A–C and plotted in the line graph. (F) Schematic depicting the potential role of PP1 in counteracting inhibitory CDK1-cyclin B phosphorylation of APC/CCDC20. CDK1-cyclin B phosphorylation also inhibits PP1 activity, and PP1 reactivates via an autocatalytic process. These are all freely reversible reactions. Activated APC/CCDC20 feeds back to irreversibly inhibit CDK1-cyclin B by promoting cyclin B destruction.
FIGURE 3:
FIGURE 3:
PP1 is needed for rapid destruction of cyclin B at the metaphase–anaphase transition. (A, B) Comparison of the time spent (A) in mitosis or (B) to enter anaphase following completion of a metaphase plate in siControl, siPP1α/γ depletion, or siPP1β depletion for CRISPR-tagged CCNB1-GFP HeLa cells. Scatter plots of mean ± SD are shown for siControl (n = 17), siPP1α/γ (n = 30), and siPP1β (n = 20). ** denotes p < 0.001. (C) Live cell imaging of CCNB1-GFP with times shown in minutes. Percentage of CCNB1-GFP fluorescence following NEBD in (D) siControl, (E) siPP1α/γ, and (F) siPP1β cells. Brightfield images (BF) show the cell outline. CCNB1 images are maximum-intensity projections; quantification was carried out on sum intensity projections, and the single-cell traces were plotted as a function of time from NEBD in the graphs.
FIGURE 4:
FIGURE 4:
PP1 inhibition prevents rapid cyclin B destruction downstream of the spindle checkpoint. (A–C) HeLa CCNB1-mCherry GFP-MAD2 cells treated with (A) control siRNA, (B) 5 µM PP1 inhibitor tautomycetin (PP1-i) for 30 min prior to the start of imaging, or (C) siCDC20 were imaged for 12 h at 2 min intervals. Chromosome congression was monitored using SiR-Hoechst, and checkpoint silencing was inferred from the loss of GFP-MAD2 from the kinetochore. Degradation of endogenously tagged CCNB1 indicated APC/C activation. Representative time course images are shown. (D) CCNB1 levels were measured as a function of time from the point at which the last MAD2-positive kinetochore (MAD2KT) was observed for siControl, PP1-i, and siCDC20 cells. CCNB1 levels were set to 100% at that point and plotted for single cells in the graph. (E) Scatter plots of the mean CCNB1 signal ± SD remaining at 50 min after loss of MAD2KT for siControl (n = 10), PP-i (n = 5), and siCDC20 (n = 8). *** denotes p < 0.001.
FIGURE 5:
FIGURE 5:
PP1α/γ are required for rapid cyclin B destruction downstream of the spindle checkpoint. (A–C) HeLa CCNB1-mCherry GFP-Mad2 cells treated with (A) control, (B) siPP1α/γ, or (C) siPP2A-B55 for 60 h were imaged for 12 h at 2 min intervals. DNA was visualized with SiR-DNA. (D) Quantitation of the CCNB1 levels of individual cells shown in A. (E) The CCNB1 signal remaining at 50 min in siControl, siPP1α/γ, or siPP2A-B55 was plotted as mean ± SD (siControl n = 10, siPP1α/γ n = 8, siPP2A-B55 n = 9). *** denotes p < 0.001; **** denotes p < 0.0001.
FIGURE 6:
FIGURE 6:
In the absence of PP1α/γ, cyclin B destruction is delayed when the spindle checkpoint is inactivated by MPS1 inhibition. (A) HeLa CCNB1-mCherry GFP-MAD2 cells treated with control or siPP1α/γ were imaged progressing through mitosis and treated with MPS1 inhibitor AZ3146 (MPS1-i) when they approached metaphase. Loss of GFP-MAD2 and kinetics of CCNB1-mCherry degradation were monitored. (B) CCNB1-mCherry levels in single cells are plotted for siControl and siPP1α/γ cells undergoing mitotic exit. The time of MPS1-i addition (t = 0) is marked with a dashed line. (C) The percentage of cyclin B1-mCherry remaining at 30 min after MPS1-i addition in siControl (n = 19) and siPP1α/γ (n = 24) cells was plotted as mean ± SD in the line graph. A p value was calculated with an unpaired t test with Welch’s correction. **** denotes p < 0.0001.
FIGURE 7:
FIGURE 7:
PP1 dephosphorylates the N-terminal region of CDC20. (A) Schematic representation of CDC20 structure. Six N-terminal CDK1 sites are indicated as filled circles, and the pT70 site is marked in red in an open circle. (B) Synchronous progression of mitotic HeLa cells pretreated with DMSO or PP1 inhibitor into anaphase was triggered with MPS1 inhibitor and samples were collected every 10 min. Cell cycle progression was monitored by cyclin B1 Western blot, CDC20 phosphorylation state by PhosTag gel, and PP1 activation status by Western blot for PP1-pT320. Actin was used as a loading control. The mean level ± SD of phospho-CDC20 (top band in the PhosTag blot) relative to total CDC20 is plotted in the line graph as a function of time (n = 3). (C) Synchronous progression of control-depleted or PP1α/γ-depleted mitotic HeLa cells into anaphase was triggered with MPS1 inhibitor. The mean ± SD of phospho-CDC20 (top band in the PhosTag blot) relative to total CDC20 is plotted in the line graph (n = 3). (D) CDC20 was immunoprecipitated from synchronized cells treated with MPS1 inhibitor as in B, and samples were taken every 10 min. The immunoprecipitates were blotted for pT70-modified CDC20 and the total amount of CDC20. The mean level ± SD of pT70 relative to total CDC20 is plotted in the line graph (n = 2). (E) Synchronous progression of mitotic HeLa cells pretreated with DMSO or PP1 inhibitor into anaphase was triggered with CDK1 inhibitor, and samples were collected every 7.5 min. CDC20 was immunoprecipitated and the immunoprecipitates blotted for pT70. CDC20 pT70 levels relative to total CDC20 are plotted in the bar graphs as mean ± SD (n = 2).
FIGURE 8:
FIGURE 8:
CDK1 phosphorylation site mutant CDC206A bypasses the requirement for PP1 in rapid cyclin B destruction on mitotic exit. (A) HeLa Flp-In TRex cells expressing CCNB1-mCherry were depleted with siControl and siCDC20 and then induced to express either GFP-CDC20WT or GFP-CDC206A. Cell cycle progression and CCNB1-mCherry levels were followed by live cell imaging. DNA was visualized with SiR-DNA. (B) CCNB1 levels for individual cells are plotted in the line graph. Gray lines show CCNB1 levels in cells depleted with siCDC20 but without induction of the GFP-CDC20 transgene. (C) HeLa Flp-In TRex cells expressing CCNB1-mCherry were codepleted of siPP1α/γ and siCDC20 and then induced to express either GFP-CDC20WT or GFP-CDC206A. Cell cycle progression and CCNB1-mCherry levels were then followed by live cell imaging. DNA was visualized with SiR-DNA. (D) CCNB1 levels for individual cells are plotted in the line graph. (E) Scatter plots showing the mean time ± SD at which cells entered anaphase or the end of the movie was reached for siCDC20 uninduced (n = 12, gray), siControl with GFP-CDC20WT (n = 20, green) or GFP-CDC206A (n = 15, orange), and siPP1α/γ with GFP-CDC20WT (n = 41, green) or GFP-CDC206A (n = 33, orange). (F) Western blot of cells depleted of endogenous CDC20 and expressing GFP-CDC20 as in A, arrested with 330 nM nocodazole for 14 h. **** denotes p < 0.0001. (G) Cells depleted for endogenous CDC20 (siCDC20) and induced for GFP-CDC20WT (WT) or CDC206A (6A) were treated with nocodazole at the indicated concentrations for 14 h, and the mitotic index was plotted.
FIGURE 9:
FIGURE 9:
PP2A-B56, PP1, and PP2A-B55 dephosphorylate CDC20 at different points in the cell cycle. Schematic drawing illustrating the dephosphorylation of CDC20 by the three main mitotic phosphatases PP2A-B56, PP1α/γ, and PP2A-B55 in early mitosis, at the metaphase-to-anaphase transition and in anaphase, respectively. In this schematic, PP2A-B56 refers to the pool docked to the checkpoint protein BUBR1. Other pools of PP2A-B56 are active in anaphase.

References

    1. Abrieu A, Magnaghi-Jaulin L, Kahana JA, Peter M, Castro A, Vigneron S, Lorca T, Cleveland DW, Labbe JC (2001). Mps1 is a kinetochore-associated kinase essential for the vertebrate mitotic checkpoint. Cell , 83–93. - PubMed
    1. Alfieri C, Zhang S, Barford D (2017). Visualizing the complex functions and mechanisms of the anaphase promoting complex/cyclosome (APC/C). Open Biol , 170204. - PMC - PubMed
    1. Alfonso-Perez T, Hayward D, Holder J, Gruneberg U, Barr FA (2019). MAD1-dependent recruitment of CDK1-CCNB1 to kinetochores promotes spindle checkpoint signaling. J Cell Biol , 1108–1117. - PMC - PubMed
    1. Choy MS, Swingle M, D’Arcy B, Abney K, Rusin SF, Kettenbach AN, Page R, Honkanen RE, Peti W (2017). PP1:tautomycetin complex reveals a path toward the development of PP1-specific inhibitors. J Am Chem Soc , 17703–17706. - PMC - PubMed
    1. Clute P, Pines J (1999). Temporal and spatial control of cyclin B1 destruction in metaphase. Nat Cell Biol , 82–87. - PubMed

Publication types

LinkOut - more resources