. 2020 Dec 1:746:141347.
doi: 10.1016/j.scitotenv.2020.141347. Epub 2020 Jul 28.

Impacts of geographic factors and population density on the COVID-19 spreading under the lockdown policies of China

Affiliations

Impacts of geographic factors and population density on the COVID-19 spreading under the lockdown policies of China

Zhibin Sun et al. Sci Total Environ. .

Abstract

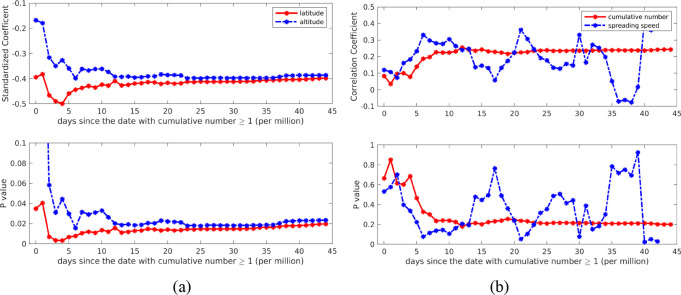
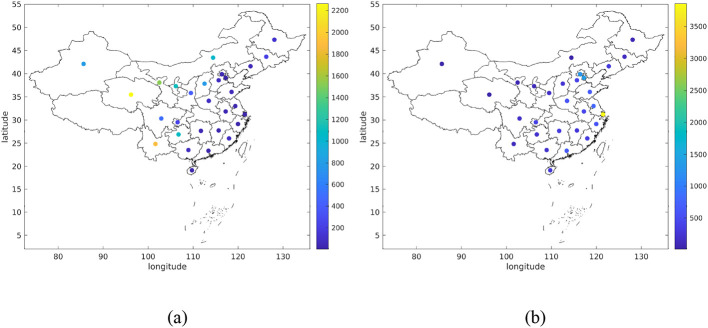
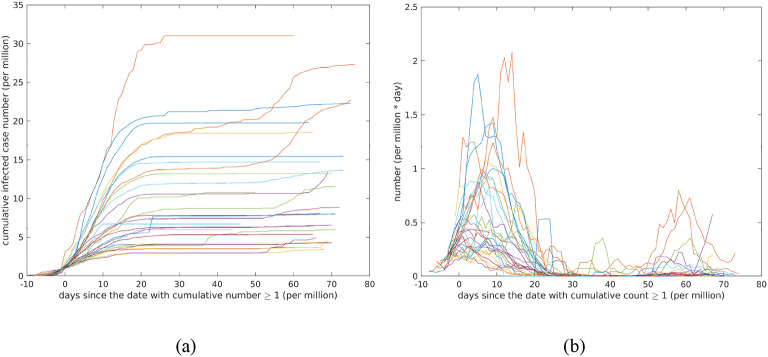
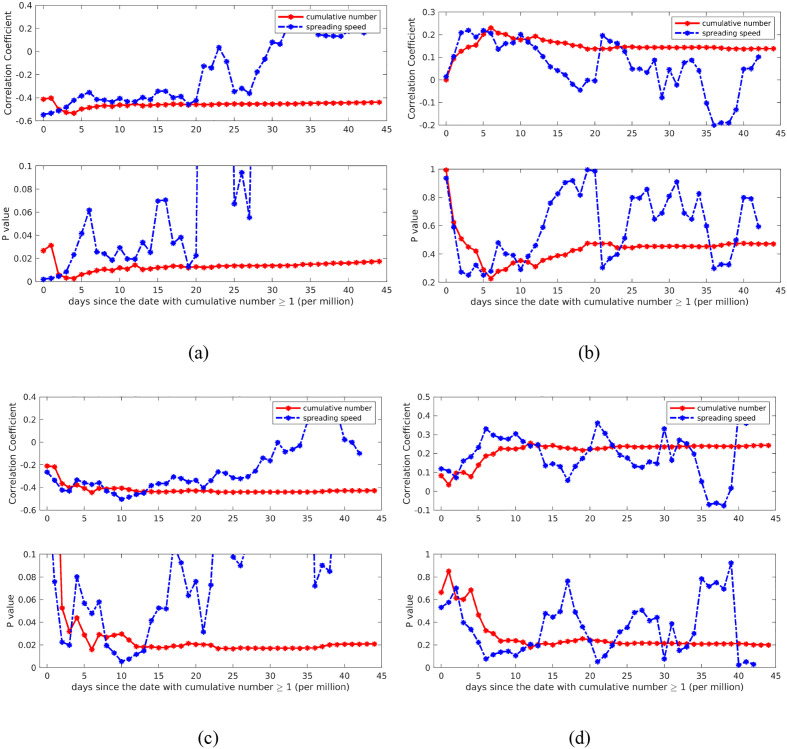
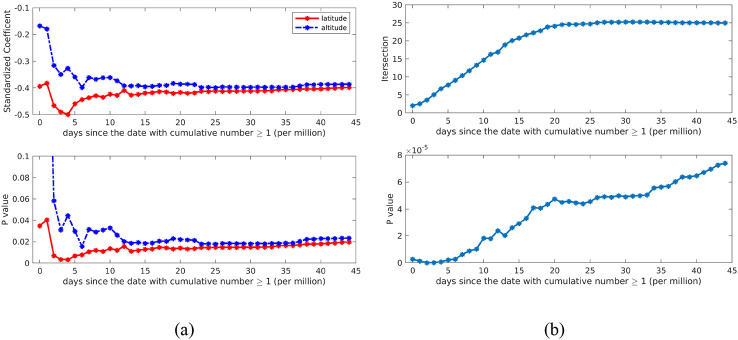
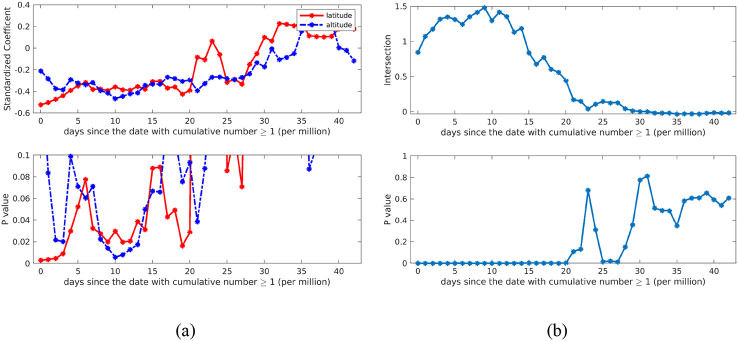
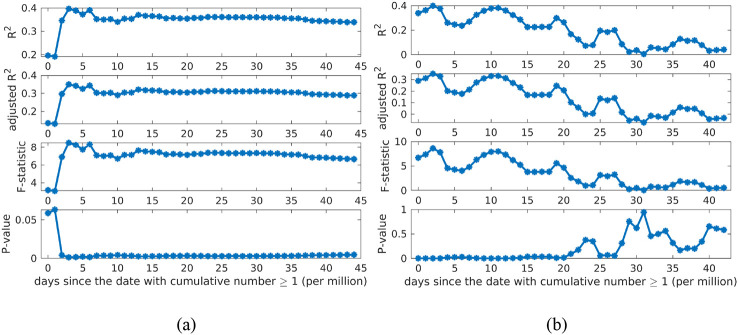
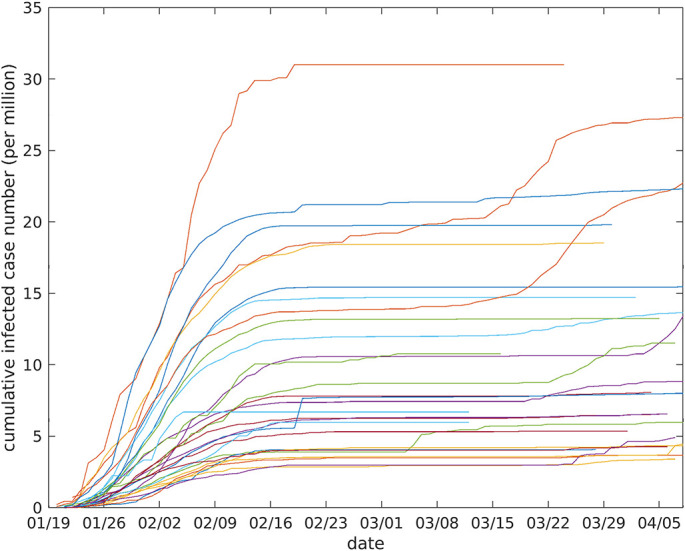
The outbreak of COVID-19 pandemic has a high spreading rate and a high fatality rate. To control the rapid spreading of COVID-19 virus, Chinese government ordered lockdown policies since late January 2020. The aims of this study are to quantify the relationship between geographic information (i.e., latitude, longitude and altitude) and cumulative infected population, and to unveil the importance of the population density in the spreading speed during the lockdown. COVID-19 data during the period from December 8, 2019 to April 8, 2020 were collected before and after lockdown. After discovering two important geographic factors (i.e., latitude and altitude) by estimating the correlation coefficients between each of them and cumulative infected population, two linear models of cumulative infected population and COVID-19 spreading speed were constructed based on these two factors. Overall, our findings from the models showed a negative correlation between the provincial daily cumulative COVID-19 infected number and latitude/altitude. In addition, population density is not an important factor in COVID-19 spreading under strict lockdown policies. Our study suggests that lockdown policies of China can effectively restrict COVID-19 spreading speed.

Keywords: COVID-19; China; Lockdown; Spreading speed.


Conflict of interest statement

Declaration of competing interest The authors declare that they have no known competing financial interests or personal relationships that could have appeared to influence the work reported in this paper.

Figures

Unlabelled Image
Graphical abstract
Fig. 1
Fig. 1
Geographic locations of total qualified 29 provincial regions in China mainland used in this study. Colored dots are the locations of provincial capitals, and color represents (a) the altitude of provincial capital (unit: meter) and (b) the population density of province (unit: count/km2). Note: Hubei and Xizang provinces are excluded from this study. (For interpretation of the references to colour in this figure legend, the reader is referred to the web version of this article.)
Fig. 2
Fig. 2
(a) Day-shifted CNIC (unit: count per million) and (b) Day-shifted ISS (unit: count per million*day). For each provincial region, day zero is set as the first day with the CNIC ≥1 count per million. CNIC: cumulative numbers of infected cases. ISS: infective spreading speed.
Fig. 3
Fig. 3
(a) The daily correlation coefficients and corresponding P values (only showing P values <0.1) between latitude and CNIC (or ISS). (b) The daily correlation coefficients and corresponding P values between longitude and CNIC (or ISS). (c) The daily correlation coefficients and corresponding P values (only showing P values <0.1) between altitude and CNIC (or ISS). (d) The daily correlation coefficients and corresponding P values between population density and CNIC (or ISS). CNIC: cumulative numbers of infected cases. ISS: infective spreading speed.
Fig. 4
Fig. 4
The daily linear regression results for Model (1) of CNIC. (a) standardized coefficients of estimated daily aCNIC and bCNIC, as well as their corresponding P values (only showing P values <0.1). (b) estimated daily cCNIC and its corresponding P values. CNIC: cumulative numbers of infected cases.
Fig. 5
Fig. 5
The daily linear regression results for Model (2) of ISS. (a) standardized coefficients of estimated daily aISS and bISS, as well as their corresponding P values (only showing P values <0.1). (b) estimated daily cISS and its corresponding P values. ISS: infective spreading speed.
Fig. 6
Fig. 6
(a) Four statistics of daily linear regression model (Eq. (1)) of CNIC. (b) Four statistics of daily linear regression model (Eq. (2)) of ISS. CNIC: cumulative numbers of infected cases. ISS: infective spreading speed. R2: coefficient of determination. Adjusted R2: adjusted coefficient of determination. F-statistic: test statistic for the F-test on the regression model. P-value: P-value for the F-test on the model.
Fig. A1
Fig. A1
The provincial CNIC (unit: count per million) from January 19 to April 8, 2020. Each colored curve represents the CNIC time series of one province/region/municipality, and its color is only for better visual effect. CNIC: cumulative numbers of infected cases.

References

    1. Barcelo D. An environmental and health perspective for COVID-19 outbreak: meteorology and air quality influence, sewage epidemiology indicator, hospitals disinfection, drug therapies and recommendations. J. Environ. Chem. Eng. 2020;8(4):104006. doi: 10.1016/j.jece.2020.104006. - DOI - PMC - PubMed
    1. Bashir M.F., Ma B., Komal B., Bashir M.A., Tan D., Bashir M. Correlation between climate indicators and COVID-19 pandemic in New York, USA. Sci. Total Environ. 2020:138835. - PMC - PubMed
    1. Bisoyi Sagar. 2020. COVID-19 can be Tracked of the Basis of Latitude & Temperature. - DOI
    1. Byass P. Eco-epidemiological assessment of the COVID-19 epidemic in China, January–February 2020[J] Glob. Health Action. 2020;13(1):1760490. doi: 10.1080/16549716.2020.1760490. - DOI - PMC - PubMed
    1. Coccia M. Factors determining the diffusion of COVID-19 and suggested strategy to prevent future accelerated viral infectivity similar to COVID. Sci. Total Environ. 2020:138474. doi: 10.1016/j.scitotenv.2020.138474. - DOI - PMC - PubMed

LinkOut - more resources