. 2020 Aug 21;23(8):101391.
doi: 10.1016/j.isci.2020.101391. Epub 2020 Jul 20.

Heme Synthesis Inhibition Blocks Angiogenesis via Mitochondrial Dysfunction

Affiliations

Heme Synthesis Inhibition Blocks Angiogenesis via Mitochondrial Dysfunction

Trupti Shetty et al. iScience. .

Abstract

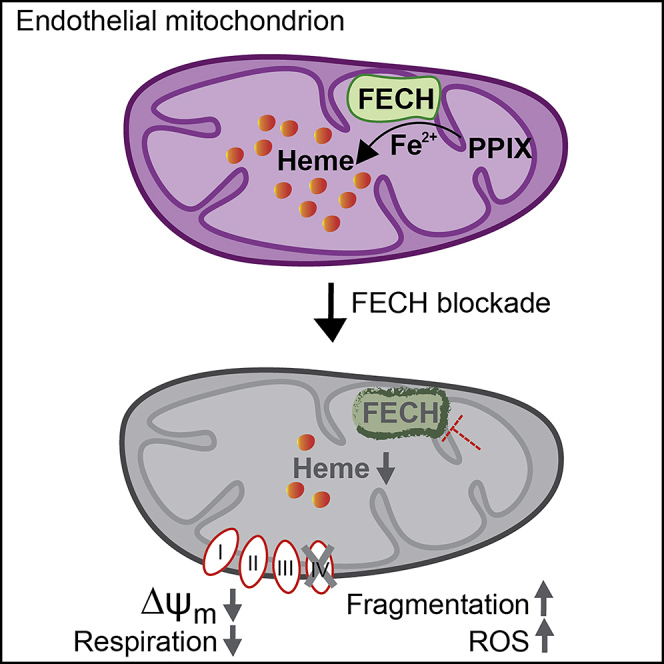
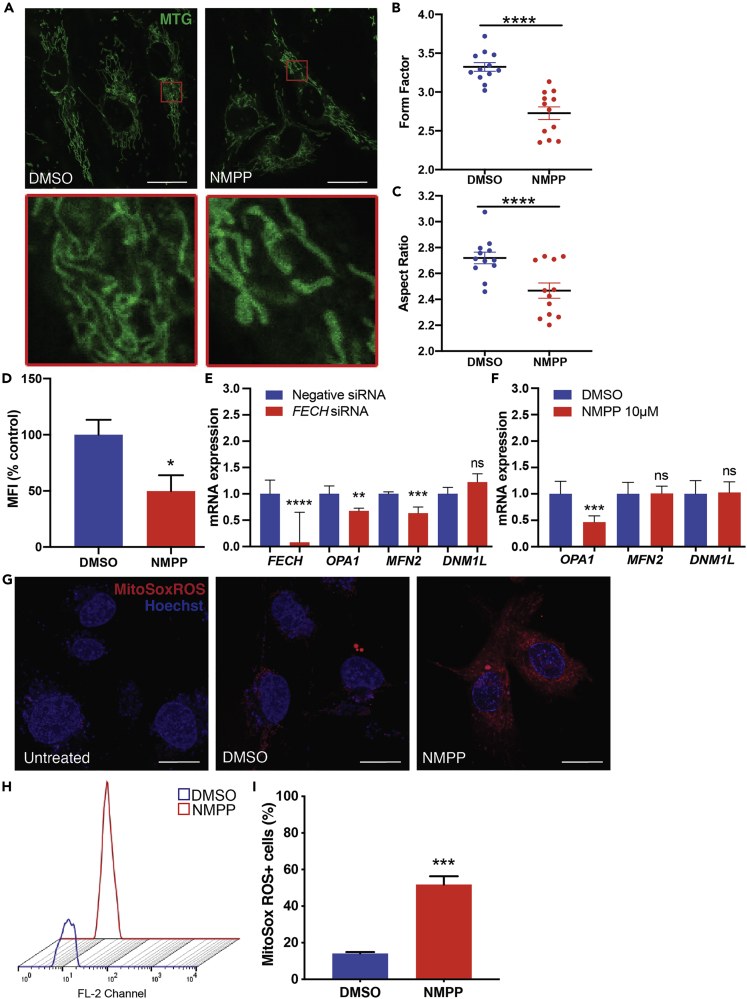
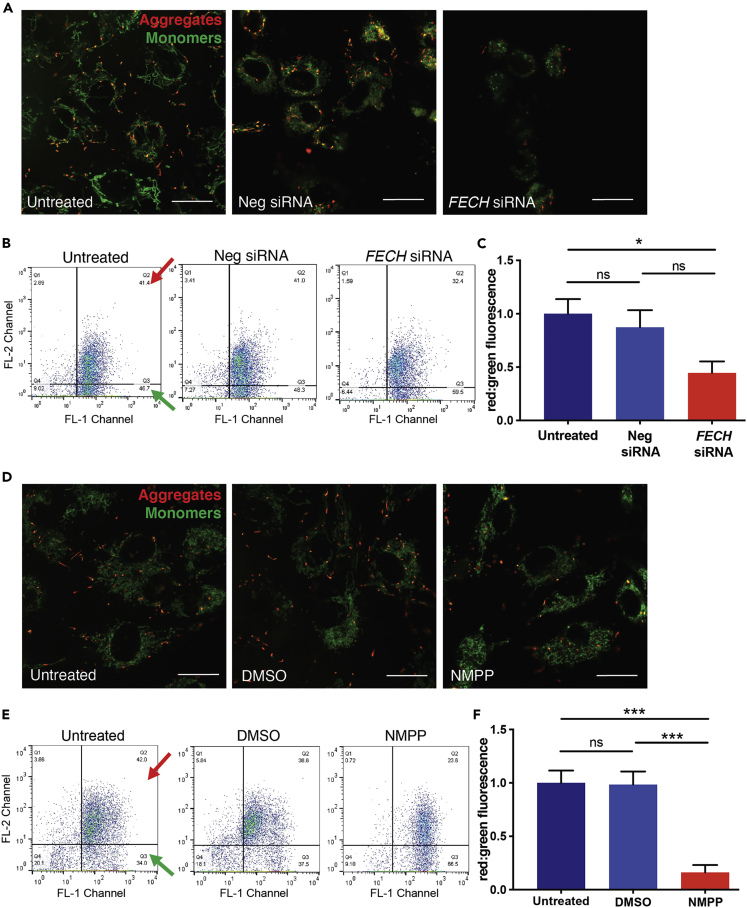
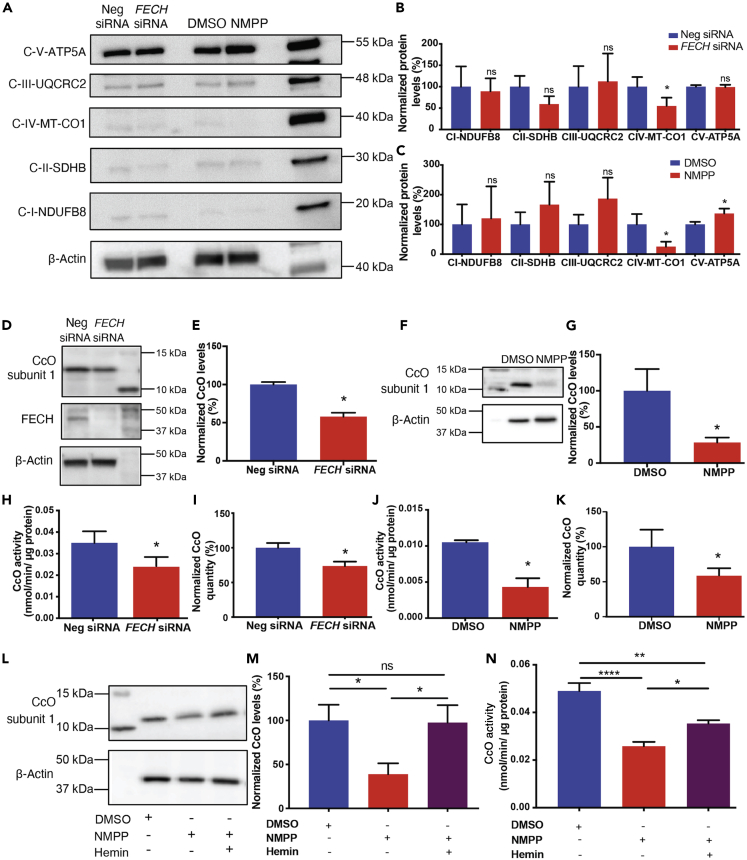
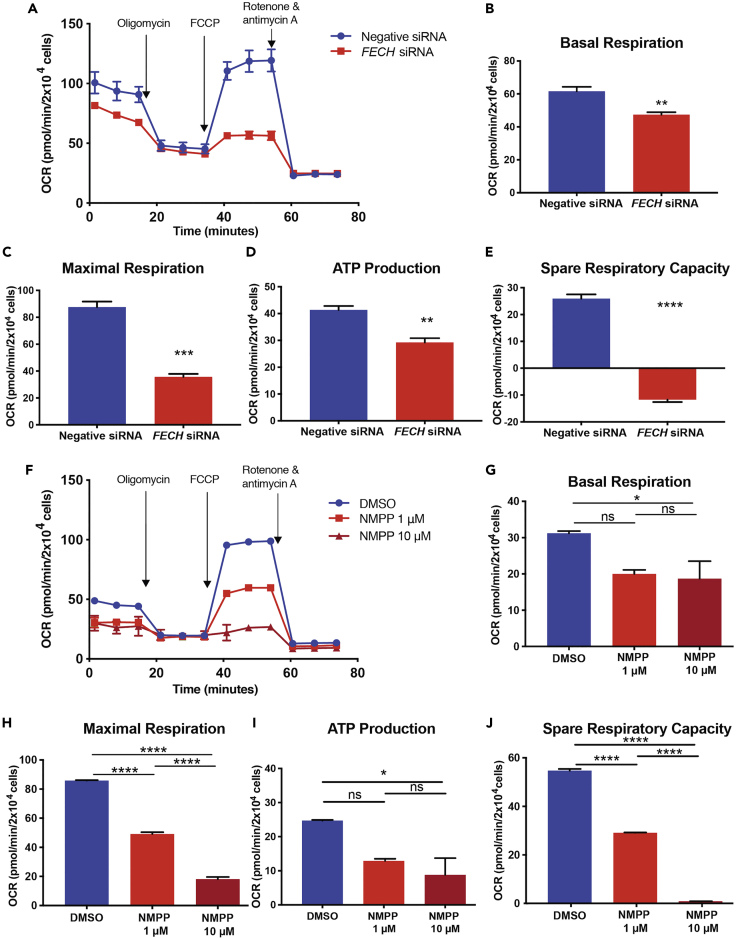
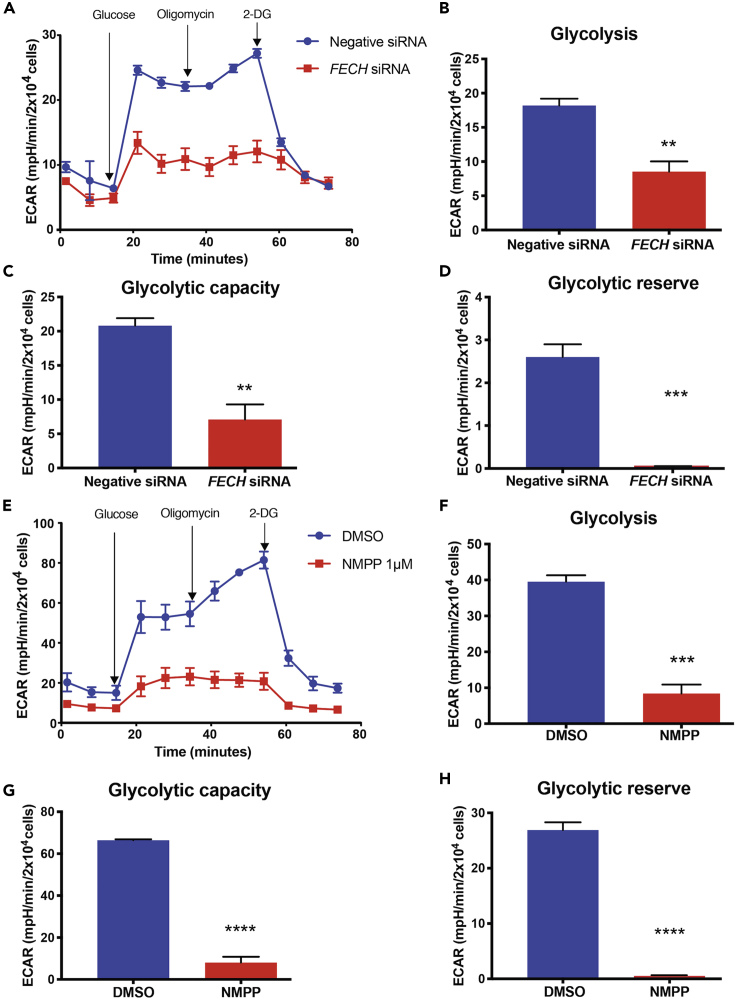
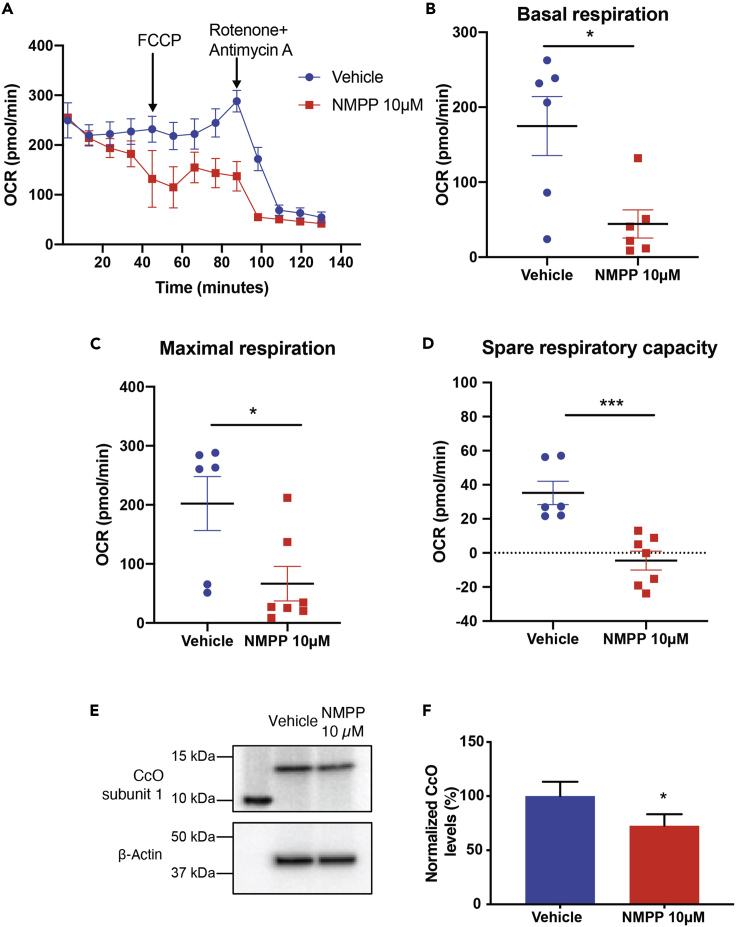
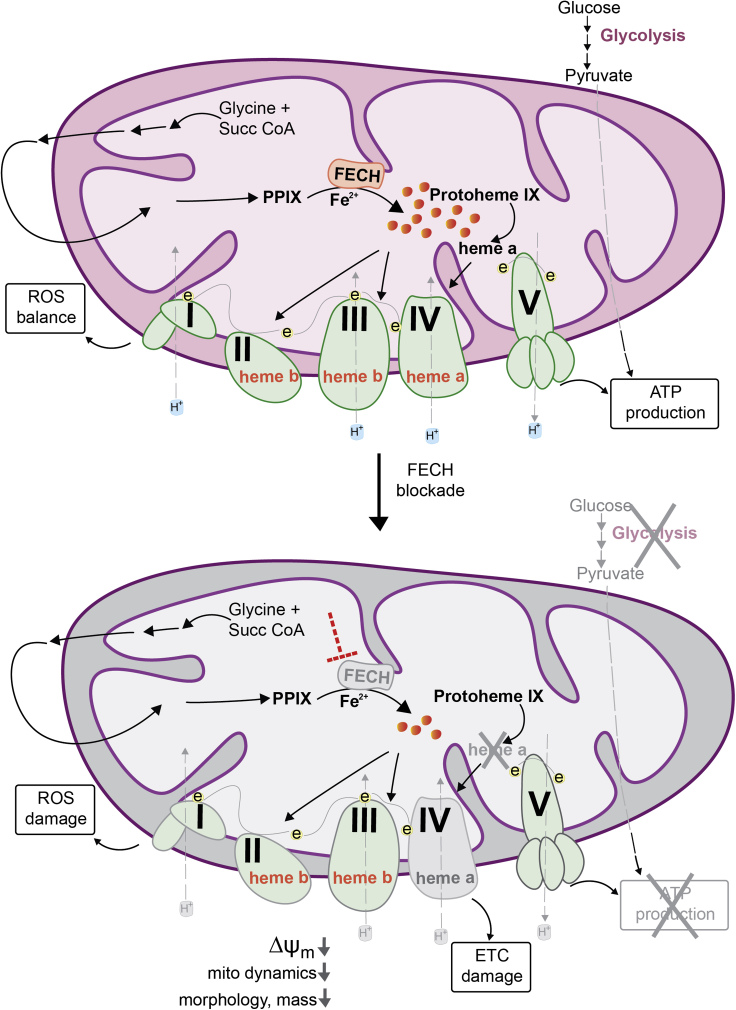
The relationship between heme metabolism and angiogenesis is poorly understood. The final synthesis of heme occurs in mitochondria, where ferrochelatase (FECH) inserts Fe2+ into protoporphyrin IX to produce proto-heme IX. We previously showed that FECH inhibition is antiangiogenic in human retinal microvascular endothelial cells (HRECs) and in animal models of ocular neovascularization. In the present study, we sought to understand the mechanism of how FECH and thus heme is involved in endothelial cell function. Mitochondria in endothelial cells had several defects in function after heme inhibition. FECH loss changed the shape and mass of mitochondria and led to significant oxidative stress. Oxidative phosphorylation and mitochondrial Complex IV were decreased in HRECs and in murine retina ex vivo after heme depletion. Supplementation with heme partially rescued phenotypes of FECH blockade. These findings provide an unexpected link between mitochondrial heme metabolism and angiogenesis.

Keywords: Cell Biology; Developmental Genetics; Physiology.


Conflict of interest statement

Declaration of Interests T.W.C. is a named inventor on patent applications related to this work. The other authors declare no competing interests.

Figures

None
Graphical abstract
Figure 1
Figure 1
FECH Blockade Altered Mitochondrial Morphology and Increased Oxidative Stress (A–C) (A) HRECs treated with DMSO or FECH inhibitor NMPP stained with MitoTracker green (MTG). Inset images indicate magnified region marked in red boxes. Form factor (B) and aspect ratio (C) as quantified using ImageJ. Individual data points indicate mean of mitochondria analyzed from each of 12 individual cells per treatment group. (D–F) (D) Quantification of MTG fluorescence using flow cytometry and calculated median fluorescence intensity (MFI). qPCR analysis of mRNA expression under FECH knockdown (E) or NMPP treatment (F). (G) HRECs stained with mitoSox ROS in red and Hoechst staining in blue. (H and I) (H) Representative fluorescence peaks as measured by flow cytometry followed by (I) quantification of cells positive for red fluorescence. Bar graphs indicate mean ± SEM, n = 3. Representative results from three independent experiments. ns, non-significant, ∗p < 0.05, ∗∗p < 0.01, ∗∗∗p < 0.001, ∗∗∗∗p < 0.0001, two-tailed unpaired Student's t test. Scale bars, 20 μm. See also Figures S1 and S4.
Figure 2
Figure 2
Loss of FECH Reduced Mitochondrial Membrane Potential in HRECs (A–F) HRECs stained with JC-1 dye showing green monomers and red aggregates under FECH knockdown condition (A) and NMPP treatment (D). Representative dot plots of FL1 versus FL2 channel from three individual experiments, measuring red and green fluorescence using flow cytometry after FECH knockdown (B) and NMPP treatment (E). Red and green arrows indicate quadrants expressing FL1-red and FL2-green fluorescent cells. (C and F) Quantification of red:green fluorescence from flow experiment. Bar graphs indicate mean ± SEM, n = 3; ns, non-significant, ∗p < 0.05, ∗∗∗p < 0.001, one-way ANOVA with Tukey's post hoc tests. Scale bars, 20 μm. See also Figure S4.
Figure 3
Figure 3
FECH Inhibition Caused Reduced CcO Expression, Rescued by Hemin (A) HRECs under FECH siRNA or NMPP-treated conditions were immunoblotted for Complexes I–V as indicated. (B and C) Quantification of the blots was graphed as shown relative to appropriate control. (D) FECH siRNA-treated HRECs were probed for CcO nuclear encoded subunit 1 (COX4I1) and FECH along with housekeeping control and (E) quantified. Similarly, HRECs treated with NMPP were blotted for CcO subunit 1 (F) with (G) quantification as shown. CcO enzyme activity was measured under FECH knockdown condition (H) and NMPP treatment (J) and total CcO levels were quantified by ELISA for both the conditions (I and K). (L and M) CcO protein expression and quantification under defined conditions. (N) CcO enzyme activity was partially rescued in NMPP-treated cells exposed to hemin. Immunoblot images representative from three independent experiments. Bar graphs indicate mean ± SEM, n = 3–4; ns, non-significant, ∗p < 0.05, ∗∗p < 0.01, ∗∗∗∗p < 0.0001. (B, C, E, G, H–K) unpaired Student's t test (M and N) one-way ANOVA with Tukey's post hoc tests. See also Figures S5–S7.
Figure 4
Figure 4
Loss of FECH Reduced Mitochondrial Respiration (A and F) OCR kinetic traces for HRECs under FECH knockdown or NMPP chemical inhibition. (B and G) Basal respiration. (C and H) Maximal respiration. (D and I) OCR-linked ATP production, and (E and J) spare respiratory capacity were calculated based on OCR curves for the respective treatment group. (A and F) Representative OCR curve of three individual experiments. Bar graphs indicate mean ± SEM, n = 3; ∗p < 0.05, ∗∗p < 0.01, ∗∗∗p < 0.001, ∗∗∗∗p < 0.0001 (B, C, D, and E) unpaired Student's t test (G, H, I, and J) one-way ANOVA with Tukey's post hoc tests. See also Figures S6 and S7.
Figure 5
Figure 5
FECH Inhibition Caused a Decrease in Glycolytic Function (A–H) (A and E) ECAR kinetic traces for HRECs under FECH knockdown or NMPP chemical inhibition. (B and F) Glycolysis, (C and G) glycolytic capacity, and (D and H) glycolytic reserve were calculated based on ECAR curves for the respective treatment group. (A and E) Representative ECAR curve of three individual experiments. Bar graphs indicate mean ± SEM, n = 3; ∗∗p < 0.01, ∗∗∗p < 0.001, ∗∗∗∗p < 0.0001, unpaired Student's t test. 2-DG, 2-deoxyglucose.
Figure 6
Figure 6
FECH Inhibition In Vivo Decreased Mitochondrial Respiration in Retina (A) Representative OCR kinetic traces for retina from animals treated with NMPP. (B–D) (B) Basal respiration, (C) maximal respiration, and (D) spare respiratory capacity were calculated based on OCR curves for the respective treatment groups. (E) Immunoblot showing CcO nuclear encoded subunit 1 (COX4I1) protein expression from three pooled retinal tissue lysates from NMPP treated eyes and (F) quantification of immunoblots. Graphs indicate mean ± SEM for two tissue punches from each retina per treatment group, n = 6–7 per treatment condition. ∗p < 0.05, ∗∗∗p < 0.001, unpaired Student's t test.
Figure 7
Figure 7
Schematic Model of Mitochondrial Dysfunction on Heme Loss Heme synthesis begins with the condensation of glycine and succinyl CoA in the mitochondrial matrix. The final step is the insertion of ferrous ion into protoporphyrin IX (PPIX), catalyzed by ferrochelatase (FECH) to produce protoheme (also known as heme b). Protoheme and its derivatives are available for different cellular enzymes, including complexes of the ETC (e, electrons). Heme a is synthesized by sub-hemylation steps and utilized by CcO (Complex IV) for composition of the holoenzyme. Heme synthesis blockade by inhibiting the terminal synthesis enzyme FECH leads to CcO defects and disrupts cellular energetics. Mitochondrial dynamics is altered with reduced fusion and mass, depolarized membrane potential (ΔΨm) and elevated reactive oxygen species (ROS).

References

    1. Acin-Perez R., Fernandez-Silva P., Peleato M.L., Perez-Martos A., Enriquez J.A. Respiratory active mitochondrial supercomplexes. Mol. Cell. 2008;32:529–539. - PubMed
    1. Atamna H., Liu J., Ames B.N. Heme deficiency selectively interrupts assembly of mitochondrial complex IV in human fibroblasts: revelance to aging. J. Biol. Chem. 2001;276:48410–48416. - PubMed
    1. Barot M., Gokulgandhi M.R., Mitra A.K. Mitochondrial dysfunction in retinal diseases. Curr. Eye Res. 2011;36:1069–1077. - PMC - PubMed
    1. Basavarajappa H.D., Sulaiman R.S., Qi X., Shetty T., Sheik Pran Babu S., Sishtla K.L., Lee B., Quigley J., Alkhairy S., Briggs C.M. Ferrochelatase is a therapeutic target for ocular neovascularization. EMBO Mol. Med. 2017;9:786–801. - PMC - PubMed
    1. De Bock K., Georgiadou M., Schoors S., Kuchnio A., Wong B.W., Cantelmo A.R., Quaegebeur A., Ghesquiere B., Cauwenberghs S., Eelen G. Role of PFKFB3-driven glycolysis in vessel sprouting. Cell. 2013;154:651–663. - PubMed

LinkOut - more resources