

Real dynamic assessment of tear film optical quality for monitoring and early prevention of dry eye
- PMID: 32756182
- PMCID: PMC7402908
- DOI: 10.1097/MD.0000000000021494
Real dynamic assessment of tear film optical quality for monitoring and early prevention of dry eye
Abstract
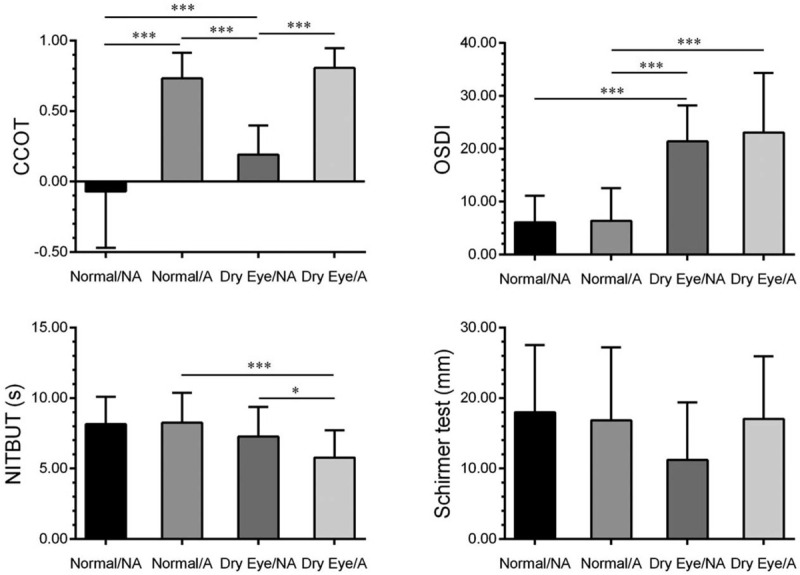
To evaluate real dynamic assessment of tear film optical quality for monitoring and prevention of dry eye.Right eyes of 62 normal and 39 dry eye subjects were included. Dynamic measurement of objective scatter index (OSI) was performed by using the Optical Quality Analysis System II (OQAS II), correlation coefficient between OSI and time (CCOT) was calculated. According to whether the CCOT was significantly ascending, normal and dry eye groups were further subdivided for comparison. By using Scheimpflug-Placido topographer, non-invasive tear break-up time (NITBUT) was recorded, and a 2-dimensional precorneal tear film map was reconstructed and divided into central, middle, and peripheral corneal zones, distribution of tear break-up spots in the 3 corneal zones were analyzed.The numbers of tear break-up spots were higher in all the 3 corneal zones of the dry eye subjects (P < .01), when compared with the normal subjects. The Dry Eye subjects with ascending CCOT had the shortest NITBUT (P < .001-.034) and the most tear break-up spots over the whole cornea (P < .001-.044). Between the dry eye subjects with non-ascending CCOT and those with ascending CCOT, difference of tear break-up spots was found significant only in the peripheral corneal zone (P < .01).Non-ascending and ascending CCOT of dry eye patients reflect different stability of tear film. Real dynamic assessment of tear film optical quality is potential for monitoring and early prevention of dry eye.
Conflict of interest statement
The authors have no conflicts of interest to disclose.
Figures


References
-
- Katsanevaki VJ, Tuft SJ. Refractive surgery: what patients need to know. Br Med Bull 2007;83:325–39. - PubMed
-
- Goto E, Yagi Y, Matsumoto Y, et al. Impaired functional visual acuity of dry eye patients. Am J Ophthalmol 2002;133:181–6. - PubMed
-
- Montes-Mico R, Alio JL, Munoz G, et al. Temporal changes in optical quality of air-tear film interface at anterior cornea after blink. Invest Ophthalmol Vis Sci 2004;45:1752–7. - PubMed
-
- Montes-Mico R, Alio JL, Munoz G, et al. Postblink changes in total and corneal ocular aberrations. Ophthalmology 2004;111:758–67. - PubMed
Publication types
MeSH terms
LinkOut - more resources
Full Text Sources
Medical
