. 2020 Aug 3;17(15):5596.
doi: 10.3390/ijerph17155596.

COVID-WAREHOUSE: A Data Warehouse of Italian COVID-19, Pollution, and Climate Data

Affiliations

COVID-WAREHOUSE: A Data Warehouse of Italian COVID-19, Pollution, and Climate Data

Giuseppe Agapito et al. Int J Environ Res Public Health. .

Abstract

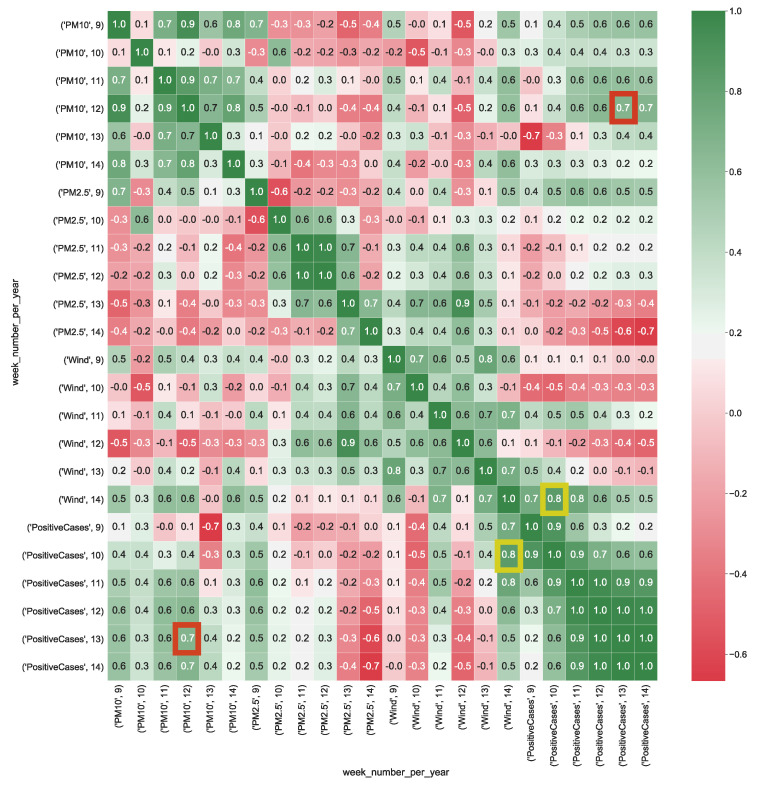
The management of the COVID-19 pandemic presents several unprecedented challenges in different fields, from medicine to biology, from public health to social science, that may benefit from computing methods able to integrate the increasing available COVID-19 and related data (e.g., pollution, demographics, climate, etc.). With the aim to face the COVID-19 data collection, harmonization and integration problems, we present the design and development of COVID-WAREHOUSE, a data warehouse that models, integrates and stores the COVID-19 data made available daily by the Italian Protezione Civile Department and several pollution and climate data made available by the Italian Regions. After an automatic ETL (Extraction, Transformation and Loading) step, COVID-19 cases, pollution measures and climate data, are integrated and organized using the Dimensional Fact Model, using two main dimensions: time and geographical location. COVID-WAREHOUSE supports OLAP (On-Line Analytical Processing) analysis, provides a heatmap visualizer, and allows easy extraction of selected data for further analysis. The proposed tool can be used in the context of Public Health to underline how the pandemic is spreading, with respect to time and geographical location, and to correlate the pandemic to pollution and climate data in a specific region. Moreover, public decision-makers could use the tool to discover combinations of pollution and climate conditions correlated to an increase of the pandemic, and thus, they could act in a consequent manner. Case studies based on data cubes built on data from Lombardia and Puglia regions are discussed. Our preliminary findings indicate that COVID-19 pandemic is significantly spread in regions characterized by high concentration of particulate in the air and the absence of rain and wind, as even stated in other works available in literature.

Keywords: Italian COVID-19 data; climate data; data analysis; data integration; data warehouse; pollution data.


Conflict of interest statement

The authors declare no conflict of interest.

Figures

Figure 1
Figure 1
Weather data collection pipeline. A list of dates and Province names are extracted from the epidemiological data previously described. Then, the extracted province names are combined with all dates to reconstruct the URL of each page that contains relative information in the meteorological website. Data is extracted through data scraping, then raw data is normalized (e.g., by fixing inconsistency, providing uniformity of unit measurement for each date and province) and cleaned (e.g duplicate instances and redundant information removal, one-hot encoding of meteorological phenomena). Finally data is stored in a CSV file format.
Figure 2
Figure 2
The COVID-WAREHOUSE architecture, implemented as 5 independent and cooperating levels.
Figure 3
Figure 3
The main modules of COVID-WAREHOUSE analysis pipeline. Data Collection allows to store the downloaded raw data locally. Data Cleaning provides ETL methods based on RE, enabling the cleaning, replacing and deletion of special characters present into the raw data, that can compromise the next steps and analysis. Data Merging uses cleaned data to produce the Reconciled Table. Data Aggregation yields a condensed version of the DW called Data Mart obtained from the Reconciled Table, from which to obtain the multidimensional cubes. Data Analysis and Visualization allows to perform statistical analysis and Heatmap visualization on the predefined cubes.
Figure 4
Figure 4
Heatmap represents the correlation between aggregated COVID-19 data with air pollution and wind data (km/h) detected in the Lombardia region. The heatmap’s labels refer to the attribute’s measured value in a specific week of the year. For instance, ’PM10’, 9 refers to the level of PM10 (μg/m3) in the air measured in the 9-th week of the year. In Figure, the yellow squares highlight the strong correlation between positive cases and the presence of wind, whereas red squares show the strong correlation between air particulate and the number of positive cases.
Figure 5
Figure 5
Heatmap representation of the correlation between COVID-19 data aggregate with the air pollution and rain data (boolean variable) detected in the Lombardia region. The heatmap’s labels refer to the attribute’s measured value in a specific week of the year. For instance, ’PM10’, 9 refers to the level of PM10 (μg/m3) in the air measured in the 9-th week of the year. In Figure, the yellow squares highlight the strong negative correlation between positive cases and the presence of rain, whereas red squares show both strong positive correlation between the PM10 air particulate and the number of positive cases. Green squares show strong negative correlation between the PM2.5 air particulate and the number of positive cases.
Figure 6
Figure 6
Heatmap representation of the correlation between COVID-19 data aggregate with the air pollution and wind data (km/h) measured in the Puglia region. The heatmap’s labels refer to the attribute’s measured value in a specific week of the year. For instance, ’PM10’, 9 refers to the level of PM10 (μg/m3) in the air measured in the 9-th week of the year. In Figure the yellow squares highlight the strong correlation between positive cases and the presence of wind, whereas red squares show the strong correlation between air particulate and the number of positive cases.
Figure 7
Figure 7
Heatmap representation of correlation between COVID-19 data aggregate with the air pollution and rain data (boolean variable) detected in the Puglia region. The heatmap’s labels refer to the attribute’s measured value in a specific week of the year. For instance, ’PM10’, 9 refers to the level of PM10 (μg/m3) in the air measured in the 9-th week of the year. In Figure, the yellow squares highlight the strong positive correlation between positive cases and the presence of air particulate PM10, whereas red squares show the strong negative correlation between rain and the number of positive cases. Green squares show strong negative correlation between rain and PM10 particulate.
Figure 8
Figure 8
Heatmap representation of the data cube aggregating together the meteorological data for all the Italian regions and the COVID-19 data. The heatmap’s labels refer to the attribute’s measured value in a specific week of the year. For instance, ’PM10’, 9 refers to the level of PM10 (μg/m3) in the air measured in the 9-th week of the year. In Figure the yellow squares highlight the strong correlation between positive cases and the presence of rain, whereas green squares show the strong negative correlation between wind and the number of positive cases.

References

    1. Chen Y., Liu Q., Guo D. Emerging coronaviruses: Genome structure, replication, and pathogenesis. J. Med. Virol. 2020;92:418–423. doi: 10.1002/jmv.25681. - DOI - PMC - PubMed
    1. World Health Organization . World Health Organization: Coronavirus Disease 2019 (COVID-19) World Health Organization; Geneva, Switzerland: 2020. Situation Report, 88.
    1. Le T.T., Andreadakis Z., Kumar A., Roman R.G., Tollefsen S., Saville M., Mayhew S. The COVID-19 vaccine development landscape. Nat. Rev. Drug Discov. 2020;19:305–306. - PubMed
    1. Phua J., Weng L., Ling L., Egi M., Lim C.M., Divatia J.V., Shrestha B.R., Arabi Y.M., Ng J., Gomersall C.D., et al. Intensive care management of coronavirus disease 2019 (COVID-19): Challenges and recommendations. Lancet Respir. Med. 2020;8:506–517. doi: 10.1016/S2213-2600(20)30161-2. - DOI - PMC - PubMed
    1. Rosenbaum L. Facing Covid-19 in Italy—Ethics, logistics, and therapeutics on the epidemic’s front line. N. Engl. J. Med. 2020;382:1873–1875. doi: 10.1056/NEJMp2005492. - DOI - PubMed

LinkOut - more resources