. 2020 Oct;586(7830):567-571.
doi: 10.1038/s41586-020-2622-0. Epub 2020 Aug 5.

SARS-CoV-2 mRNA vaccine design enabled by prototype pathogen preparedness

Affiliations

SARS-CoV-2 mRNA vaccine design enabled by prototype pathogen preparedness

Kizzmekia S Corbett et al. Nature. 2020 Oct.

Abstract

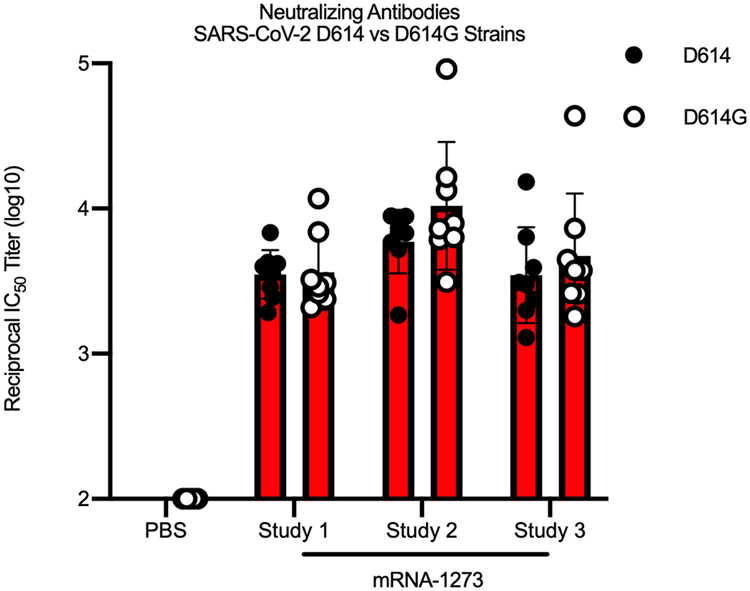
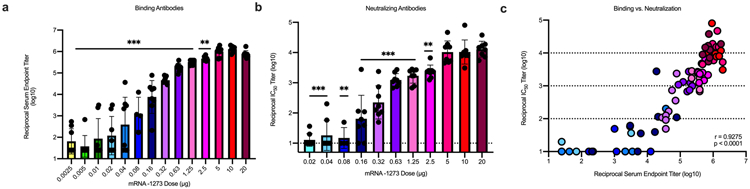
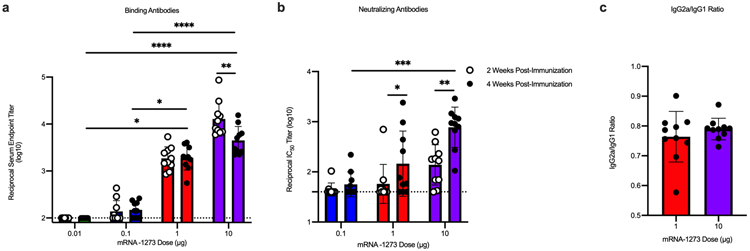
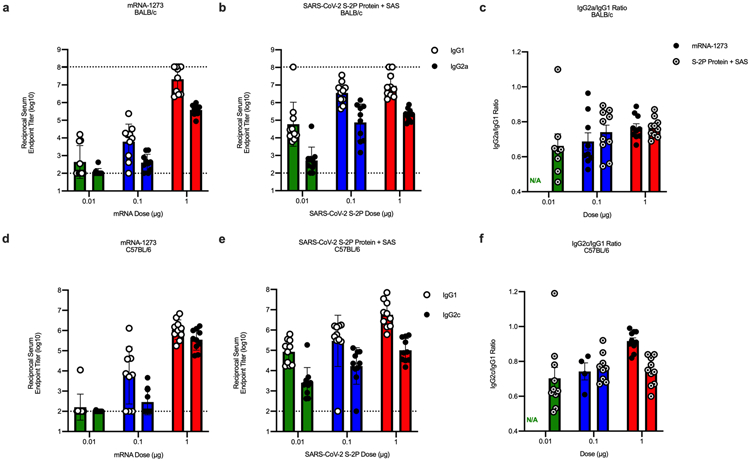
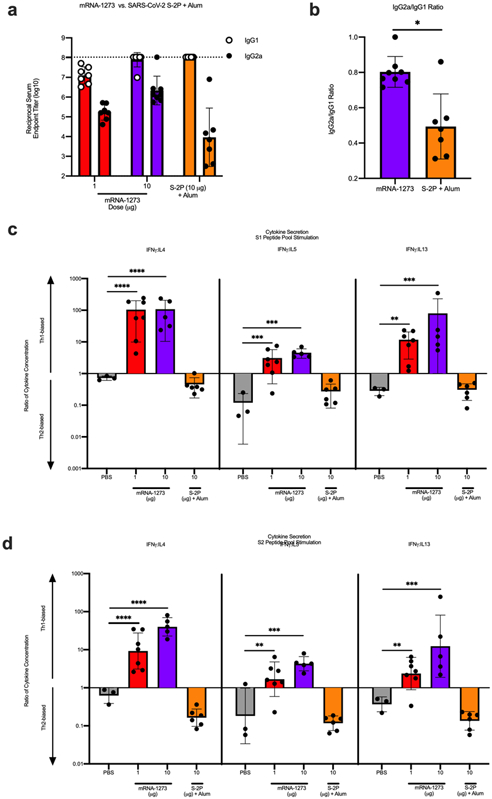
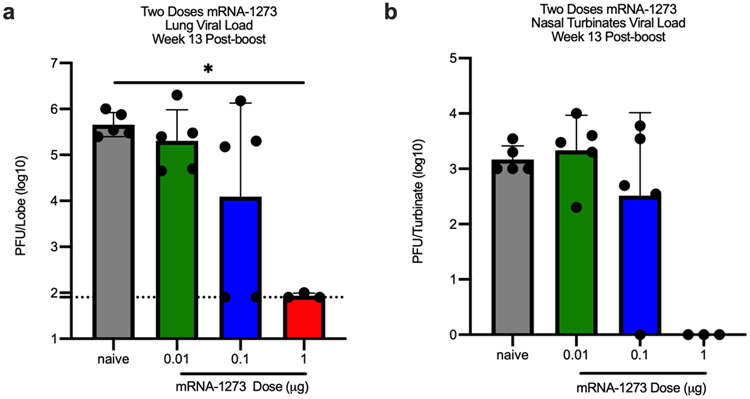
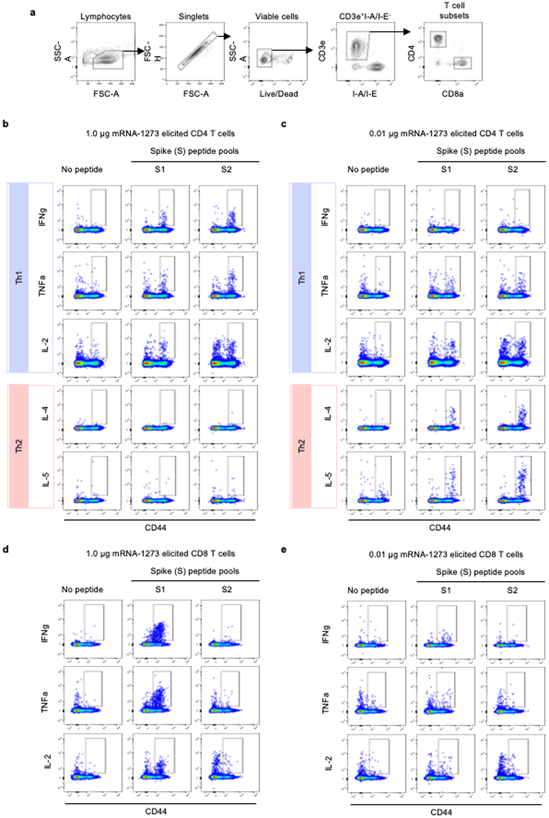
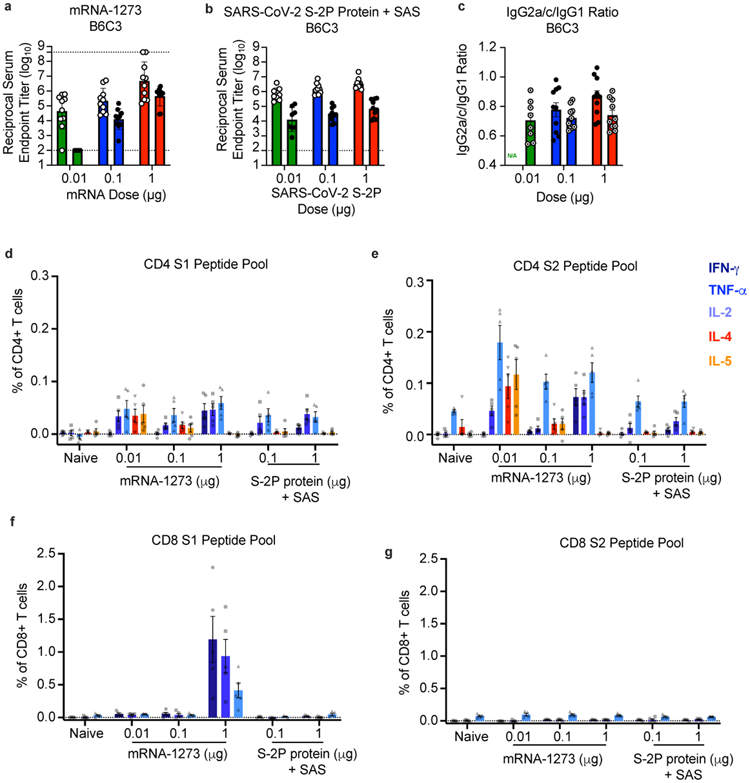
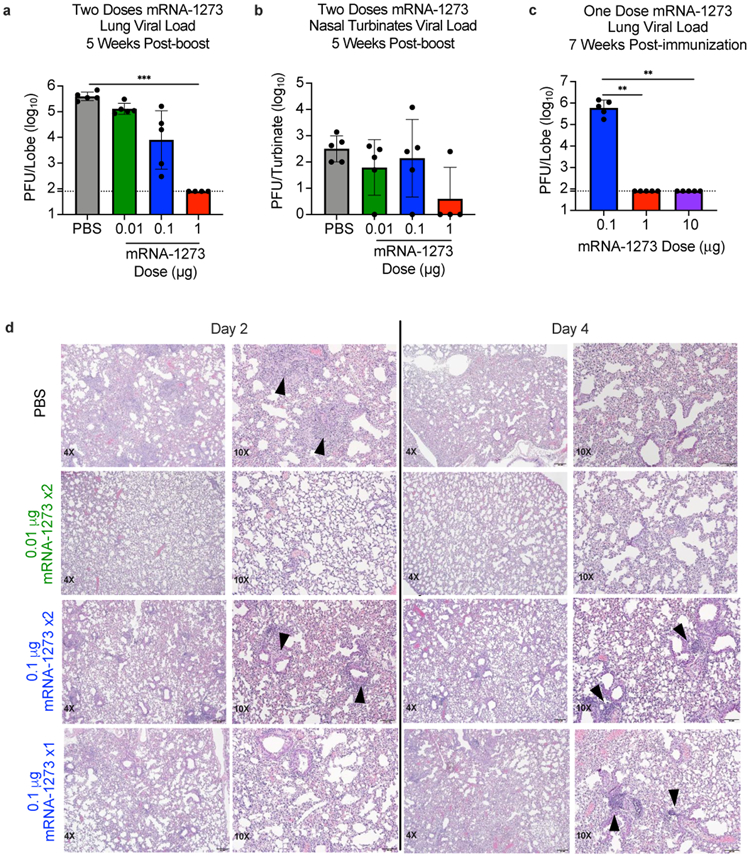
A vaccine for severe acute respiratory syndrome coronavirus 2 (SARS-CoV-2) is needed to control the coronavirus disease 2019 (COVID-19) global pandemic. Structural studies have led to the development of mutations that stabilize Betacoronavirus spike proteins in the prefusion state, improving their expression and increasing immunogenicity1. This principle has been applied to design mRNA-1273, an mRNA vaccine that encodes a SARS-CoV-2 spike protein that is stabilized in the prefusion conformation. Here we show that mRNA-1273 induces potent neutralizing antibody responses to both wild-type (D614) and D614G mutant2 SARS-CoV-2 as well as CD8+ T cell responses, and protects against SARS-CoV-2 infection in the lungs and noses of mice without evidence of immunopathology. mRNA-1273 is currently in a phase III trial to evaluate its efficacy.


Conflict of interest statement

Competing Interest Declaration

K.S.C., N.W., J.S.M., and B.S.G. are inventors on International Patent Application No. WO/2018/081318 entitled “Prefusion Coronavirus Spike Proteins and Their Use.” K.S.C., O.M.A., G.B.H., N.W., D.W., J.S.M, and B.S.G. are inventors on US Patent Application No. 62/972,886 entitled “2019-nCoV Vaccine”. R.S.B. filed an invention report for the SARS-CoV-2 MA virus (UNC ref. #18752).

Figures

Extended Data Figure 1.
Extended Data Figure 1.. Transmembrane-anchored MERS-CoV S-2P (S-2P_TM) mRNA elicits more potent pseudovirus neutralizing antibody responses than secreted MERS-CoV S-2P and S WT mRNA.
C57BL/6J mice (n=10/group) were immunized at weeks 0 and 4 with (a) 0.4, 2, or 10 μg of MERS-CoV S-2P_TM (red) or MERS S-2P_secreted (red hashed) or (b) 0.016 μg, 0.08 μg, or 0.4 μg of MERS-CoV S-2P or MERS-CoV S WT_TM (black) mRNA. Sera were collected 4 weeks post-boost and assessed for neutralizing antibodies against MERS-CoV m35c4 pseudovirus. Immunogens were compared at each dose level by two-sided Mann-Whitney test. * = p-value < 0.05, **** = p-value < 0.0001. Data are presented as GMT +/− geometric SD.
Extended Data Figure 2.
Extended Data Figure 2.. Timeline for mRNA-1273’s progression to clinical trial.
The morning after novel coronavirus (nCoV) sequences were released, spike sequences were modified to include prefusion stabilizing mutations and synthesized for protein production, assay development, and vaccine development. Twenty-five days after viral sequences were released, clinically-relevant mRNA-1273 was received to initiate animal experiments. Immunogenicity in mice was confirmed 15 days later. Moderna shipped clinical drug product 41 days after GMP production began, leading to the Phase 1 clinical trial starting 66 days following the release of nCoV sequences.
Extended Data Figure 3.
Extended Data Figure 3.. In vitro expression of SARS-CoV-2 spike mRNA on cell surface.
293T cells were transfected in duplicate with mRNA expressing SARS-CoV-2 wild-type spike (white bars, black lines) or S-2P (red), stained with ACE2 (a,c) or CR3022 (b,d), and evaluated by flow cytometry 24 post-transfection. Mock-transfected (PBS) cells served as a control (gray). (a-b) Data are presented as mean.
Extended Data Figure 4.
Extended Data Figure 4.. mRNA-1273 elicits robust pseudovirus neutralizing antibody responses to SARS-CoV-2_D614G.
BALB/c mice (n=8/group) were immunized at weeks 0 and 3 weeks with 1 μg (red) of mRNA-1273, in three individual studies, or PBS (n=5). Sera were collected 2 weeks post-boost and assessed for neutralizing antibodies against homotypic SARS-CoV-2_D614 pseudovirus (filled circles) or SARS-CoV-2_D614G (unfilled circles). Comparisons between D614 and D614G were made by two-sided Mann-Whitney test within each study, and no significance was detected. Data are presented as GMT +/− geometric SD.
Extended Data Figure 5.
Extended Data Figure 5.. Dose-dependent mRNA-1273-elicited antibody responses reveal strong positive correlation between binding and pseudovirus neutralization titers.
BALB/cJ mice (n=10/group) were immunized at weeks 0 and 3 weeks with various doses (0.0025 – 20 μg) of mRNA-1273. Sera were collected 2 weeks post-boost and assessed for SARS-CoV-2 S-specific IgG by ELISA (a) and neutralizing antibodies against homotypic SARS-CoV-2 pseudovirus (b). (a-b) All doses were compared to the 20 μg dose by two-sided Mann-Whitney test in a stepwise fashion, such that lowest doses were tested first at α = 0.05 and higher doses tested only if the lower doses were significant. Data are presented as GMT +/− geometric SD, and dotted lines represent assay limits of detection. (c) Spearman correlation test was used to correlate binding antibody titers to pseudovirus neutralizing antibody titers (p < 0.0001). Each dot represents an individual mouse. Dotted lines highlight log10 IC50 boundaries. ** = p-value < 0.01, *** = p-value < 0.001.
Extended Data Figure 6.
Extended Data Figure 6.. A single dose of mRNA-1273 elicits robust antibody responses.
BALB/cJ mice (n=10/group) were immunized with 0.01 (green), 0.1 (blue), 1 μg (red), or 10 μg (purple) of mRNA-1273. Sera were collected 2 (unfilled circles) and 4 (filled circles) weeks post-immunization and assessed for SARS-CoV-2 S-specific total IgG by ELISA (a) and neutralizing antibodies against homotypic SARS-CoV-2 pseudovirus (b). (c) S-specific IgG2a and IgG1 were also measured by ELISA, and IgG2a to IgG1 subclass ratios were calculated. (a-b) Timepoints were compared within each dose level by two-sided Wilcoxon signed-rank test, and doses were compared 4 weeks post-boost by Kruskal-Wallis ANOVA with Dunn’s multiple comparisons test. * = p-value < 0.05, ** = p-value < 0.01, *** = p-value < 0.001, **** = p-value < 0.0001. (c) Doses were compared by two-sided Mann-Whitney test, and no significance was found. Data are presented as GMT +/− geometric SD (a-b) or mean +/− SD (c), and dotted lines represent assay limits of detection.
Extended Data Figure 7.
Extended Data Figure 7.. mRNA-1273 and SAS-adjuvanted S-2P protein elicit both IgG2a and IgG1 subclass S-binding antibodies.
BALB/cJ (a-c) or C57BL/6J (d-f) mice (n=10/group) were immunized at weeks 0 and 3 with 0.01 (green), 0.1 (blue), or 1 μg (red) of mRNA-1273 or SARS-CoV-2 S-2P protein adjuvanted with SAS. Sera were collected 2 weeks post-boost and assessed by ELISA for SARS-CoV-2 S-specific IgG1 and IgG2a or IgG2c for BALB/cJ and C57BL/6J mice, respectively. Endpoint titers (a-b, d-e) and endpoint titer ratios of IgG2a to IgG1 (c) and IgG2c to IgG1 (f) were calculated. For mice for which endpoint titers did not reach the lower limit of detection (dotted line), ratios were not calculated (N/A). Data are presented as GMT +/− geometric SD (a-b, d-e) or mean +/− SD (c,f).
Extended Data Figure 8.
Extended Data Figure 8.. mRNA-1273 elicits Th1-skewed responses compared to S-2P protein adjuvanted with alum.
BALB/c mice (n=6/group) were immunized at weeks 0 and 2 weeks with 1 (red) or 10 μg (purple) of mRNA-1273 or 10 μg of SARS-CoV-2 S-2P protein adjuvanted with alum hydrogel (orange). Control mice were administered PBS (gray) (n=3). (a-b) Sera were collected 2 weeks post-boost and assessed by ELISA for SARS-CoV-2 S-specific IgG1 and IgG2a. Endpoint titers (a) and endpoint titer ratios of IgG2a to IgG1 (b) were calculated. (c-d) Splenocytes were collected 4 weeks post-boost to evaluate IFN-γ, IL-4, IL-5, and IL-13 cytokine levels secreted by T cells re-stimulated with S1 (c) and S2 (d) peptide pools, measured by Luminex. (b) Immunogens were compared by two-sided Mann-Whitney test. (c-d) For cytokines, all comparisons were compared to PBS control mice by Kruskal-Wallis ANOVA with Dunn’s multiple comparisons test. * = p-value < 0.05, ** = p-value < 0.01, *** = p-value < 0.001, **** = p-value < 0.0001. Data are presented as GMT +/− geometric SD (a) or mean +/− SD (b-d). Dotted line represents assay limit of detection.
Extended Data Figure 9.
Extended Data Figure 9.. mRNA-1273 protects mice from upper and lower airway SARS-CoV-2 infection, 13 weeks post-boost.
BALB/cJ mice were immunized at weeks 0 and 3 with 0.01 (green), 0.1 (blue), or 1 μg (red) of mRNA-1273. Age-matched naive mice (gray) served as controls. Thirteen weeks post-boost, mice were challenged with mouse-adapted SARS-CoV-2. Two days post-challenge, at peak viral load, mouse lungs (a) and nasal turbinates (b) were harvested from 5 mice per group (3 mice for the 1 μg group) for analysis of viral titers. All dose levels were compared by Kruskal-Wallis ANOVA with Dunn’s multiple comparisons test. * = p-value < 0.05. Data are presented as GMT +/− geometric SD. Dotted line represents assay limit of detection.
Extended Data Figure 10.
Extended Data Figure 10.. Flow cytometry panel to quantify SARS-CoV-2 S-specific T cells in mice.
(a) Related to Figure 3d-g, hierarchical gating strategy was used to unambiguously identify single, viable CD4+ and CD8+ T cells. Gating summary of SARS-CoV-2 S-specific (b-c) CD4+ and (d-e) CD8+ T cells elicited by 0.1 and 1 μg mRNA-1273 immunization. Antigen-specific T cell responses following peptide pool re-stimulation were defined as CD44hi/cytokine+. Concatenated files shown were generated using the same number of randomly selected events from each animal across the different stimulation conditions using FlowJo software, v10.6.2.
Figure 1.
Figure 1.. MERS-CoV S-2P mRNA protects mice from lethal challenge.
288/330+/+ mice were immunized at weeks 0 and 3 with 0.01 (green), 0.1 (blue), or 1 μg (red) of MERS-CoV S-2P mRNA. Control mice were administered PBS (gray). Two weeks post-boost, sera were collected from 3 mice per group and assessed for neutralizing antibodies against MERS m35c4 pseudovirus (a). Four weeks post-boost, 12 mice per group were challenged with a lethal dose of mouse-adapted MERS-CoV (m35c4). Following challenge, mice were monitored for weight loss (b). Two days post-challenge, at peak viral load, lung viral titers (c) and hemorrhage (0 = no hemorrhage, 4 = severe hemorrhage in all lobes) (d) were assessed from 5 animals per group. (a) Statistical analysis was not performed. (c-d) All dose levels were compared by Kruskal-Wallis ANOVA with Dunn’s multiple comparisons test. (b) For weight loss, all comparisons are to PBS control mice at each timepoint by two-sided Mann-Whitney test. ** = p-value < 0.01, **** = p-value < 0.0001. Data are presented as GMT +/− geometric SD (a,c) or mean +/− SD (b,d). (c) Dotted line represents assay limit of detection.
Figure 2.
Figure 2.. mRNA-1273 elicits robust binding and pseudovirus neutralizing antibody responses in multiple mouse strains.
BALB/cJ (a, d), C57BL/6J (b, e), or B6C3F1/J (c, f) mice (n=10/group) were immunized at weeks 0 and 3 weeks with 0.01 (green), 0.1 (blue), or 1 μg (red) of mRNA-1273. Control BALB/cJ mice were administered PBS (gray). Sera were collected 2 weeks post-prime (unfilled circles) and 2 weeks post-boost (filled circles) and assessed for SARS-CoV-2 S-specific IgG by ELISA (a-c), and, for post-boost sera, neutralizing antibodies against homotypic SARS-CoV-2 pseudovirus (d-f). (a-c) Timepoints were compared within each dose level by two-sided Wilcoxon signed-rank test, and doses were compared post-boost by Kruskal-Wallis ANOVA with Dunn’s multiple comparisons test. (d-f) Vaccine groups were compared by two-sided Mann-Whitney test. * = p-value < 0.05, ** = p-value < 0.01, *** = p-value < 0.001, **** = p-value < 0.0001. Data are presented as GMT +/− geometric SD. Dotted lines represent assay limits of detection.
Figure 3.
Figure 3.. Immunizations with mRNA-1273 and S-2P protein, delivered with TLR4 agonist, elicit S-specific Th1-biased T cell responses.
B6C3F1/J mice (n=10/group) were immunized at weeks 0 and 3 with 0.01, 0.1, or 1 μg of mRNA-1273 or SAS-adjuvanted SARS-CoV-2 S-2P protein. Sera were collected 2 weeks post-boost and assessed by ELISA for SARS-CoV-2 S-specific IgG1 and IgG2a/c. Endpoint titers (a-b) and endpoint titer ratios of IgG2a/c to IgG1 (c) were calculated. For mice for which endpoint titers did not reach the lower limit of detection (dotted line), ratios were not calculated (N/A). (d-g) Seven weeks post-boost, splenocytes were isolated from 5 mice per group and re-stimulated with no peptides or pools of overlapping peptides from SARS-CoV-2 S protein in the presence of a protein transport inhibitor cocktail. After 6 hours, intracellular cytokine staining (ICS) was performed to quantify CD4+ and CD8+ T cell responses. Cytokine expression in the presence of no peptides was considered background and subtracted from the responses measured from the S1 and S2 peptide pools for each individual mouse. (d-e) CD4+ T cells expressing IFN-γ, TNF-α, IL-2, IL-4 and IL-5 in response to the S1 (d) and S2 (e) peptide pools. (f-g) CD8+ T cells expressing IFN-γ, TNF-α, and IL-2 in response to the S1 (f) and S2 (g) peptide pools.
Figure 4.
Figure 4.. mRNA-1273 protects mice from upper and lower airway SARS-CoV-2 infection.
(a-b) BALB/cJ mice (n=10/group) immunized at weeks 0 and 3 with 0.01 (green), 0.1 (blue), or 1 μg (red) of mRNA-1273 or PBS, were challenged with mouse-adapted SARS-CoV-2 five weeks post-boost. (c) Other groups were immunized with single doses of 0.1 (blue),1 (red), or 10 (purple) μg of mRNA-1273 and challenged 7 weeks post-immunization. Two days post-challenge, at peak viral load, mouse lungs (a,c) and nasal turbinates (b) were harvested from 5 mice/group to measure viral titers. (a-c) Data are presented as GMT+/−geometric SD, and dotted lines represent assay limits-of-detection. Group comparisons were made by Kruskal-Wallis ANOVA with Dunn’s multiple comparisons test. **=p-value<0.01, ***=p-value<0.001. (d) At days 2 and 4 post-challenge, Hematoxylin and eosin-stained lung sections were examined from 5 mice per group, and representative photomicrographs (4X and 10X) from each group with detectable virus in lung are shown. Day 2 lungs from PBS control mice demonstrated moderate-to-severe, predominantly neutrophilic, inflammation present within, and surrounding, small bronchioles (arrowheads); alveolar capillaries were markedly expanded by infiltrating inflammatory cells. In the 0.01 μg two-dose group, inflammation was minimal to absent. In the 0.1 μg two-dose group, occasional areas of inflammation intimately associated with small airways (bronchioles) and adjacent vasculature (arrowheads) were seen, primarily composed of neutrophils. In the single-dose 0.1 μg group, there were mild patchy expansion of alveolar septae by mononuclear and polymorphonuclear cells. At day 4, lungs from PBS control mice exhibited moderate to marked expansion of alveolar septae (interstitial pattern) with decreased prominence of adjacent alveolar spaces. In the 0.01 μg two-dose group, inflammation was minimal to absent. Lungs in the 0.1 μg two-dose group showed mild, predominantly lymphocytic inflammation, associated with bronchioles and adjacent vasculature (arrowheads). In the single-dose 0.1 μg group there was mild, predominantly lymphocytic, inflammation around bronchovascular bundles (arrowheads).

Update of

  • SARS-CoV-2 mRNA Vaccine Development Enabled by Prototype Pathogen Preparedness.
    Corbett KS, Edwards D, Leist SR, Abiona OM, Boyoglu-Barnum S, Gillespie RA, Himansu S, Schäfer A, Ziwawo CT, DiPiazza AT, Dinnon KH, Elbashir SM, Shaw CA, Woods A, Fritch EJ, Martinez DR, Bock KW, Minai M, Nagata BM, Hutchinson GB, Bahl K, Garcia-Dominguez D, Ma L, Renzi I, Kong WP, Schmidt SD, Wang L, Zhang Y, Stevens LJ, Phung E, Chang LA, Loomis RJ, Altaras NE, Narayanan E, Metkar M, Presnyak V, Liu C, Louder MK, Shi W, Leung K, Yang ES, West A, Gully KL, Wang N, Wrapp D, Doria-Rose NA, Stewart-Jones G, Bennett H, Nason MC, Ruckwardt TJ, McLellan JS, Denison MR, Chappell JD, Moore IN, Morabito KM, Mascola JR, Baric RS, Carfi A, Graham BS. Corbett KS, et al. bioRxiv [Preprint]. 2020 Jun 11:2020.06.11.145920. doi: 10.1101/2020.06.11.145920. bioRxiv. 2020. Update in: Nature. 2020 Oct;586(7830):567-571. doi: 10.1038/s41586-020-2622-0. PMID: 32577634 Free PMC article. Updated. Preprint.

References

    1. Pallesen J et al. Immunogenicity and structures of a rationally designed prefusion MERS-CoV spike antigen. Proceedings of the National Academy of Sciences 114, E7348–E7357, doi:10.1073/pnas.1707304114 (2017). - DOI - PMC - PubMed
    1. Korber B et al. Tracking changes in SARS-CoV-2 Spike: evidence that D614G increases infectivity of the COVID-19 virus. Cell, doi:10.1016/j.cell.2020.06.043 (2020). - DOI - PMC - PubMed
    1. Dong E, Du H & Gardner L An interactive web-based dashboard to track COVID-19 in real time. The Lancet Infectious Diseases 20, 533–534, doi:10.1016/S1473-3099(20)30120-1 (2020). - DOI - PMC - PubMed
    1. Keni R, Alexander A, Nayak PG, Mudgal J & Nandakumar K COVID-19: Emergence, Spread, Possible Treatments, and Global Burden. Frontiers in Public Health 8, doi:10.3389/fpubh.2020.00216 (2020). - DOI - PMC - PubMed
    1. Graham BS Rapid COVID-19 vaccine development. Science 368, 945–946, doi:10.1126/science.abb8923 (2020). - DOI - PubMed

Publication types

MeSH terms