

Comprehensive multi-omics analysis uncovers a group of TGF-β-regulated genes among lncRNA EPR direct transcriptional targets
- PMID: 32756918
- PMCID: PMC7498312
- DOI: 10.1093/nar/gkaa628
Comprehensive multi-omics analysis uncovers a group of TGF-β-regulated genes among lncRNA EPR direct transcriptional targets
Abstract
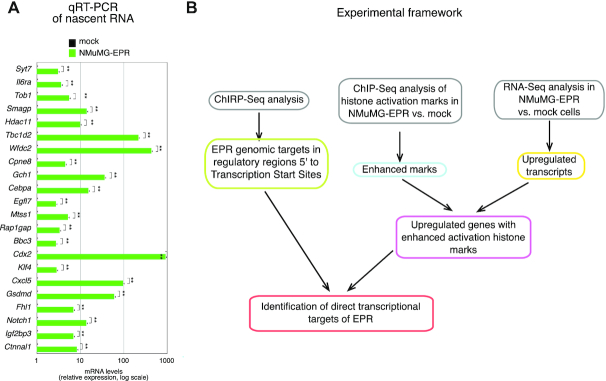
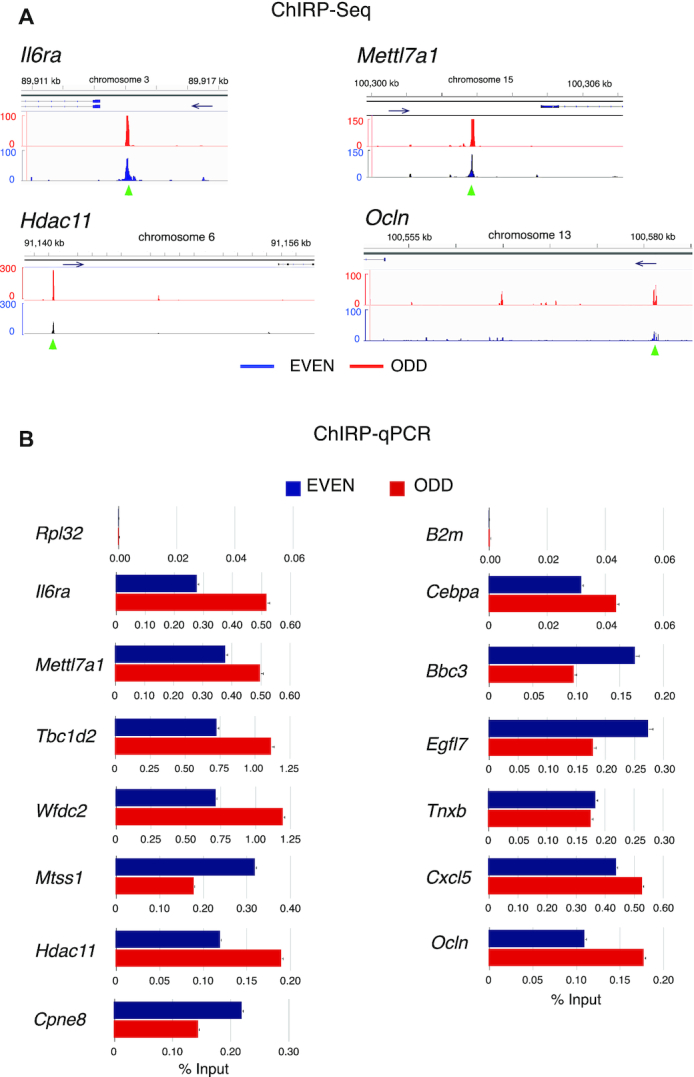
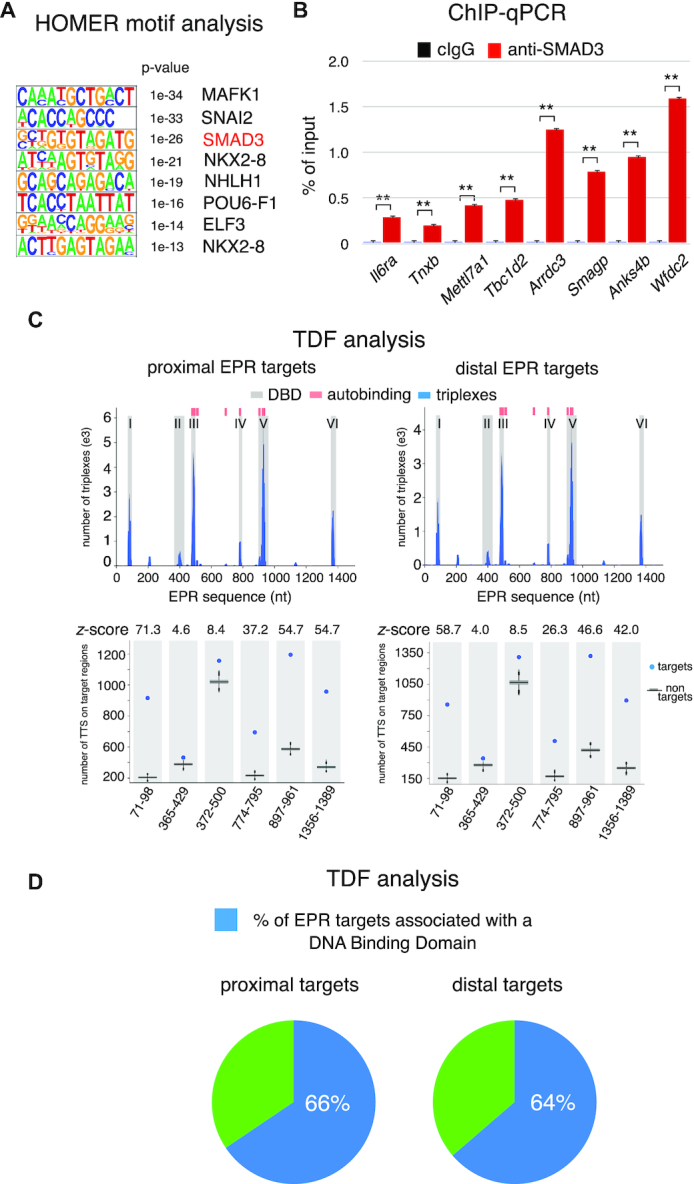
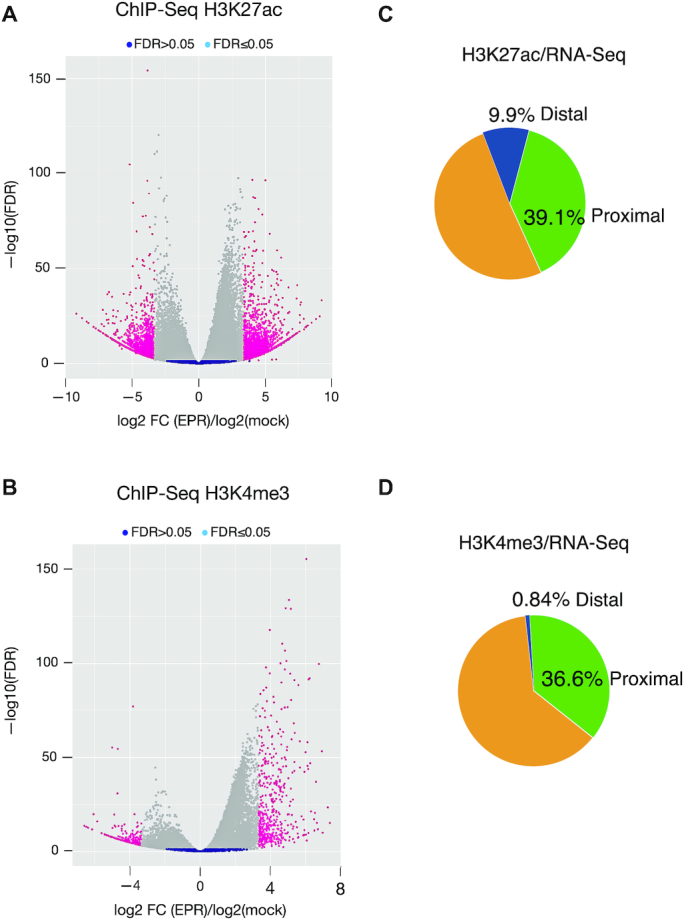
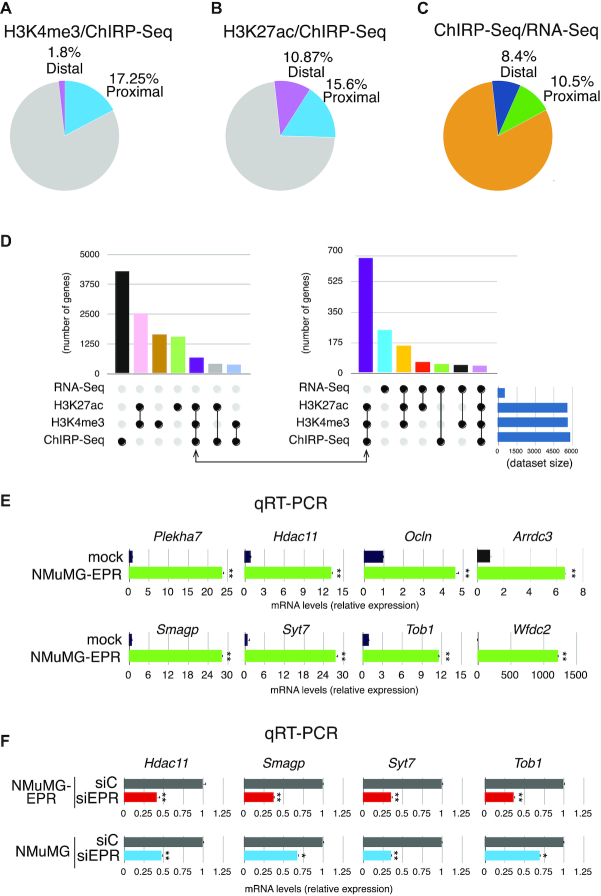
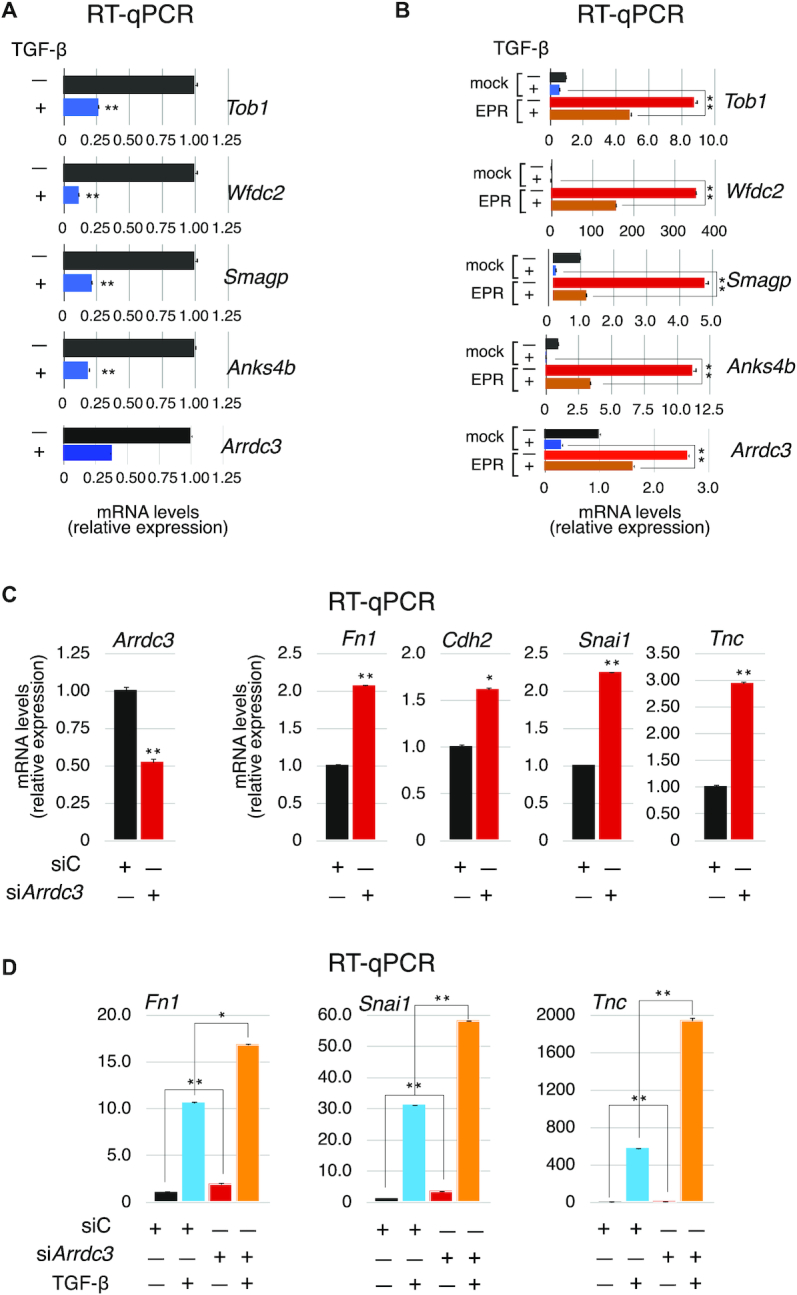
Long non-coding RNAs (lncRNAs) can affect multiple layers of gene expression to control crucial cellular functions. We have previously demonstrated that the lncRNA EPR, by controlling gene expression at different levels, affects cell proliferation and migration in cultured mammary gland cells and impairs breast tumor formation in an orthotopic transplant model in mice. Here, we used ChIRP-Seq to identify EPR binding sites on chromatin of NMuMG mammary gland cells overexpressing EPR and identified its trans binding sites in the genome. Then, with the purpose of relating EPR/chromatin interactions to the reshaping of the epitranscriptome landscape, we profiled histone activation marks at promoter/enhancer regions by ChIP-Seq. Finally, we integrated data derived from ChIRP-Seq, ChIP-Seq as well as RNA-Seq in a comprehensive analysis and we selected a group of bona fide direct transcriptional targets of EPR. Among them, we identified a subset of EPR targets whose expression is controlled by TGF-β with one of them-Arrdc3-being able to modulate Epithelial to Mesenchymal Transition. This experimental framework allowed us to correlate lncRNA/chromatin interactions with the real outcome of gene expression and to start defining the gene network regulated by EPR as a component of the TGF-β pathway.
© The Author(s) 2020. Published by Oxford University Press on behalf of Nucleic Acids Research.
Figures
Similar articles
-
Long non-coding RNAs (LncRNA) regulated by transforming growth factor (TGF) β: LncRNA-hit-mediated TGFβ-induced epithelial to mesenchymal transition in mammary epithelia.J Biol Chem. 2015 Mar 13;290(11):6857-67. doi: 10.1074/jbc.M114.610915. Epub 2015 Jan 20. J Biol Chem. 2015. PMID: 25605728 Free PMC article.
-
Long non-coding RNAs AC026904.1 and UCA1: a "one-two punch" for TGF-β-induced SNAI2 activation and epithelial-mesenchymal transition in breast cancer.Theranostics. 2018 Apr 15;8(10):2846-2861. doi: 10.7150/thno.23463. eCollection 2018. Theranostics. 2018. PMID: 29774079 Free PMC article.
-
Silencing of lncRNA EZR-AS1 inhibits proliferation, invasion, and migration of colorectal cancer cells through blocking transforming growth factor β signaling.Biosci Rep. 2019 Nov 29;39(11):BSR20191199. doi: 10.1042/BSR20191199. Biosci Rep. 2019. PMID: 31693738 Free PMC article.
-
LncRNA EPR controls epithelial proliferation by coordinating Cdkn1a transcription and mRNA decay response to TGF-β.Nat Commun. 2019 Apr 29;10(1):1969. doi: 10.1038/s41467-019-09754-1. Nat Commun. 2019. PMID: 31036808 Free PMC article.
-
LncRNA SNHG6 promotes proliferation, invasion and migration in colorectal cancer cells by activating TGF-β/Smad signaling pathway via targeting UPF1 and inducing EMT via regulation of ZEB1.Int J Med Sci. 2019 Jan 1;16(1):51-59. doi: 10.7150/ijms.27359. eCollection 2019. Int J Med Sci. 2019. PMID: 30662328 Free PMC article.
Cited by
-
The α-Arrestin ARRDC3 Is an Emerging Multifunctional Adaptor Protein in Cancer.Antioxid Redox Signal. 2022 May;36(13-15):1066-1079. doi: 10.1089/ars.2021.0193. Epub 2022 Jan 4. Antioxid Redox Signal. 2022. PMID: 34465145 Free PMC article. Review.
-
E3 ubiquitin ligase HECTD2 mediates melanoma progression and immune evasion.Oncogene. 2021 Sep;40(37):5567-5578. doi: 10.1038/s41388-021-01885-4. Epub 2021 Jun 18. Oncogene. 2021. PMID: 34145398 Free PMC article.
-
Long noncoding RNA network for lncRNA-mRNA interactions throughout swine estrous cycle reveals developmental and hormonal regulations in reproductive tissues.J Anim Sci Technol. 2024 Nov;66(6):1109-1126. doi: 10.5187/jast.2023.e137. Epub 2024 Nov 30. J Anim Sci Technol. 2024. PMID: 39691614 Free PMC article.
-
3plex enables deep computational investigation of triplex forming lncRNAs.Comput Struct Biotechnol J. 2023 May 17;21:3091-3102. doi: 10.1016/j.csbj.2023.05.016. eCollection 2023. Comput Struct Biotechnol J. 2023. PMID: 37273849 Free PMC article.
-
TGFβ-induced long non-coding RNA LINC00313 activates Wnt signaling and promotes cholangiocarcinoma.EMBO Rep. 2024 Mar;25(3):1022-1054. doi: 10.1038/s44319-024-00075-z. Epub 2024 Feb 8. EMBO Rep. 2024. PMID: 38332153 Free PMC article.
References
Publication types
MeSH terms
Substances
LinkOut - more resources
Full Text Sources
Medical
Molecular Biology Databases
