

Sarcopenia and high NLR are associated with the development of hyperprogressive disease after second-line pembrolizumab in patients with non-small-cell lung cancer
- PMID: 32757277
- PMCID: PMC7670147
- DOI: 10.1111/cei.13505
Sarcopenia and high NLR are associated with the development of hyperprogressive disease after second-line pembrolizumab in patients with non-small-cell lung cancer
Abstract
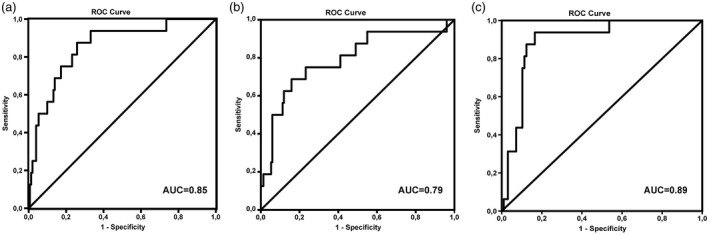
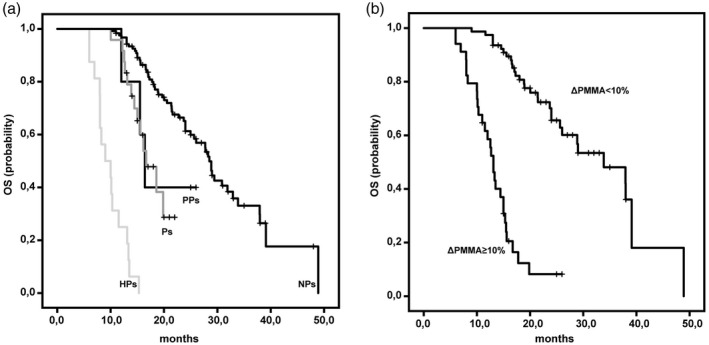
The aim of this multi-center retrospective study was to evaluate the incidence of hyperprogressive disease (HPD) after second-line treatment with pembrolizumab in patients (n = 167) with metastatic non-small-cell lung cancer (NSCLC) whose tumors expressed programmed cell death ligand 1 (PD-L1) in ≥ 1% and to search for hematological and imaging biomarkers associated with its development. Prior to chemotherapy, neutrophil : lymphocyte ratio (NLR1) and platelet : lymphocyte ratio (PLR1), and prior to immunotherapy, NLR2 and PLR2 were retrospectively analyzed. The psoas major muscle area (PMMA) was calculated at the L3 position on computed tomography before chemotherapy (PMMA1) and before immunotherapy (PMMA2) (n = 112). Patients with ∆PMMA (1-PMMA2/PMMA1) × 100 ≥ 10% were considered to have sarcopenia (low muscle mass). After treatment with pembrolizumab on the first computerized tomography (CT) scan evaluation, patients were subdivided as follows as: hyperprogressors (HPs), progressors (Ps), non-progressors (NPs) and pseudoprogressors (PPs). HPs had significantly higher ∆PMMA levels, NLR2 and PLR2 than the other patients. Moreover, in multinomial logistic regression analysis, higher levels of ∆PMMA were associated with a decreased likelihood of being a P [odds ratio (OR) = 0·81; 95% confidence interval (CI) = 0·65-0·99; P = 0·047] or an NP (OR = 0·76; 95% CI = 0·62-0·94; P = 0·012) versus an HP. Higher NLRs tended to decrease the likelihood of being a P versus an HP (OR = 0·66; 95% CI = 0·42-1·06; P = 0·09) and significantly decreased the likelihood of being an NP versus an HP (OR = 0·44; 95% CI = 0·28-0·69; P < 0·0001). Our data suggest that a high pre-immunotherapy NLR2 and the presence of sarcopenia are potential risk factors for the development of HPD.
Keywords: hyperprogressive disease; neutrophil : lymphocyte ratio; sarcopenia.
© 2020 British Society for Immunology.
Conflict of interest statement
The authors declare that they have no conflicts of interest.
Figures

References
-
- Torre LA, Siegel RL, Ward EM, Jemal A. Global cancer incidence and mortality rates and trends–an update. Cancer Epidemiol Biomark Prev 2016; 25:16–27. - PubMed
-
- Wu YL, Planchard D, Lu S et al Pan‐Asian adapted clinical practice guidelines for the management of patients with metastatic non‐small‐cell lung cancer: a CSCO–ESMO initiative endorsed by JSMO, KSMO, MOS, SSO and TOS. Ann Oncol 2019; 30:171–210. - PubMed
-
- Herbst RS, Baas P, Kim DW et al Pembrolizumab versus docetaxel for previously treated, PD‐L1‐positive, advanced non‐small‐cell lung cancer (KEYNOTE‐010): a randomised controlled trial. Lancet 2016; 387:1540–50. - PubMed
Publication types
MeSH terms
Substances
LinkOut - more resources
Full Text Sources
Medical
Research Materials
Miscellaneous
