

doi: 10.1164/rccm.202006-2219LE.
Pulmonary Vascular Dilatation Detected by Automated Transcranial Doppler in COVID-19 Pneumonia
Affiliations
- PMID: 32757969
- PMCID: PMC7528793
- DOI: 10.1164/rccm.202006-2219LE
Item in Clipboard
Pulmonary Vascular Dilatation Detected by Automated Transcranial Doppler in COVID-19 Pneumonia
Am J Respir Crit Care Med.
.
No abstract available
Figures
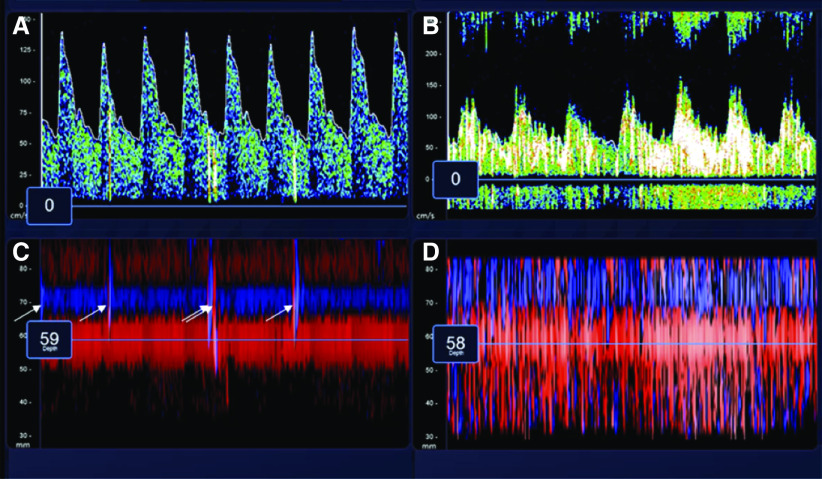
Assessment of microbubbles by transcranial Doppler (TCD) after injection of agitated saline. Representative images were captured during TCD evaluation after injection of agitated saline. (A and B) Continuous spectral waveforms of the middle cerebral artery (MCA) during insonation over 5 seconds. C and D demonstrate the power M-mode, and positive microbubbles appear as vertical lines (arrows). (A and C) Images from the left MCA of a 60-year-old woman in whom TCD detected five microbubbles. (B and D) Images from the right MCA of a 69-year-old man in whom TCD detected 300 microbubbles. His PaO2:Fi O2 ratio was 55 mm Hg, which was the lowest in the cohort.
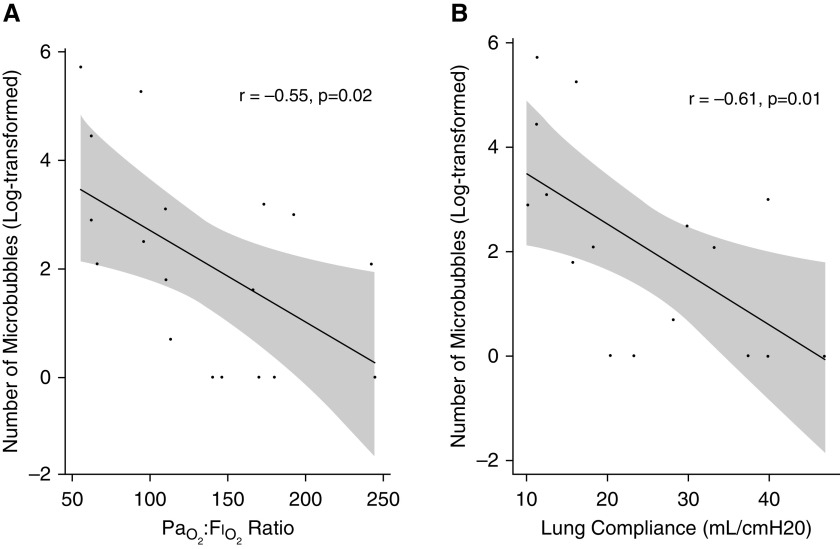
Associations between number of microbubbles and PaO2:Fi O2 ratio and lung compliance. (A) A scatterplot of the log-transformed number of microbubbles as detected by transcranial Doppler and PaO2:Fi O2 ratio (r = −0.55; P = 0.02) and suggests that the number of microbubbles increases with declining PaO2:Fi O2 ratio. (B) A scatterplot of the log-transformed number of microbubbles as detected by transcranial Doppler and lung compliance (r = −0.61; P = 0.01) and suggests that the number of microbubbles increases with declining lung compliance.
Comment in
-
Bubble Trouble in COVID-19.Am J Respir Crit Care Med. 2020 Oct 1;202(7):926-928. doi: 10.1164/rccm.202008-3096ED. Am J Respir Crit Care Med. 2020. PMID: 32822239 Free PMC article. No abstract available.
-
Positive Bubble Study in Severe COVID-19 Indicates the Development of Anatomical Intrapulmonary Shunts in Response to Microvascular Occlusion.Am J Respir Crit Care Med. 2021 Jan 15;203(2):263-265. doi: 10.1164/rccm.202008-3186LE. Am J Respir Crit Care Med. 2021. PMID: 32997512 Free PMC article. No abstract available.
-
Transpulmonary Bubble Transit in Severe COVID-19: Pulmonary Vasodilatation or Angiogenesis?Am J Respir Crit Care Med. 2021 Feb 1;203(3):388-389. doi: 10.1164/rccm.202009-3642LE. Am J Respir Crit Care Med. 2021. PMID: 33207120 Free PMC article. No abstract available.
-
Positive Bubble Study in Severe COVID-19: Bubbles May Be Unrelated to Gas Exchange Impairment.Am J Respir Crit Care Med. 2021 Feb 1;203(3):389-390. doi: 10.1164/rccm.202010-3800LE. Am J Respir Crit Care Med. 2021. PMID: 33207121 Free PMC article. No abstract available.
-
Reply to Chiang and Gupta and to Swenson et al.Am J Respir Crit Care Med. 2021 Feb 1;203(3):390-391. doi: 10.1164/rccm.202010-3974LE. Am J Respir Crit Care Med. 2021. PMID: 33207124 Free PMC article. No abstract available.
References
-
- Ramírez Moreno JM, Millán Núñez MV, Rodríguez Carrasco M, Ceberino D, Romaskevych-Kryvulya O, Constantino Silva AB, et al. Detection of an intrapulmonary shunt in patients with liver cirrhosis through contrast-enhanced transcranial Doppler: a study of prevalence, pattern characterization, and diagnostic validity [in Spanish] Gastroenterol Hepatol. 2015;38:475–483. - PubMed
-
- Teague SM, Sharma MK. Detection of paradoxical cerebral echo contrast embolization by transcranial Doppler ultrasound. Stroke. 1991;22:740–745. - PubMed
Publication types
Grants and funding
LinkOut - more resources
Full Text Sources
