. 2020 Jul 23;182(2):447-462.e14.
doi: 10.1016/j.cell.2020.05.048. Epub 2020 Jun 16.

The Intermucosal Connection between the Mouth and Gut in Commensal Pathobiont-Driven Colitis

Affiliations

The Intermucosal Connection between the Mouth and Gut in Commensal Pathobiont-Driven Colitis

Sho Kitamoto et al. Cell. .

Abstract

The precise mechanism by which oral infection contributes to the pathogenesis of extra-oral diseases remains unclear. Here, we report that periodontal inflammation exacerbates gut inflammation in vivo. Periodontitis leads to expansion of oral pathobionts, including Klebsiella and Enterobacter species, in the oral cavity. Amassed oral pathobionts are ingested and translocate to the gut, where they activate the inflammasome in colonic mononuclear phagocytes, triggering inflammation. In parallel, periodontitis results in generation of oral pathobiont-reactive Th17 cells in the oral cavity. Oral pathobiont-reactive Th17 cells are imprinted with gut tropism and migrate to the inflamed gut. When in the gut, Th17 cells of oral origin can be activated by translocated oral pathobionts and cause development of colitis, but they are not activated by gut-resident microbes. Thus, oral inflammation, such as periodontitis, exacerbates gut inflammation by supplying the gut with both colitogenic pathobionts and pathogenic T cells.

Keywords: Klebsiella; TH17; colitis; dysbiosis; inflammasome; inflammatory bowel disease; microbiota; oral bacteria; pathobiont; periodontitis.


Conflict of interest statement

Declaration of Interests The authors declare no competing interests.

Figures

Figure 1.
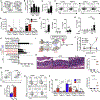
Figure 1.. Periodontitis Exacerbates Intestinal Inflammation
(A) SPF C57BL/6 mice received oral ligatures. At day 14, 1.5% DSS was given for 5 days, followed by regular water for 2 days. Mice were sacrificed at day 7 after DSS treatment. (B and C) Body weight and disease activity index (DAI). (−) DSS group, N = 5; (+) DSS group, N = 10. (D) Representative colonic histological images (scale bar, 100 μm). (E) Colonic histological score evaluated by the criteria for the DSS-induced colitis model. (F) Isolated colonic lamina propria (LP) cells were cultured (24 h), and secreted cytokines production was measured by ELISA. (G) cLP cells (pooled from 5 individual mice) were analyzed by CyTOF. A viSNE analysis was performed to identify main population differences among the four treatment groups. Each cluster is identified by its marker expression profile (Table S1). Density plots for the population clusters are shown. (H) Heatmap (populations 12 and 14) showing calculated fold of event counts by Row’s maximum using the x axis channel. (I and J) Representative flow cytometry plots and numbers of CD3+CD4+ T cells in the cLP. (K and L) Representative flow cytometry plots and numbers of Th1, Th17, and Treg cells in the cLP. (M) Cytokine production from CD4+ LP cells re-stimulated with αCD3/28 Abs for 24 h. Results are shown as mean ± SD (two-way ANOVA) or median (one-way ANOVA). Each dot indicates an individual mouse (N = 5–10). N.S., not significant; *p < 0.05, **p < 0.01, ***p < 0.001, ****p < 0.0001 by two-way ANOVA followed by Bonferroni post hoc test (B and C) or one-way ANOVA followed by Bonferroni post hoc test (E, F, J, L, and M). See also Figures S1 and S2 and Table S1.
Figure 2.
Figure 2.. Enterobacteriaceae Accumulate in Both the Oral Cavity and the Gut of Periodontitis-Colitis Mice
(A) Periodontitis was induced in SPF C57BL/6 mice by insertion of oral ligatures. Microbial changes in the oral cavity and fecal contents were analyzed by 16S rRNA sequencing. (B) Commonly enriched bacterial families in the oral cavity and gut in ligature-DSS mice compared with DSS mice were analyzed by LEfSe. (C–E) Enterobacteriaceae species isolated from oral cavities of dysbiotic mice (day 14 ligature). The abundance of the indicated bacterial species in the oral cavity (D) and feces (E) was assessed by qPCR. The abundance of bacteria relative to that found in non-ligatured control (Ctrl) mice is shown. Each dot indicates an individual mouse (N = 5–12). *p < 0.05, **p < 0.01, ****p < 0.0001 by Mann–Whitney U test (D) or by one-way ANOVA followed by Bonferroni post hoc test (E).
Figure 3.
Figure 3.. Ectopic Gut Colonization by Oral Pathobionts Leads to Development of Colitis in Genetically Susceptible Hosts
(A–E) Oral microbiota from healthy (3-h ligature placement, healthy oral microbiota [HOM]) and periodontitis (14-day ligature placement, ligature-associated microbiota [LOM]) mice were harvested. Il10−/− gnotobiotic mice were colonized with HOM or LOM and maintained for 56 days. (A and B) Body weight and fecal Lcn2 levels were monitored weekly. (C) Colon weight on day 56. (D and E) Representative colonic histological images (scale bar, 100 μm) and score (day 56) assessed by the criteria for the Il10−/− colitis model. (F–O) Synthetic microbial communities that mimic HOM and LOM were generated by combining bacterial isolates from the most abundant families that consist of oral microbes normally associated with oral health (synthetic HOM [sHOM]) or oral microbes associated with oral dysbiosis (synthetic LOM [sLOM]). Synthetic communities were inoculated into Il10−/− mice as described in (A)–(E). (G) Total bacteria burden (Eubacteria 16S rRNA) in feces from each group was quantified by qPCR (normalized to fecal weight). (H) Fecal Lcn2 levels. (I and J) Representative colonic histological images (scale bar, 100 μm) and histological score on day 56, assessed by the criteria for the Il10−/− colitis model. (K and L) Representative flow cytometry plots and number of CD3+CD4+ T cells in the cLP. (M and N) Representative flow cytometry plots and numbers of Th1, Th17, and Treg cells in the cLP. (O) Cytokine production from CD4+ LP cells re-stimulated with αCD3/28 Abs for 24 h. Results are shown as mean ± SD (two-way ANOVA) or median (one-way ANOVA). Each dot indicates an individual mouse (N = 5–9). *p < 0.05, **p < 0.01, ***p < 0.001, ****p < 0.0001 by two-way ANOVA followed by Bonferroni post hoc test (A, B, and H), one-way ANOVA followed by Bonferroni post hoc test (C, L, N, and O), or Mann-Whitney U test (E, G, and J).
Figure 4.
Figure 4.. Oral Pathobionts Elicit Colitis via Activation of the Inflammasome
(A) Heatmap showing fold mRNA increase (qPCR) of the indicated genes in colonic tissues of each group (Ctrl orHOM- or LOM-colonized Il10−/− gnotobiotic mice shown in Figures 3A–3E). (B) Gating strategy showing IL-1β+ leukocytes in the cLP of each group (Ctrl or sHOM- or sLOM-colonized Il10−/− gnotobiotic mice shown in Figures 3H–3L). (C and D) Percentage of CD45+ IL-1β+ cells in cLP mononuclear cells (LPMCs) and numbers of MHC class IIhiLy6Chi dendritic cells (DCs) and macrophages (Mac). (E) Gnotobiotic mice colonized by sham Ctrl (GF), sHOM, or sLOM at 7 days were treated with 1.5% DSS for 5 days in the absence or presence of anakinra (50 mg/kg/daily, intraperitoneally [i.p.]), followed by an additional 2 days with regular water. Colon weight (milligrams per centimeter) after 7 days of DSS treatment is shown. (F and G) Representative colonic histological images (scale bar, 100 μm) and histological score after 7 days of DSS treatment were evaluated by the criteria for the DSS colitis model. (H) LPMCs (from mice treated with DSS) or bone marrow-derived Macs (BMDMs) were co-cultured with the indicated bacterial strains (MOI = 5) for 3 h. Gentamicin (100 μg/mL) was then added, and cells were cultured for an additional 16 h. IL-1β production in the supernatant was measured by ELISA. (I) SPF B6 mice were treated with 2.0% DSS for 5 days, followed by an additional 2 days of regular water in the presence or absence of the oral pathobiont K. aerogenes (Ka; 109 colony-forming units [CFUs]/day, p.o.) and anakinra (50 mg/kg/day, i.p.). (J) Kinetics of body weight change. (K) Colon weight after 7 days of DSS treatment. (L) Colonic histological score 7 days after DSS treatment, evaluated by the criteria for the DSS colitis model. Results are shown as median (one-way ANOVA) or mean ± SD (two-way ANOVA). Each dot indicates an individual mouse (N = 5–9). *p < 0.05, **p < 0.01, ***p < 0.001, ****p < 0.0001 by one-way ANOVA followed by Bonferroni post hoc test (C–E, G, H, K, and L) or two-way ANOVA followed by Bonferroni post hoc test (J). See also Figures S3 and S4 and Table S2.
Figure 5.
Figure 5.. Periodontitis Elicits Generation of Oral Pathobiont-Reactive Th17 Cells
(A) Fluorescence-activated cell sorting (FACS) plot of CD3+CD4+ T cell subsets (naive (CD3+CD4+CD44loCD62Lhi), effector memory T (TEM) (CD3+CD4+ CD44hiCD62Llo), and central memory (CM) T (CD3+CD4+CD44hiCD62Lhi) cells in cLNs of Ctrl and ligatured (day 14) mice. (B) Frequency of CD3+CD4+ TEM cells in cLNs and mesenteric LNs (mLN) in Ctrl and ligatured (day 14) mice. (C) Number of TEM cells in cLN of mice with (day 14) or without ligatures. (D and E) Representative flow cytometry plots and numbers of Th1, Th17, and Treg cells in cLNs. (F) Cytokine production in supernatants from CD3+CD4+ T cells isolated from cLNs stimulated with αCD3/28 Abs for 24 h, measured by ELISA. (G) Bone marrow-derived dendritic cells (BMDCs) were pulsed with heat-killed, freshly isolated HOM (3-h ligature) or LOM (14-day ligature). Pulsed BMDCs were washed and co-cultured with CD3+CD4+ T cells isolated from cLNs of Ctrl or ligature (day 14) mice for 24 h. Secreted IL-17A in supernatants was analyzed by ELISA. (H) Responsiveness of oral CD4+ memory T cells in ligature mice (day 14) to specific oral and gut commensal bacteria. (I) GF Rag1−/− mice were colonized by sHOM or sLOM for 14 days. Oral CD3+CD4+CD44hiCD62LloCD25− TEM cells were isolated from the cLNs of ligature mice (day 14). Isolated TEM cells (2 × 10⁵ cells/mouse) were then adoptively transferred into gnotobiotic (sHOM or sLOM) Rag1−/− mice and Ctrl GF Rag1−/− mice. Oral TEM cell-transferred Rag1−/− mice were maintained for 8 weeks. (J) Fecal Lcn2 levels were monitored at the indicated time points. (K and L) Representative histological images of a colon (scale bar, 100 μm) and histological score of a cecum and colon 8 weeks after oral TEM cell transfer, assessed by the criteria for the transfer colitis model. (M and N) Representative flow cytometry plots and number of CD3+CD4+ T cells in the cLP. (O and P) Representative flow cytometry plots and numbers of Th1, Th17, and Treg cells in the cLP. Results are shown as mean ± SD (two-way ANOVA) or median (one-way ANOVA). Each dot indicates an individual mouse (N = 4–8). *p < 0.05, **p < 0.01, ***p < 0.001, ****p < 0.0001 by Mann-Whitney U test (B, C, E, F, N, and P), one-way ANOVA followed by Bonferroni post hoc test (G, L, and H), or two-way ANOVA followed by Bonferroni post hoc test (J). See also Figures S6 and S7.
Figure 6.
Figure 6.. Orally Primed T Cells Migrate to the cLP during Colitis
Cervical LNs of anesthetized Kaede Tg mice were exposed to violet light for 1 min. Mice were then monitored for 7 days. Mononuclear cells were isolated from the cLN, mLN, and colonic LP (cLP) on day 0 (immediately after photoconversion) and day 7. The expression of Kaede-Green and Kaede-Red fluorescence protein in CD3+CD4+ T cells was analyzed by FACS. (A) Representative FACS plot data. (B–D) Oral ligatures were inserted into Kaede Tg mice. Photoconversion of cLNs was performed 14 days after ligature insertion. One day after photoconversion, mice were administered 1.5% DSS for 5 days, followed by water for 1 day. The presence of cLN-derived CD4+ T cells (Kaede-Red+) in the LP was analyzed by FACS. Representative flow data (C) and quantification (D) are shown. (E and F) Representative flow cytometry plots and frequencies of Th1, Th17, and Treg cells (gated on Kaede-Green+ or Kaede-Red+ CD3+CD4+ T cells) in the cLP. (G) Kaede-Red+ CD3+CD4+ T cells isolated from ligature–DSS mice or Kaede-Green+ CD3+CD4+ T cells isolated from DSS mice without ligature were adoptively transferred into SPF Rag1−/− mice (2 × 10⁵ cells/mouse, intravenously [i.v.]), respectively. The negative Ctrl group received saline. T cell-transferred Rag1−/− mice were then monitored for 8 weeks. 8 weeks after transfer, Ka SK431 (1 × 10⁹ CFUs/mouse) was orally administered 3 times per week for an additional 4 weeks. Also shown are fecal Lcn2 levels at the indicated days after T cell transfer. (H) Representative images of the colon 12 weeks after transfer. (I) Colonic weight (milligrams per centimeter). (J and K) Representative histological images of the colon (scale bar, 300 μm) and histological score of the colon, assessed by the criteria for the T cell transfer colitis model. (L) Kaede-Red+ CD3+CD4+ T cells isolated from the colon of ligature-DSS mice were adoptively transferred into SPF Rag1−/− mice (as described in G–K). 2 weeks after transfer, Ka SK431 (1 × 10⁹ CFUs/mouse) was administered orally 3 times per week for an additional 4 weeks in the absence or presence of anakinra (50 mg/kg every 2 days, i.p.). (M) Fecal Lcn2 levels at the indicated days after T cell transfer. (N) Colon weight (milligrams per centimeter) 6 weeks after transfer. (O) Histological score of the colon 6 weeks post-transfer, evaluated by the criteria for the T cell transfer colitis model. (P and Q) Representative flow cytometry plots and numbers of CD3+CD4+ T cells in the cLP. (R and S) Representative flow cytometry plots and cell numbers of Th1, Th17, and Treg cells in the cLP. (T) Cytokine production from CD4+ LP cells re-stimulated with αCD3/28 Abs for 24 h. Results are shown as mean ± SD (two-way ANOVA) or median (one-way ANOVA). Each dot indicates an individual mouse (N = 4–8). *p < 0.05, **p < 0.01, ****p < 0.0001 by Mann-Whitney U test (F, N, O, Q, S, and T), one-way ANOVA followed by Bonferroni post hoc test (D, I, and K), or two-way ANOVA followed by Bonferroni post hoc test (L and M).
Figure 7.
Figure 7.. Orally Primed Circulating T Cells Expand in the Gut Colonized by Oral Pathobionts and Aggravate Colitis
(A) Periodontitis was induced in SPF CD45.2 mice (oral ligature [Lig] for 14 days), and then they were surgically connected to SPF CD45.1 congenic mice. After a week, DSS colitis was induced in CD45.1 mice via oral gavage (100 mg/200 μL) daily for 6 days. Ka (109 CFUs) was also supplied to some CD45.1 mice daily for 6 days. On day 6 after DSS/Ka administration, CD45.1 mice were sacrificed and subjected to analyses. (B) Mortality of CD45.1 mice during the DSS/Ka treatment. (C) Representative colon images of CD45.1 mice on day 7 after DSS/Ka (scale bar, 1 cm). (D) Histological score of the colon isolated from CD45.1 mice. (E) Number of CD3+CD4+ T cells in cLP isolated from CD45.1 mice. (F and G) Representative flow cytometry plots and frequencies of CD45.1+ or CD45.2+ (periodontitis mouse-derived) CD3+CD4+ T cells in the cLP isolated from CD45.1 mice. (H and I) Representative flow cytometry plots and frequencies of Th1, Th17, and Treg cells in cLP isolated from CD45.1 mice. (J) Cytokine production from CD3+CD4+ T cells in cLP isolated from CD45.1 mice. T cells were re-stimulated with αCD3/28 Abs for 24 h. Results are shown as median (one-way ANOVA). Each dot indicates an individual mouse (N = 5–9). *p < 0.05, **p < 0.01, ***p < 0.001, ****p < 0.0001 by log rank (Mantel-Cox) test (B) or one-way ANOVA followed by Bonferroni post hoc test (D, E, G, I, and J).

Comment in

References

    1. Abe T, and Hajishengallis G (2013). Optimization of the ligature-induced periodontitis model in mice. J. Immunol. Methods 394, 49–54. - PMC - PubMed
    1. Adachi O, Kawai T, Takeda K, Matsumoto M, Tsutsui H, Sakagami M, Nakanishi K, and Akira S (1998). Targeted disruption of the MyD88 gene results in loss of IL-1- and IL-18-mediated function. Immunity 9, 143–150. - PubMed
    1. Ahern PP, Schiering C, Buonocore S, McGeachy MJ, Cua DJ, Maloy KJ, and Powrie F (2010). Interleukin−23 drives intestinal inflammation through direct activity on T cells. Immunity 33, 279–288. - PMC - PubMed
    1. Amir ED, Davis KL, Tadmor MD, Simonds EF, Levine JH, Bendall SC, Shenfeld DK, Krishnaswamy S, Nolan GP, and Pe’er D (2013). viSNE enables visualization of high dimensional single-cell data and reveals phenotypic heterogeneity of leukemia. Nat. Biotechnol 31, 545–552. - PMC - PubMed
    1. Arfi A, Richard M, Gandolphe C, Bonnefont-Rousselot D, Thérond P, and Scherman D (2011). Neuroinflammatory and oxidative stress phenomena in MPS IIIA mouse model: the positive effect of long-term aspirin treatment. Mol. Genet. Metab 103, 18–25. - PubMed

Publication types

MeSH terms