Estimating the impact of treatment and imaging modalities on 5-year net survival of 11 cancers in 200 countries: a simulation-based analysis
- PMID: 32758462
- PMCID: PMC8020599
- DOI: 10.1016/S1470-2045(20)30317-X
Estimating the impact of treatment and imaging modalities on 5-year net survival of 11 cancers in 200 countries: a simulation-based analysis
Abstract
Background: Accurate survival estimates are important for cancer control planning. Although observed survival estimates are unavailable for many countries, where they are available, wide variations are reported. Understanding the impact of specific treatment and imaging modalities can help decision makers to effectively allocate resources to improve cancer survival in their local context.
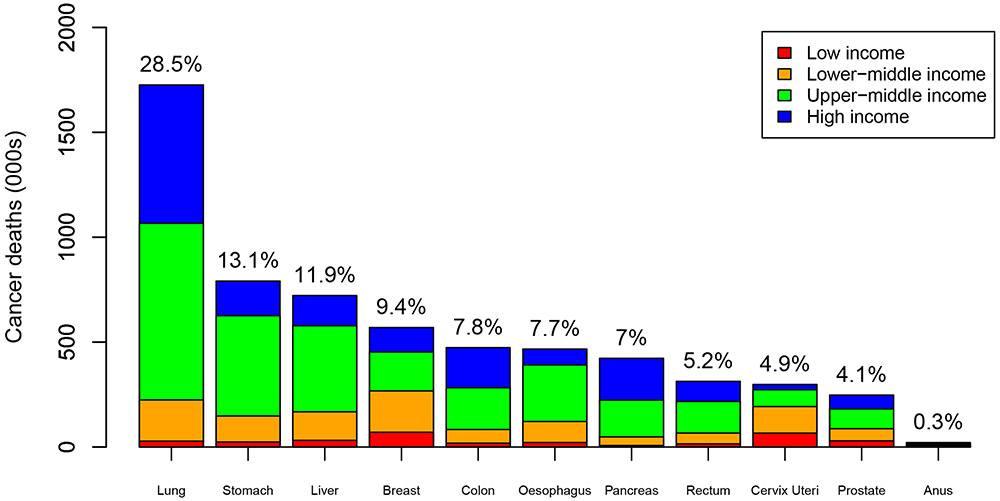
Methods: We developed a microsimulation model of stage-specific cancer survival in 200 countries and territories for 11 cancers (oesophagus, stomach, colon, rectum, anus, liver, pancreas, lung, breast, cervix uteri, and prostate) comprising 60% of global diagnosed cancer cases. The model accounts for country-specific availability of treatment (chemotherapy, surgery, radiotherapy, and targeted therapy) and imaging modalities (ultrasound, x-ray, CT, MRI, PET, single-photon emission CT), as well as quality of care. We calibrated the model to reported survival estimates from CONCORD-3 (which reports global trends in cancer survival in 2000-14). We estimated 5-year net survival for diagnosed cancers in each country or territory and estimated potential survival gains from increasing the availability of individual treatment and imaging modalities, and more comprehensive packages of scale-up of these interventions. We report the mean and 95% uncertainty intervals (UIs) for all outcomes, calculated as the 2·5 and 97·5 percentiles of the simulation results.
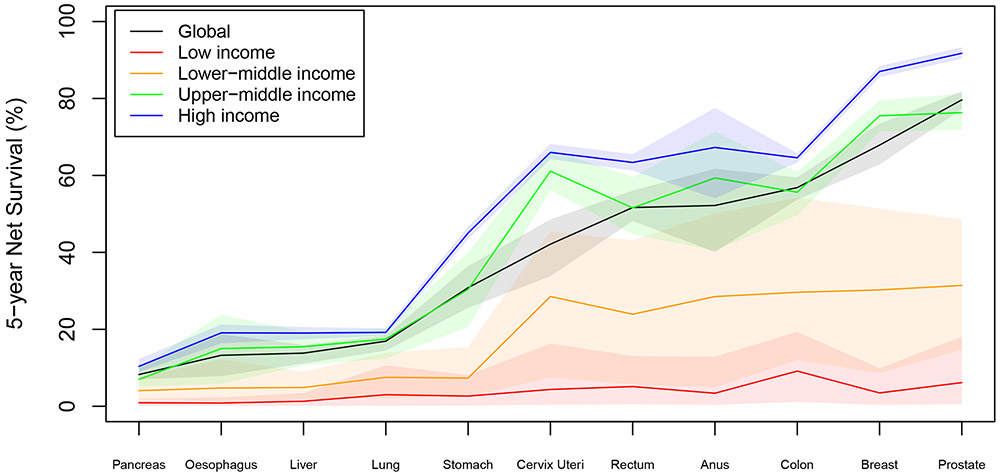
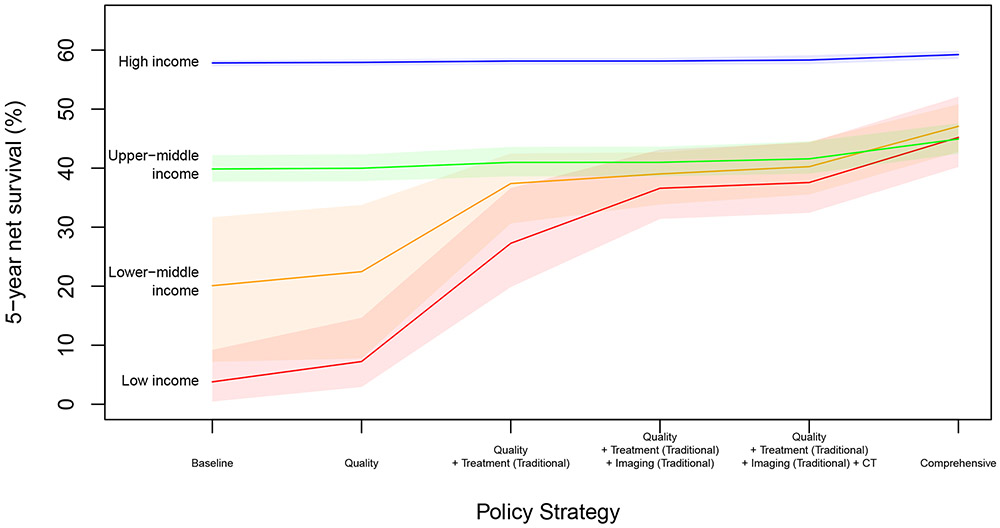
Findings: The estimated global 5-year net survival for all 11 cancers combined is 42·6% (95% uncertainty interval 40·3-44·3), with survival in high-income countries being an average of 12 times (range 4-17) higher than that in low-income countries. Expanding availability of surgery or radiotherapy or improving quality of care would yield the largest survival gains in low-income (2·5-3·4 percentage point increase in survival) and lower-middle-income countries (2·4-6·1 percentage point increase), whereas upper-middle-income and high-income countries are more likely to benefit from improved availability of targeted therapy (0·7 percentage point increase for upper-middle income and 0·4 percentage point increase for high income). Investing in medical imaging will also be necessary to achieve substantial survival gains, with traditional modalities estimated to provide the largest gains in low-income settings, while MRI and PET would yield the largest gains in higher-income countries. Simultaneous expansion of treatment, imaging, and quality of care could improve 5-year net survival by more than ten times in low-income countries (3·8% [95% UI 0·5-9·2] to 45·2% [40·2-52·1]) and could more than double 5-year net survival in lower-middle-income countries (20·1% [7·2-31·7] to 47·1% [42·8-50·8]).
Interpretation: Scaling up both treatment and imaging availability could yield synergistic survival gains for patients with cancer. Expanding traditional modalities in lower-income settings might be a feasible pathway to improve survival before scaling up more modern technologies.
Funding: Harvard T H Chan School of Public Health.
Copyright © 2020 Elsevier Ltd. All rights reserved.
Conflict of interest statement
Declaration of interests
We declare no competing interests. HH receives annual compensation for serving on the Board of Directors of Ion Beam Applications (IBA).
Figures
References
-
- Bray F, Ferlay J, Soerjomataram I, et al. Global cancer statistics 2018: GLOBOCAN estimates of incidence and mortality worldwide for 36 cancers in 185 countries. CA Cancer J Clin 2018; 68: 394–424. - PubMed
-
- Torre LA, Siegel RL, Ward EM, Jemal A. Global cancer incidence and mortality rates and trends – an update. Cancer Epidemiol Biomarkers Prev 2016; 25(1): 16–27. - PubMed
-
- Ward ZJ, Yeh JM, Bhakta N, Frazier AL, Girardi F, Atun R. Global childhood cancer survival estimates and priority-setting: a simulation-based analysis. Lancet Oncol 2019; 20(7):972–983. - PubMed
Publication types
MeSH terms
Grants and funding
LinkOut - more resources
Full Text Sources
Medical