

Simulating COVID-19 in a university environment
- PMID: 32758501
- PMCID: PMC7398032
- DOI: 10.1016/j.mbs.2020.108436
Simulating COVID-19 in a university environment
Abstract
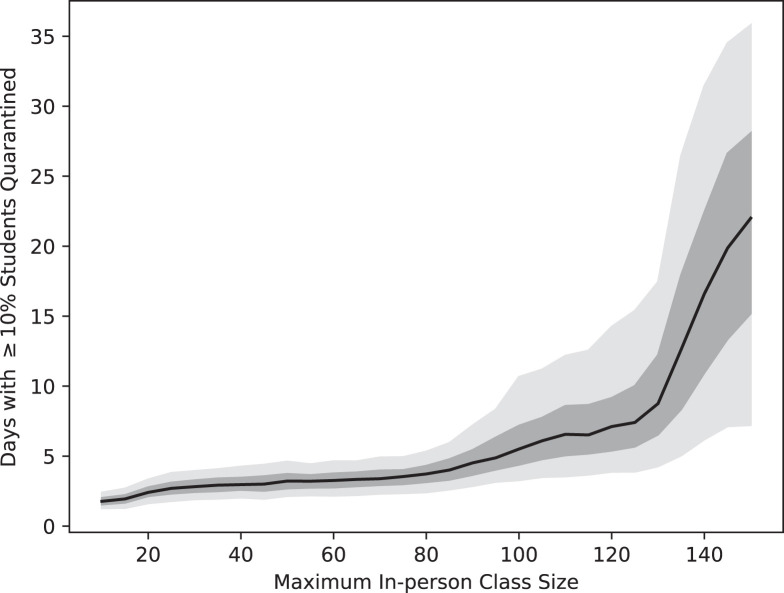
Residential colleges and universities face unique challenges in providing in-person instruction during the COVID-19 pandemic. Administrators are currently faced with decisions about whether to open during the pandemic and what modifications of their normal operations might be necessary to protect students, faculty and staff. There is little information, however, on what measures are likely to be most effective and whether existing interventions could contain the spread of an outbreak on campus. We develop a full-scale stochastic agent-based model to determine whether in-person instruction could safely continue during the pandemic and evaluate the necessity of various interventions. Simulation results indicate that large scale randomized testing, contact-tracing, and quarantining are important components of a successful strategy for containing campus outbreaks. High test specificity is critical for keeping the size of the quarantine population manageable. Moving the largest classes online is also crucial for controlling both the size of outbreaks and the number of students in quarantine. Increased residential exposure can significantly impact the size of an outbreak, but it is likely more important to control non-residential social exposure among students. Finally, necessarily high quarantine rates even in controlled outbreaks imply significant absenteeism, indicating a need to plan for remote instruction of quarantined students.
Keywords: Agent-based modeling; COVID-19; Computational epidemiology; Coronavirus; Epidemics; Higher education; Post-secondary education; SARS-CoV-2.
Copyright © 2020 Elsevier Inc. All rights reserved.
Conflict of interest statement
Declaration of Competing Interest The authors declare that they have no known competing financial interests or personal relationships that could have appeared to influence the work reported in this paper.
Figures
References
-
- Snyder T., de Brey C., Dillow S. National Center for Education Statistics, Institute of Education Sciences, U.S. Department of Education; Washingnton, D.C.: 2019. Digest of Education Statistics 2018 (NCES 2020-009): Tech. Rep.
-
- Paxson C. 2020. College Campuses Must Reopen in the Fall. Here’s How We Do It. New York Times, April 26, 2020. https://www.nytimes.com/2020/04/26/opinion/coronavirus-colleges-universi.... (Accessed 19 May 2020)
-
- Snyder S. 2020. Homeless and hungry college students will face greater challenges because of the coronavirus. The Philadelphia Inquirer, April 28, 2020. https://www.inquirer.com/health/coronavirus/hungry-homeless-college-stud.... (Accessed 19 May 2020)
-
- Maloney E.J., Kim J. 15 fall scenarios. Insider Higher Ed. 2020 https://www.insidehighered.com/digital-learning/blogs/learning-innovatio.... (Accessed 12 May 2020)
MeSH terms
LinkOut - more resources
Full Text Sources
Miscellaneous
