. 2020 Aug 18;117(33):20244-20253.
doi: 10.1073/pnas.1922248117. Epub 2020 Aug 5.

Geometric renormalization unravels self-similarity of the multiscale human connectome

Affiliations

Geometric renormalization unravels self-similarity of the multiscale human connectome

Muhua Zheng et al. Proc Natl Acad Sci U S A. .

Abstract

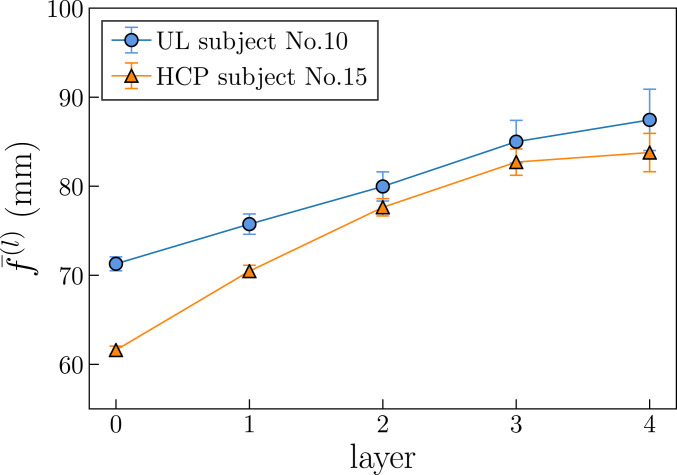
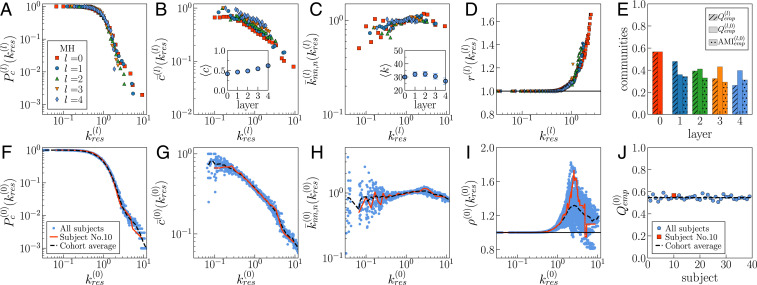
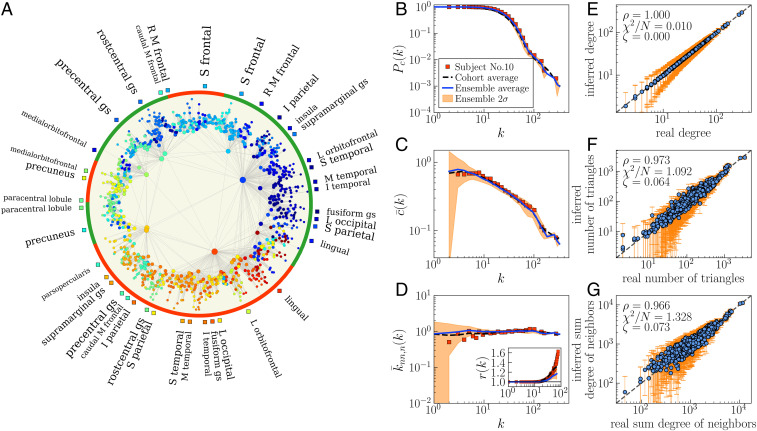
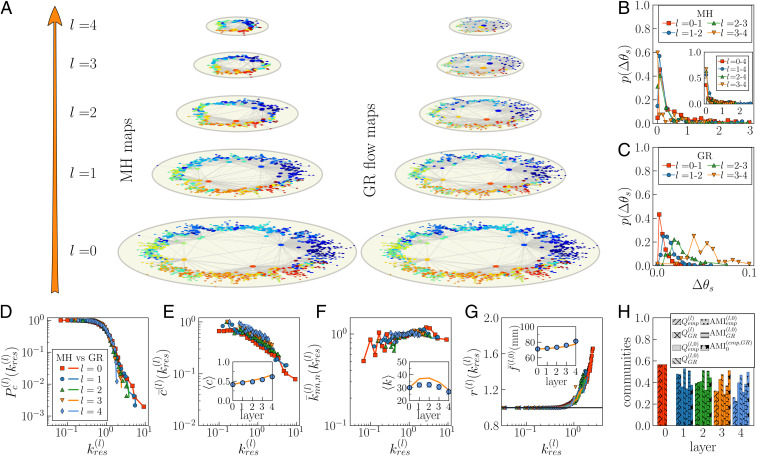
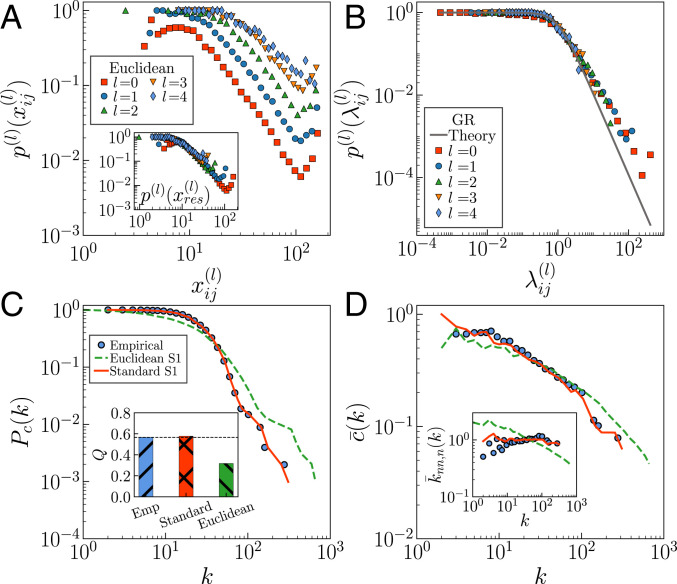
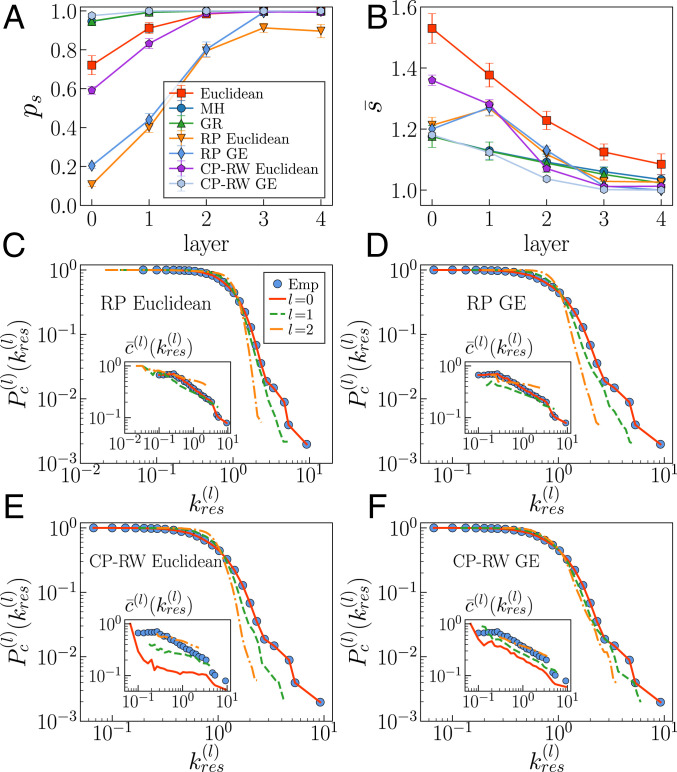
Structural connectivity in the brain is typically studied by reducing its observation to a single spatial resolution. However, the brain possesses a rich architecture organized over multiple scales linked to one another. We explored the multiscale organization of human connectomes using datasets of healthy subjects reconstructed at five different resolutions. We found that the structure of the human brain remains self-similar when the resolution of observation is progressively decreased by hierarchical coarse-graining of the anatomical regions. Strikingly, a geometric network model, where distances are not Euclidean, predicts the multiscale properties of connectomes, including self-similarity. The model relies on the application of a geometric renormalization protocol which decreases the resolution by coarse-graining and averaging over short similarity distances. Our results suggest that simple organizing principles underlie the multiscale architecture of human structural brain networks, where the same connectivity law dictates short- and long-range connections between different brain regions over many resolutions. The implications are varied and can be substantial for fundamental debates, such as whether the brain is working near a critical point, as well as for applications including advanced tools to simplify the digital reconstruction and simulation of the brain.

Keywords: human brain; multiscale structure; network geometry; neuroscience; renormalization.


Conflict of interest statement

The authors declare no competing interest.

Figures

Fig. 1.
Fig. 1.
Average fiber length of connections in MH connectomes at different resolutions for UL subject no. 10 and HCP subject no. 15 (see SI Appendix, Figs. S3 and S20 for all subjects). Error bars indicate the two-SE interval around the mean.
Fig. 2.
Fig. 2.
Self-similarity of the MH connectome across different resolutions. (AE) Results for UL subject no. 10. (A) Complementary cumulative degree distribution Pc(l)(kres(l)). (B) Degree-dependent clustering coefficient c¯(l)(kres(l)). (B, Inset) Average clustering coefficient c across layers. (C) Normalized average degree of nearest neighbors k¯nn,n(l)(kres(l)). (C, Inset) Average degree k across layers. In B and C, Insets, error bars indicate the two-SE interval around the mean; note that some of the bars are smaller than symbols. (D) Rich-club coefficient r(l)(kres(l)) for low and intermediate values of the rescaled threshold degrees. (E) Community structure. Q(l) is the modularity in layer l, Q(l,0) is the modularity that the community structure of layer l induces in layer 0, and AMI(l,0) is the adjusted mutual information between the latter and the community partition directly detected in layer 0; Materials and Methods. The subscript emp indicates the empirical MH connectome. (FJ) Variability of topological properties in the UL dataset. Blue symbols correspond to the properties of layer 0 for each of the 40 subjects. The red lines correspond to UL subject no. 10. The black dashed line represents the average value across the 40 subjects in the cohort. Degrees have been rescaled by the average degree of the corresponding layer kres(l)=k(l)/k(l).
Fig. 3.
Fig. 3.
Hyperbolic connectome map of UL subject no. 10. (A) Embedding of l=0 in the hyperbolic disk. Nodes are colored according to the 82 coarse-grained regions in layer l=4. Only links with connection probability greater than 0.5 are shown. The size of each node is proportional to the logarithm of its degree, and the font size of the names of brain regions is proportional to the logarithm of the number of nodes in the regions (only regions with more than 10 nodes are shown). Red and green frames indicate left and right hemispheres, respectively. A, anterior; I, inferior; L, lateral; M, middle; R, rostral; S, superior; gs, gyrus. (BD) Network properties of l=0 compared to the model predictions, complementary cumulative degree distribution (B), degree-dependent clustering coefficient (C), average degree of nearest neighbors (D), and rich-club coefficient (D, Inset). Red symbols correspond to subject no. 10, and the black dashed lines correspond to the group average across the 40 subjects in the UL dataset. The blue lines correspond to the average value obtained from 100 synthetic networks generated with the S1 model using the coordinates and parameters inferred by Mercator (31), and the orange regions show the 2σ CI around the expected value. (EG) Comparison of the predictions of the S1 model (average over the ensemble of 100 synthetic networks) with the actual values for degrees (E), number of triangles attached to each node (F), and sum of degrees of neighbors (G). Error bars show the 2σ CI around the average values. Statistical tests for the goodness of fit—Pearson correlation coefficient ρ, χ2 test normalized by the number of nodes N, and ζ score—are reported in each subfigure.
Fig. 4.
Fig. 4.
Hyperbolic maps of the MH connectome and the GR flow. (A) The bottom layer l=0 corresponds to the hyperbolic map of the highest-resolution connectome for subject no. 10. (A, Left) The upper maps are obtained by embedding independently each layer in the MH connectome. The different colors are given to the nodes according to the 82 coarse-grained regions defined in layer l=4. (A, Right) In the GR flow, the maps are obtained by renormalizing layer l=0. A supernode in layer l>0 inherits the color of its subnode in layer l1 positioned at its left in the similarity space (similar results are obtained if the color of the node on the right was chosen, or if the color was chosen at random between the two subnodes). For visualization purposes, we only represent links if their probability of connection according to Eq. 1 is larger than 0.5. (B and C). Distribution p(Δθs) of the average angular separation between subnodes of coarse-grained supernodes from one layer to the next in MH and GR, respectively. (B, Inset) The distribution p(Δθs) of subnodes in layer l that correspond to a same supernode in layer 4 of MH. (DH) Comparison of topological properties in the empirical MH connectome of UL subject no. 10 (symbols) and GR predictions (lines). (D) Complementary cumulative degree distribution Pc(l)(kres(l)). (E) Degree-dependent clustering coefficient c¯(l)(kres(l)). (E, Inset) Average clustering coefficient c across layers. (F) Degree–degree correlations k¯nn,n(l)(kres(l)). (F, Inset) Average degree k across layers. (G) Rich-club coefficient r(l)(kres(l)) for low and intermediate values of the rescaled threshold degrees. (G, Inset) Average fiber length f¯(l,0) in layer 0 of links outside supernodes in layer l, where supernodes are defined by the anatomical coarse-graining in the MH connectome or by the coarse-graining in the similarity dimension in the GR case. In EG, Insets, error bars show the 2σ CI around the mean; the bars may be smaller than the symbol. (H) Community structure of the multiscale connectomes. The subscripts {emp,GR} indicate the empirical MH connectome and the GR shell, respectively. AMI0(emp,GR) is the adjusted mutual information between topological communities in the empirical MH connectomes at each layer and the GR flow measured in their projection over layer 0.
Fig. 5.
Fig. 5.
Empirical versus theoretical probability of connection. Results for UL subject no. 10 are shown. (A) Empirical connection probabilities p(l)(xij(l)) as a function of the Euclidean distances xij(l) in the MH connectome. A, Inset shows the empirical connection probabilities p(l)(xres(l)) as a function of rescaled Euclidean distances xres(l)=x(l)/a(l) with a(l)=[1.0,1.5,2.6,3.8,4.0]. (B) Empirical versus theoretical connection probability p(l)(λij(l)), Eq. 1, in the GR shell. (C) Complementary cumulative degree distribution Pc(k). (C, Inset) Modularity Q, as measured by the Louvain method, is shown. (D) Degree-dependent clustering coefficient c¯(k). (D, Inset) Average degree of neighbors k¯nn,n(k). The filled symbols correspond to the empirical connectome of subject no. 10. Green dashed lines are generated by using the S1 model with Euclidean distances and parameters β=2.75 and μ=0.0117. Red lines correspond to the standard S1 model (β=1.96,μ=0.0104).
Fig. 6.
Fig. 6.
Navigability of the MH connectomes and the GR shells at different resolutions. (A and B) Average success rate (A) and average stretch (B) for all UL subjects. Navigation performance was benchmarked against four different random null models. The error bars show the 2σ CI around the expected values. (CF) The loss of self-similarity in the four ensembles of random null models can be seen through the loss of self-similarity of their complementary cumulative degree distribution and degree-dependent clustering coefficient (Insets) (see SI Appendix, Figs. S18 and S19 for more results). For each null model, we generated 100 multiscale surrogates for UL subject no. 10.

References

    1. Bullmore E., Sporns O., Complex brain networks: Graph theoretical analysis of structural and functional systems. Nat. Rev. Neurosci. 10, 186–198 (2009). - PubMed
    1. Rubinov M., Sporns O., Complex network measures of brain connectivity: Uses and interpretations. Neuroimage 52, 1059–1069 (2010). - PubMed
    1. Fornito A., Zalesky A., Bullmore E., Fundamentals of Brain Network Analysis (Academic Press, New York, NY, 2016).
    1. Watts D. J., Strogatz S. H.. Collective dynamics of “small-world” networks. Nature 393, 440–442 (1998). - PubMed
    1. Sporns O., Chialvo D. R., Kaiser M., Hilgetag C. C., Organization development and function of complex brain networks. Trends Cognit. Sci. 8, 418–425 (2004). - PubMed

Publication types

LinkOut - more resources