. 2020 Aug 18;117(33):19854-19865.
doi: 10.1073/pnas.1911532117. Epub 2020 Aug 5.

Inducers of the endothelial cell barrier identified through chemogenomic screening in genome-edited hPSC-endothelial cells

Affiliations

Inducers of the endothelial cell barrier identified through chemogenomic screening in genome-edited hPSC-endothelial cells

Filip Roudnicky et al. Proc Natl Acad Sci U S A. .

Erratum in

Abstract

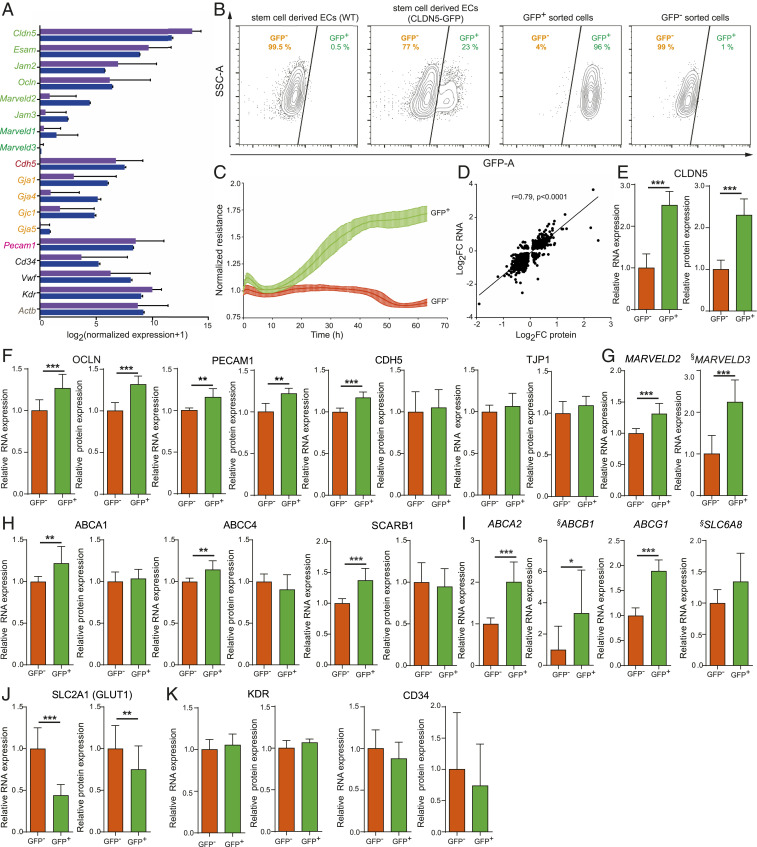
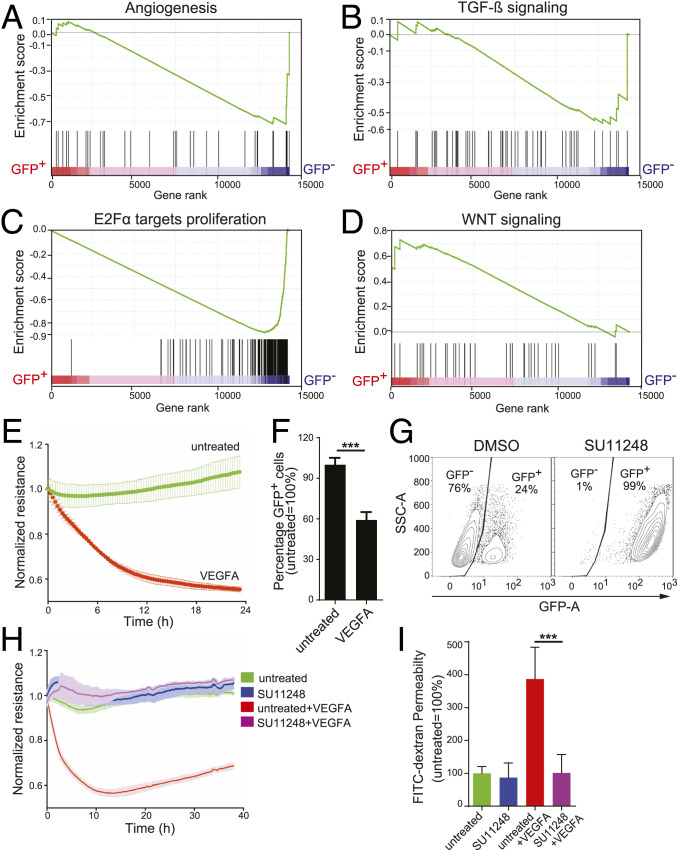
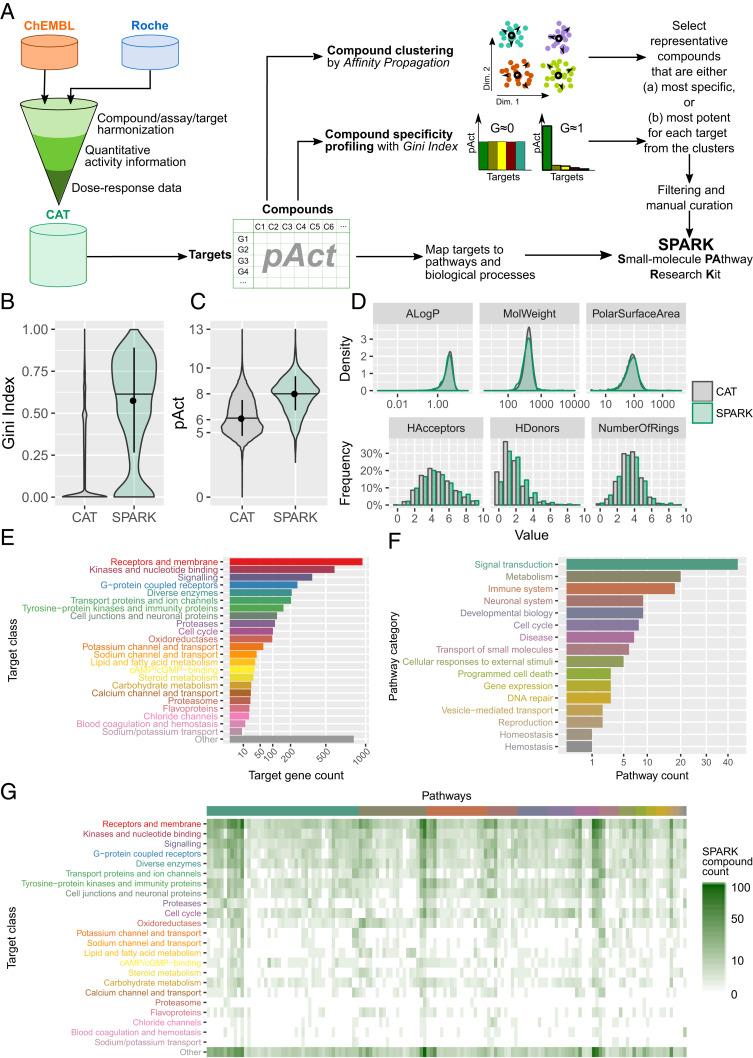
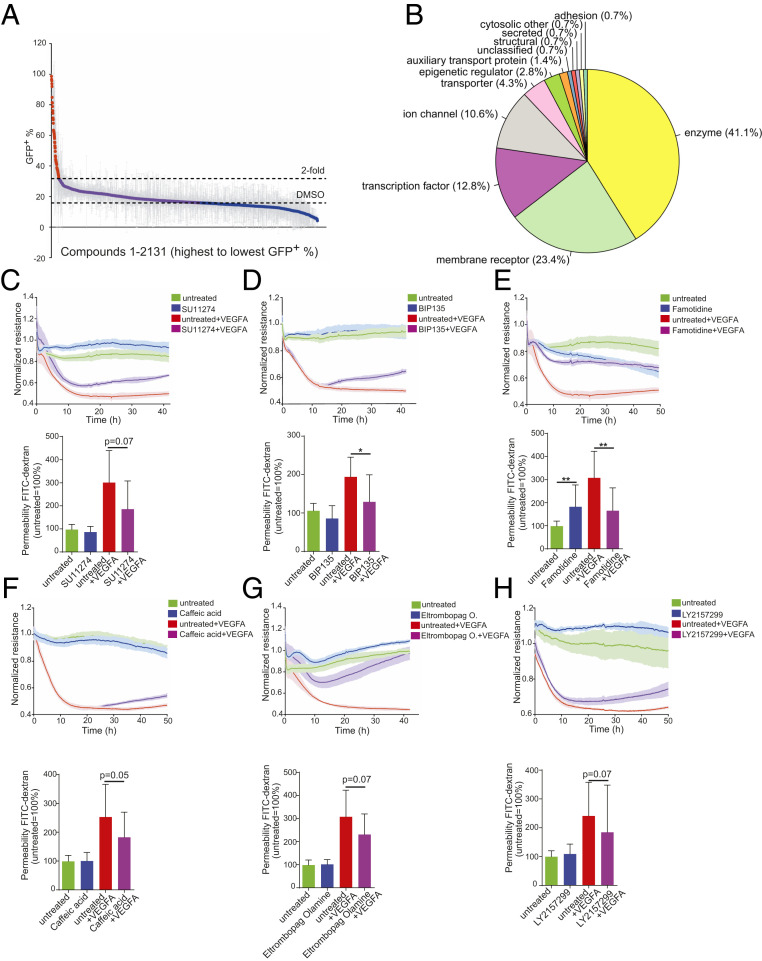
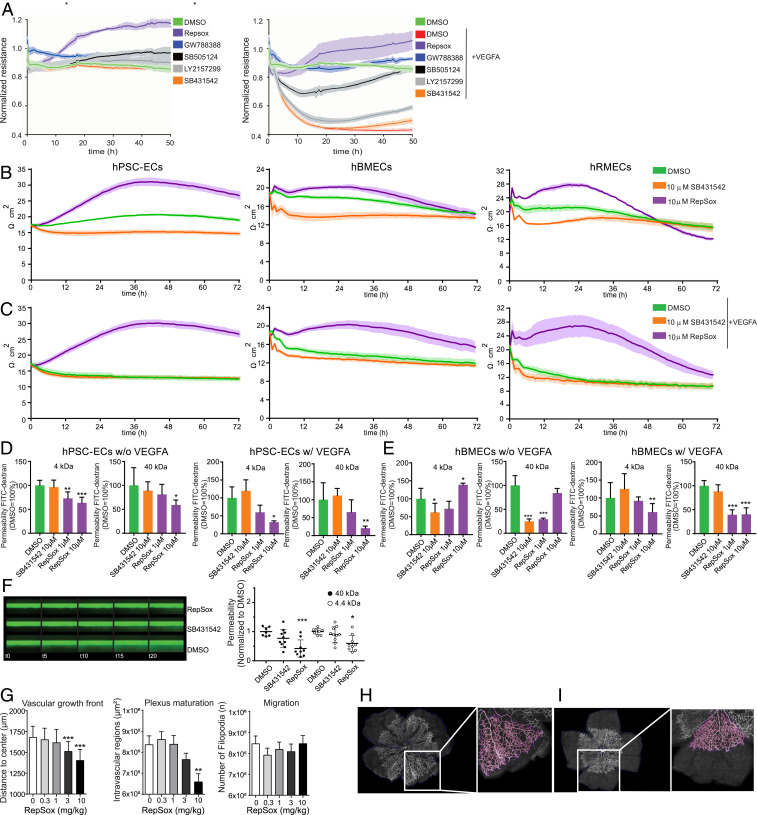
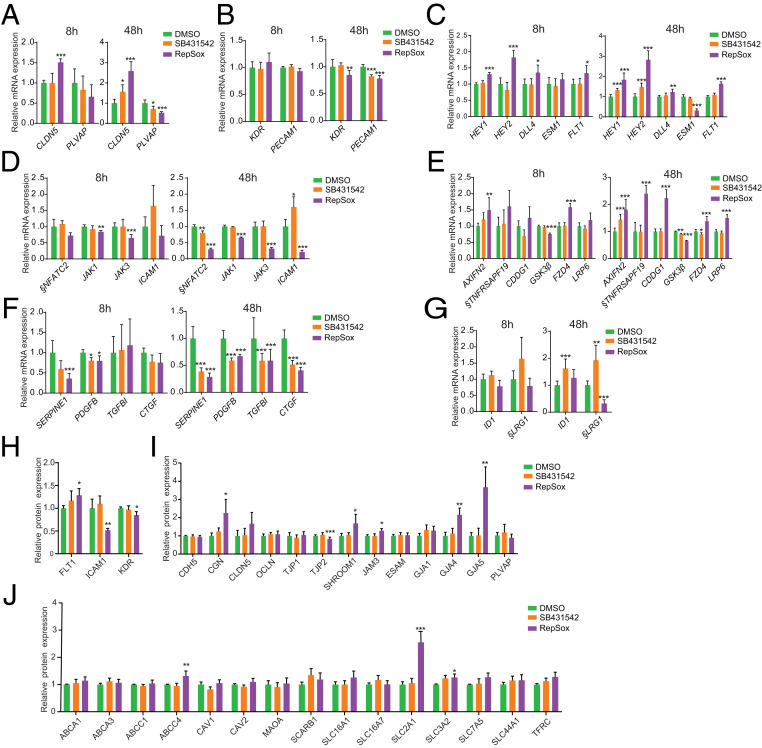
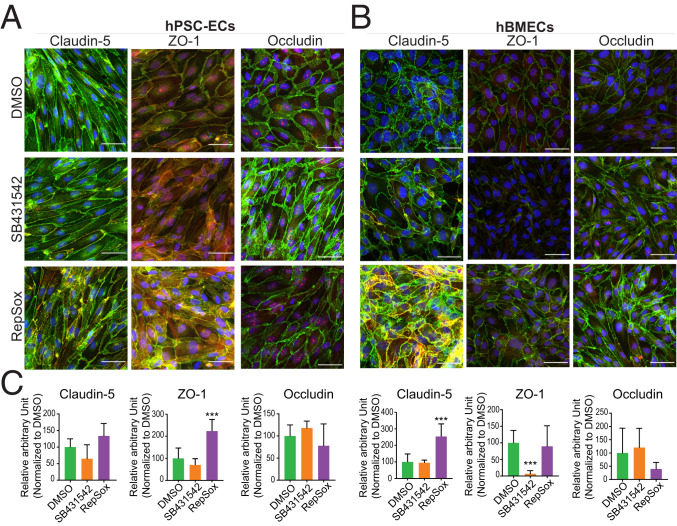
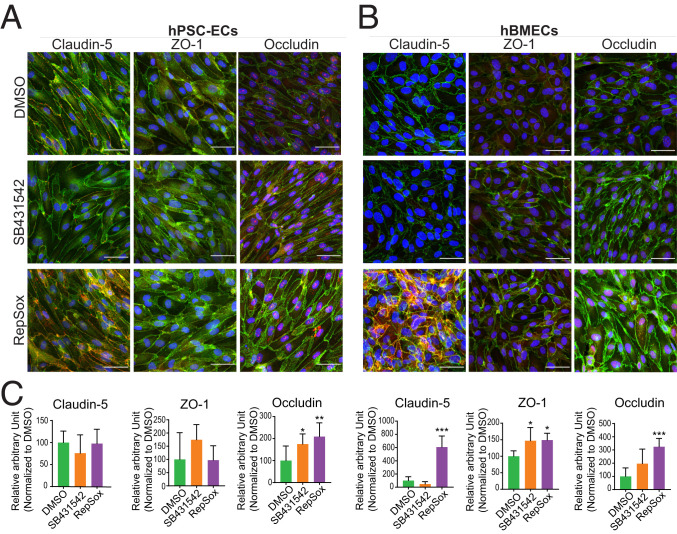
The blood-retina barrier and blood-brain barrier (BRB/BBB) are selective and semipermeable and are critical for supporting and protecting central nervous system (CNS)-resident cells. Endothelial cells (ECs) within the BRB/BBB are tightly coupled, express high levels of Claudin-5 (CLDN5), a junctional protein that stabilizes ECs, and are important for proper neuronal function. To identify novel CLDN5 regulators (and ultimately EC stabilizers), we generated a CLDN5-P2A-GFP stable cell line from human pluripotent stem cells (hPSCs), directed their differentiation to ECs (CLDN5-GFP hPSC-ECs), and performed flow cytometry-based chemogenomic library screening to measure GFP expression as a surrogate reporter of barrier integrity. Using this approach, we identified 62 unique compounds that activated CLDN5-GFP. Among them were TGF-β pathway inhibitors, including RepSox. When applied to hPSC-ECs, primary brain ECs, and retinal ECs, RepSox strongly elevated barrier resistance (transendothelial electrical resistance), reduced paracellular permeability (fluorescein isothiocyanate-dextran), and prevented vascular endothelial growth factor A (VEGFA)-induced barrier breakdown in vitro. RepSox also altered vascular patterning in the mouse retina during development when delivered exogenously. To determine the mechanism of action of RepSox, we performed kinome-, transcriptome-, and proteome-profiling and discovered that RepSox inhibited TGF-β, VEGFA, and inflammatory gene networks. In addition, RepSox not only activated vascular-stabilizing and barrier-establishing Notch and Wnt pathways, but also induced expression of important tight junctions and transporters. Taken together, our data suggest that inhibiting multiple pathways by selected individual small molecules, such as RepSox, may be an effective strategy for the development of better BRB/BBB models and novel EC barrier-inducing therapeutics.

Keywords: CLDN5; chemogenomic library; endothelial cell barrier; genome editing; human pluripotent stem cell-derived endothelial cells.


Conflict of interest statement

Competing interest statement: This study is supported by F. Hoffmann-La Roche Ltd. F. Roudnicky, J.D.Z., B.K.K., N.J.P., Y.L., L.S.-P., H.R., P.S., S.G., M.L., S.U., F. Revelant, O.E., G.S., V.K., K.C., M.T., B.B., M.G., C.P., M.B., C.A.M., and P.D.W. are employees of F. Hoffmann-La Roche. L.D.G. and Z.M. are employees of Genentech Inc. F. Roudnicky, N.J.P., and V.K. were supported by a Roche postdoctoral fellowship. B.K.K. was supported by a Roche doctoral fellowship. C.A.C. is a founder and chief scientific officer of Sana Biotechnology. Neither a reagent nor any funding from Sana Biotechnology was used in this study.

Figures

Fig. 1.
Fig. 1.
Characterization of hPSC-derived endothelial cells carrying a CLDN5-tagged GFP reporter. (A) RNA-seq of ex vivo isolated ECs from the BBB with normalized expression for proteins involved in EC junction formation indicated as follows: purple bars represent data from Vanlandewijck et al. (8); blue bars represent data from Zhang et al. (7). For gene names, the color indicates the cellular function: tight junctions (green), adherens junctions (red), gap junctions (orange), adhesion molecule (pink), endothelial cell markers (black), and housekeeping gene (gray). Mean normalized log2 expression was plotted with ±SD. (B) FACS analysis of hPSC-derived ECs, either WT or CLDN5-GFP hPSC-ECs (one clone), sorted by FACS into CLDN5-GFP+ or CLDN5-GFP population (Left Two Panels). The Right Two Panels represent FACS analysis of CLDN5-GFP reporter cells separated into either the CLDN5-GFP+ population or the CLDN5-GFP population. (C) ECIS of CLDN5-GFP hPSC-ECs sorted into CLDN5-GFP+ and CLDN5-GFP populations measured in real time. (D) Spearman correlation of significantly up- or down-regulated proteins and their respective mRNAs as measured by mass spectrometry and RNA-seq. (EG) CLDN5-GFP hPSC-ECs sorted into CLDN5-GFP+ and CLDN5-GFP populations were analyzed for relative overall mRNA and protein expression: (E) CLDN5 and (F) RNA-seq and mass spectrometry data of tight junction-related proteins including OCLN, PECAM1, CDH5, and TJP1. (G) RNA-seq data for MARVELD2 and MARVELD3. (H) RNA-seq and mass spectrometry data of transporter-related proteins including ABCA1, ABCC4, and SCARB1 and (I) ABCA2, ABCB1, ABCG1, and SLC6A8. (J) RNA-seq and mass spectrometry data for SLC2A1 (GLUT1). (K) KDR and CD34 expression. §, The low RPKM average values for MARVELD3, ABCB1, and SLC6A8 (average RPKM < 1) (Dataset S15). Columns show means ± SD. *FDR <0.05, **FDR <0.01, ***FDR <0.001.
Fig. 2.
Fig. 2.
The GFP+ population of CLDN5-GFP reporter ECs has both the gene expression signature and functional response of endothelial cell barriers. (AD) Gene set enrichment analysis (GSEA) enrichment plots of CLDN5-GFP+ or CLDN5-GFP populations of CLDN5-GFP hPSC-ECs for pathways relevant to barrier functions: (A) angiogenesis, (B) TGF-β, (C) E2Fα proliferation, and (D) Wnt signaling. The enrichment scores (ESs) are plotted at the top of each panel, and a value of the ranking metric throughout the list of ranked genes is depicted at the bottom of each panel (from left to right). Genes were ranked by the product of log2-FC and negative log of FDR value. (E) The CLDN5-GFP+ hPSC-EC population was stimulated with 50 ng/mL VEGFA, and ECIS was measured in real time. (F) After 48 h of VEGFA treatment, the relative percent of CLDN5-GFP+ hPSC-ECs was measured using FACS. (GI) CLDN5-GFP hPSC-ECs were treated with the tyrosine kinase inhibitor SU11248 (at 5 μM for 48 h) or with a DMSO control and analyzed as follows: (G) The percentage of CLDN5-GFP+ hPSC-ECs was quantified using FACS, y axis represents side-scatter area; (H) impedance was measured in real time; and (I) FITC-dextran permeability was measured. Columns are means ± SD. The permeability assays and impedance measurements were performed as three independent experiments with at least three replicates. ***P < 0.001.
Fig. 3.
Fig. 3.
Design and characterization of SPARK, a chemogenomic library. (A) A schematic of the workflow used to establish the CAT database and construct the SPARK library. (BD) A comparison of the compounds in the CAT database and in the SPARK library in terms of (B) Gini Index values, (C) pAct values against primary targets, and (D) profiles of molecular descriptors, which include: ALogP, an estimate of the molecular hydrophobicity (lipophilicity) defined as the logarithm of the 1-octanol/water partition coefficient; MolWeight, molecular weight (in daltons); PolarSurfaceArea, defined as the surface sum over all polar atoms; HAcceptors, proton acceptors; HDonors, proton donors; NumberOfRings, number of aromatic rings. (E) Protein classes targeted by compounds in the SPARK library (filtered by median of pAct ≥ 6) as defined by UniProt keywords. Bars show the count of unique target genes in each class. (F) Biological pathway categories associated with target genes of SPARK compounds, defined by a combination of Reactome pathways, KEGG pathways, and GO BP terms, and consolidated by a heuristic fuzzy partition algorithm. Bars show the count of unique pathways in each category. (G) A heat map of SPARK compounds that target proteins of a given class (in rows) and within a given biological pathways (in columns). Target classes follow the same order as in E. Pathways are organized by categories in the same order as in F. Within each category, pathways are ordered by hierarchical clustering.
Fig. 4.
Fig. 4.
Identification of compounds from the SPARK library that induce endothelial cell barrier resistance. (A) Compounds from the SPARK library, used at 5 µM, were tested in duplicate, and the percent of CLDN5-GFP+ hPSC-ECs was evaluated 48 h posttreatment. Each dot represents a distinct compound, and those plotted in red induced greater than twofold mean induction of CLDN5-GFP+ hPSC-ECs over the DMSO control. (B) The 62 compounds that induced a greater than twofold induction of CLDN5-GFP+ hPSC-ECs mapped to several target classes, as indicated. (CH) Functional evaluation (Upper, ECIS analysis; Lower, FITC-dextran permeability assay) of representative compounds from differing target classes: (C) SU11274, (D) BIP135, (E) Famotidine, (F) Caffeic acid, (G) Eltrombopag olamine, (H) LY2157299. Columns are means ± SD. The permeability assays and impedance measurements were performed as three independent experiments with at least three replicates. **P < 0.01, *P < 0.05.
Fig. 5.
Fig. 5.
Functional barrier evaluation after treatment with RepSox and SB431542. (A) CLDN5-GFP hPSC-ECs were analyzed by ECIS in the presence and absence of five different TGF-β pathway inhibitors without (Left Graph) or with (Right Graph) the addition of VEGFA. Compounds are shown based on capability to induce barrier, top to bottom. (B) The absolute TEER values (Ω∙cm2) after treatment with DMSO or 10 µM SB431542 or 10 µM RepSox on (Left) hPSC-ECs, (Middle) hBMECs, and (Right) hRMECs. (C) The absolute TEER (Ω∙cm2) values with cotreatment of VEGFA and compounds, DMSO, 10 µM SB431542, or 10 µM RepSox on (Left) hPSC-ECs, (Middle) hBMECs, and (Right) hRMECs. All TEER assays were performed as at least three independent experiments with three replicates for each condition. (D and E) The FITC-dextran (4 and 40 kDa) permeability assay. (D, Left) hPSC-ECs treated with DMSO, 10 µM SB431542, or 10 µM RepSox and (D, Right) cotreated with VEGFA and DMSO, 10 µM SB431542, or 1 and 10 µM RepSox. (E, Left) hBMECs treated with DMSO, 10 µM SB431542, or 1 and 10 µM RepSox and (E, Right) cotreated with VEGFA and DMSO, 10 µM SB431542, or 1 and 10 µM RepSox. (F) The barrier on-a-chip assay with hRMECs. (Left) Barrier integrity assay in hRMEC: 40-kDa FITC-dextran solution is perfused in the endothelial tube, and leakage in the adjacent channel is monitored over the course of 20 min. (Right) apparent permeability of hRMEC to 40 kDa and 4.4 kDa dextran. Results represent means ± SD and were normalized to DMSO control. (G) Segmentation and quantification of vascular sprouting in a flat mounted newborn mouse retina after treatment with RepSox in a dose–response. (Left) The radial expansion of the vascular front was measured as distance from the center to the peripheral retinal. (Middle) Plexus maturation was calculated as the mean area of intravascular lesions representing the primitive plexus area. (Right) Migration was estimated based on the number of filopodia. (H and I) Representative images of segmented retinal flat mounts (pink) computationally traced vessels in the retina: (H) control treated and (I) treated with 3 mg/kg RepSox, respectively with magnification at 20×. Columns are means ± SD. *P < 0.05, **P < 0.01, ***P < 0.001.
Fig. 6.
Fig. 6.
Molecular evaluation of expression of barrier integrity-related molecules after treatment with RepSox and SB431542. (AG) RNA-seq analysis after 8 or 48 h of treatment with TGF-β pathway inhibitors (SB431542 and RepSox) for (A) CLDN5 and PLVAP, (B) EC markers (KDR and PECAM1), (C) Sprouting/Notch genes (HEY1, HEY2, DLL4, ESM1, and FLT1). (D) Inflammatory genes (NFATC2, JAK1, JAK3, and ICAM1). (E) Wnt signaling genes (AXIN2, TNFRSF19, APCDD1, GSK3β, FZD4, LRP6). (F) TGFBR1 signaling genes (ALK5, SERPINE1, PDGFB, TGFBI, and CTGF) and (G) ALK1 signaling genes (ID1, and LRG1). (HJ) Mass spectrometry analysis with TGF-β pathway inhibitors (SB431542 and RepSox) for (H) inflammatory response-related proteins (FLT1, ICAM1, and KDR), and for (I) endothelial barrier-related proteins (CDH5, CGN, CLDN5, OCLN, TJP1, TJP2, SHROOM1, JAM3, ESAM, GJA1, GJA4, GJA5, and PLVAP). Also for (J) the BRB/BBB transporter-related proteins (ABCA1, ABCA3, ABCC1, ABCC4, CAV1, CAV2, MAOA, SCARB1, SLC16A1, SLC16A7, GLUT1 [SLC2A1], SLC3A2, SLC7A5, SLC44A1, and TFRC). §, The low RPKM average values for NFATC2, TNFRSF19, and LRG1 (average RPKM < 1) (Dataset S15). Columns are means ± SD. *FDR <0.05, **FDR < 0.01, ***FDR < 0.001.
Fig. 7.
Fig. 7.
Confocal imaging of the tight junction proteins treated with DMSO, SB431542, or RepSox. The immunocytochemistry images for each tight junction proteins in (A) hPSC-ECs and (B) hBMECs. The proteins Claudin-5, ZO-1, and Occludin in red channel, and VE-Cadherin in green, and DAPI in blue. (C) The respective quantification of the fluorescence intensity of the individual proteins (Claudin-5, ZO-1, and Occludin) in the area of interest where Claudin-5, ZO-1, or Occludin signal colocalized with VE-Cadherin. Columns are means ± SD. (Scale bars: 50 μm.) The imaging was performed with at least three replicates. ***P < 0.001.
Fig. 8.
Fig. 8.
Confocal imaging of the tight junction proteins cotreated with VEGFA and DMSO, SB431542, or RepSox. The immunocytochemistry images for each tight junction proteins with cotreatment of compounds and VEGFA in (A) hPSC-ECs and (B) hBMECs. The proteins Claudin-5, ZO-1, and Occludin in red channel, and VE-Cadherin in green, and DAPI in blue. (C) The respective quantification of the fluorescence intensity of the individual proteins (Claudin-5, ZO-1, and Occludin) in the area of interest where Claudin-5, ZO-1, or Occludin signal colocalized with VE-Cadherin as the area of interest. Images shown are representative image set with magnification at 20×. Columns are means ± SD. (Scale bars: 50 μm.) The imaging was performed with at least three replicates. *P < 0.05, **P < 0.01, ***P < 0.001.

References

    1. Engelhardt B., Liebner S., Novel insights into the development and maintenance of the blood-brain barrier. Cell Tissue Res. 355, 687–699 (2014). - PMC - PubMed
    1. Díaz-Coránguez M., Ramos C., Antonetti D. A., The inner blood-retinal barrier: Cellular basis and development. Vision Res. 139, 123–137 (2017). - PMC - PubMed
    1. Klaassen I., Van Noorden C. J., Schlingemann R. O., Molecular basis of the inner blood-retinal barrier and its breakdown in diabetic macular edema and other pathological conditions. Prog. Retin. Eye Res. 34, 19–48 (2013). - PubMed
    1. Zhao Z., Nelson A. R., Betsholtz C., Zlokovic B. V., Establishment and dysfunction of the blood-brain barrier. Cell 163, 1064–1078 (2015). - PMC - PubMed
    1. Luissint A. C., Artus C., Glacial F., Ganeshamoorthy K., Couraud P. O., Tight junctions at the blood brain barrier: Physiological architecture and disease-associated dysregulation. Fluids Barriers CNS 9, 23 (2012). - PMC - PubMed

Publication types

MeSH terms