. 2020 Aug 18;117(33):20015-20026.
doi: 10.1073/pnas.2005570117. Epub 2020 Aug 5.

Two distinct pathways of pregranulosa cell differentiation support follicle formation in the mouse ovary

Affiliations

Two distinct pathways of pregranulosa cell differentiation support follicle formation in the mouse ovary

Wanbao Niu et al. Proc Natl Acad Sci U S A. .

Abstract

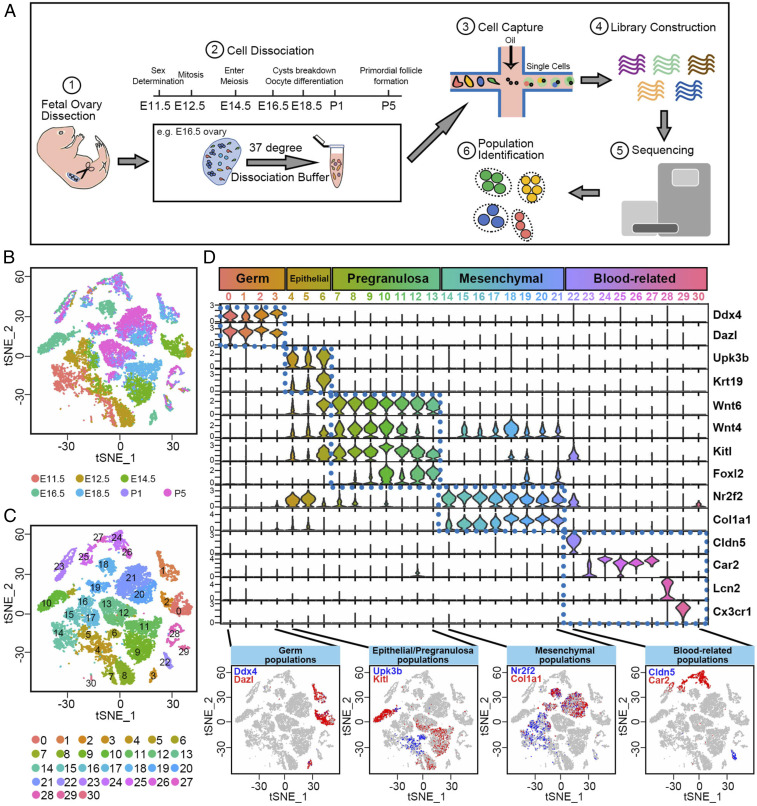
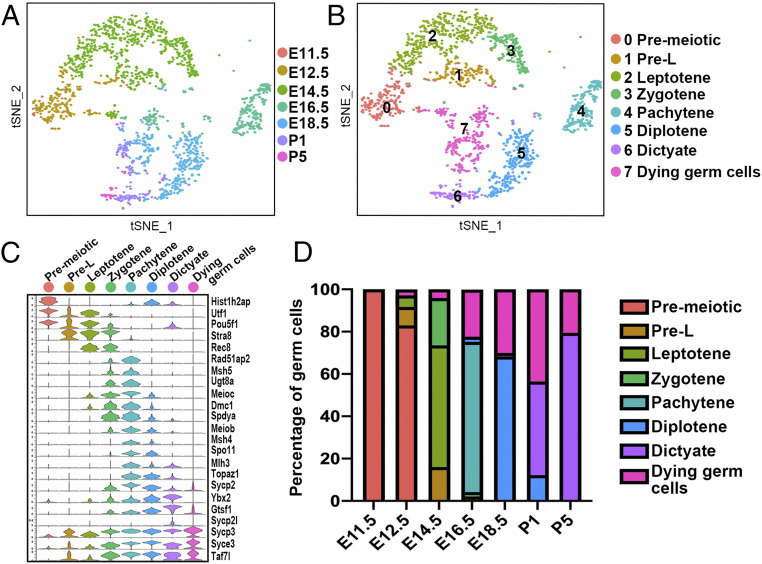
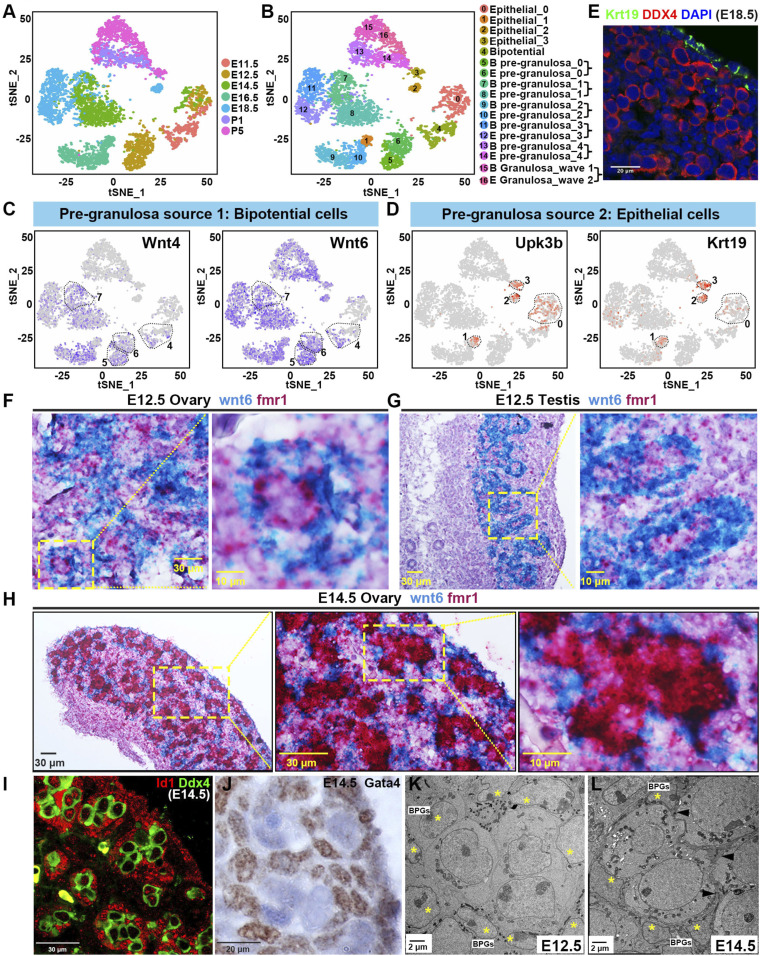
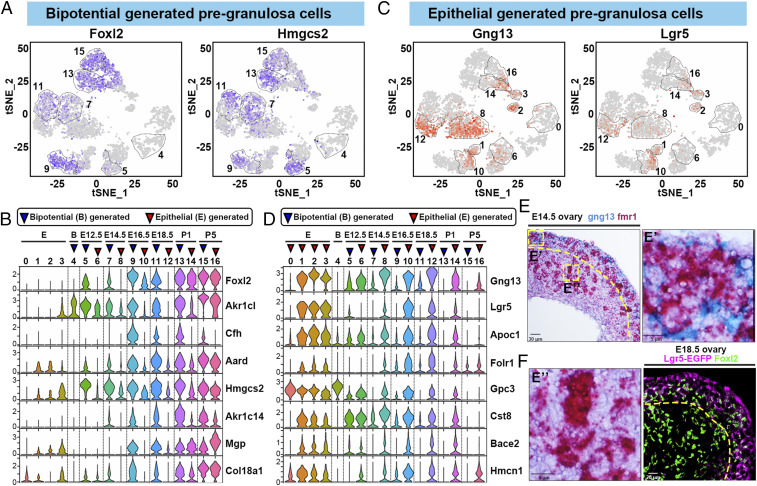
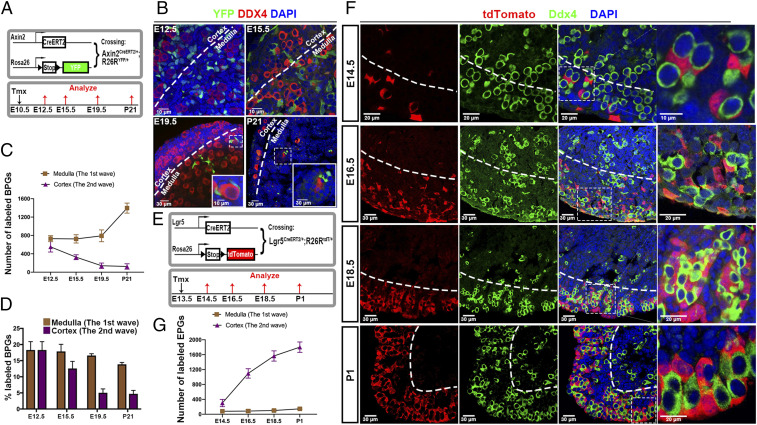
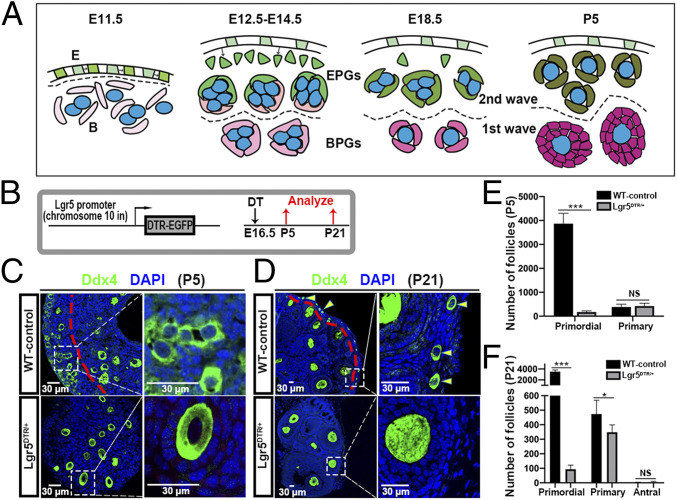
We sequenced more than 52,500 single cells from embryonic day 11.5 (E11.5) postembryonic day 5 (P5) gonads and performed lineage tracing to analyze primordial follicles and wave 1 medullar follicles during mouse fetal and perinatal oogenesis. Germ cells clustered into six meiotic substages, as well as dying/nurse cells. Wnt-expressing bipotential precursors already present at E11.5 are followed at each developmental stage by two groups of ovarian pregranulosa (PG) cells. One PG group, bipotential pregranulosa (BPG) cells, derives directly from bipotential precursors, expresses Foxl2 early, and associates with cysts throughout the ovary by E12.5. A second PG group, epithelial pregranulosa (EPG) cells, arises in the ovarian surface epithelium, ingresses cortically by E12.5 or earlier, expresses Lgr5, but delays robust Foxl2 expression until after birth. By E19.5, EPG cells predominate in the cortex and differentiate into granulosa cells of quiescent primordial follicles. In contrast, medullar BPG cells differentiate along a distinct pathway to become wave 1 granulosa cells. Reflecting their separate somatic cellular lineages, second wave follicles were ablated by diptheria toxin treatment of Lgr5-DTR-EGFP mice at E16.5 while first wave follicles developed normally and supported fertility. These studies provide insights into ovarian somatic cells and a resource to study the development, physiology, and evolutionary conservation of mammalian ovarian follicles.

Keywords: follicle; mouse; ovary; pregranulosa; scRNAseq.


Conflict of interest statement

The authors declare no competing interest.

Figures

Fig. 1.
Fig. 1.
Single-cell transcriptome landscape of fetal ovarian development. (A) Schematic experimental workflow using the 10X Genomics Chromium platform followed by clustering using Seurat (43). (B) A 2D visualization of single-cell clusters using tSNE colored by developmental time from E11.5 to P5. (C) A 2D visualization of single-cell clusters using tSNE colored by 31 identified cell types/clusters (numbers). (D) Summary of marker gene expression in cell clusters: Clusters 0 to 30 were subdivided into five subclasses based on gene expression (dotted boxes). (Bottom) Violin plots show marker gene expression in each cluster. y axis scale: a normalized UMI-per-cell scale for each gene to facilitate display. The Bottom of D shows the expression of marker genes (red and blue) from each subclass.
Fig. 2.
Fig. 2.
Dynamic gene expression patterns of mouse female germ cells. (A) Two-dimensional (2D) visualization of clusters from all germ cells using tSNE. Cells are colored by developmental stage from E11.5 to P5. (B) Two-dimensional visualization of integrated germ cell clusters using tSNE. Cells are colored by eight inferred developmental stages (see key for stage names). (C) Multiviolin plot of selected meiosis-related gene expression during the eight developmental stages. y axis scale: same as Fig. 1D. (D) Cell distribution among the eight stages at each time point.
Fig. 3.
Fig. 3.
Identification and cellular localization of epithelial and PG cells. (A) A 2D visualization of clusters from “epithelial” and “pregranulosa” subgroup cells using tSNE. Cells are colored by embryonic time points from E11.5 to P5. (B) A 2D visualization of epithelial and PG cell clusters using tSNE colored by 17 identified cell groups. (C) Expression of Wnt4 and Wnt6 in PG cells; the color indicates level of expression. In C and D, dashed regions correspond to indicated cell clusters (B). (D) Expression of Upk3b and Krt19 of epithelial cells; the color indicates level of expression. (E) Cellular localization of Krt19 in E18.5 ovaries. Ovaries were stained for Krt19, and the germ cell marker DDX4 at E18.5 by immunofluorescence. (FH) ISH analysis shows Wnt6 (blue) and Fmr1 (red) mRNA expression in the E12.5 ovary (F), E12.5 testis (G), and E14.5 ovary (H). Boxed regions are shown at higher magnification in the Right. (I) Cellular localization of Id1 in E14.5 ovaries. Ovaries were stained for Id1, and the germ cell marker DDX4 at E14.5 by immunofluorescence. (J) Cellular localization of Gata4 in E14.5 ovaries by immunohistochemistry. (K) Electron micrograph of E12.5 ovary showing part of a germline cyst (center) surrounded by BPG cells (yellow asterisks). (L) Electron micrograph of E14.5 ovary showing part of a germline cyst surrounded by BPG cells (yellow asterisks). Squamous membranes of BPG cells surrounding the germ cells are indicated by arrowheads. Scale bars are indicated.
Fig. 4.
Fig. 4.
Distinct gene expression patterns of BPG and EPG cells. (A) Expression of Foxl2 and Hmgcs2 in epithelial and PG cell clusters; color intensity indicates level of expression. The thin dashed lines indicate bipotential and BPG clusters. (B) A multiviolin plot showing the relative expression of BPG marker genes (gene names at right) in cell clusters (numbers at top). Blue triangle: BP or BPG cluster; red triangle: EPG cluster. Epithelial clusters (E) and developmental times are also indicated. (C) Expression of Gng13 and Lgr5 in epithelial and PG cell clusters; color intensity indicates level of expression. The thin dashed lines indicate epithelial and EPG clusters. (D) A multiviolin plot showing the relative expression of EPG marker genes (gene names at right). The blue and red triangles indicate bipotential (B), epithelial (E), BPG, and EPG clusters. Developmental times are also indicated. (E) ISH of Gng13 (blue) and Fmr1 (red) mRNA in the E14.5 ovary. Gng13-expressing PG cells are observed in a cortical region (E′) but are absent from a medullar region (E″). (F) Cellular localization of Lgr5-GFP and Foxl2 in E18.5 ovaries by immunofluorescence. Curved dashed lines in E and F show the boundary of the cortical and medullar regions.
Fig. 5.
Fig. 5.
Lineage tracing of BPG cell replacement by cortical EPG cells. (A) Strategy for lineage-tracing bipotential cells. Mice containing Axin2CreERT2/+ mice and R26RYFP/YFP received tamoxifen (Tmx) at E10.5, and ovaries were analyzed at E12.5, E15.5, E19.5, and P21. (B) YFP-marked cells (green) are seen adjacent to germ cells (red) in the medulla and in the cortex until E19.5. Boxed regions correspond to Insets. (C) Quantitation of YFP-labeled BPG cells in the cortex and medulla at each time point shown in B. (D) Percentage of cyst/follicle-associated PG cells labeled in the medulla and cortex at each time. (E) Strategy for lineage tracing EPG cells. Mice containing Lgr5CreERT2/+ and R26RtdT/tdT reporter received Tmx at E13.5, and ovaries were analyzed at E14.5, E16.5, E18.5, and P1. (F) tdTomato-positive EPG cells (red) were sparse at E14.5 but associated with germ cells (green). Cortical tdTomato+ cells increased significantly at E16.5, E18.5, and P1, but very few entered the medullar region. Boxed regions correspond to Right Column. (G). Dashed lines in B and F show the boundary of the cortical and medullar regions.
Fig. 6.
Fig. 6.
Lgr5-expressing cell ablation impairs second wave follicle formation. (A) Model of Epithelial progenitor cells (E), Bipotential cells (B), BPG cells (pink), and EPG cells (green) in forming first wave 1 and second wave follicles. Germ cells (blue). Developmental times are indicated. Dashed line separates ovarian cortex (above) from the medulla. (B) Experimental strategy to ablate Lgr5-expressing cells using the Lgr5-DTR-EGFP mouse model. (C) Histological analysis of ovaries from wild-type (WT) mice and Lgr5DTR/+ animals at P5. Boxed regions are magnified in the Right. (D) Histological analysis of ovaries from WT mice and Lgr5DTR/+ animals at P21. Yellow arrowheads correspond to primordial follicles. (E) Quantification of primordial (wave 2) and primary (wave 1) follicles at P5 after DT administration at E16.5. (F) Quantification of primordial (wave 2), primary (wave 1), and antral (wave 1) follicles at P21 after DT administration at E16.5. NS, not significant. *P < 0.05, ***P < 0.001 (t test). (Scale bars: 30 μm.)

References

    1. Hirshfield A. N., Development of follicles in the mammalian ovary. Int. Rev. Cytol. 124, 43–101 (1991). - PubMed
    1. McLaren A., Development of the mammalian gonad: The fate of the supporting cell lineage. BioEssays 13, 151–156 (1991). - PubMed
    1. Edson M. A., Nagaraja A. K., Matzuk M. M., The mammalian ovary from genesis to revelation. Endocr. Rev. 30, 624–712 (2009). - PMC - PubMed
    1. Rotgers E., Jørgensen A., Yao H. H., At the crossroads of fate-somatic cell lineage specification in the fetal gonad. Endocr. Rev. 39, 739–759 (2018). - PMC - PubMed
    1. Pepling M. E., Spradling A. C., Female mouse germ cells form synchronously dividing cysts. Development 125, 3323–3328 (1998). - PubMed