. 2020 Sep 3;5(17):e134309.
doi: 10.1172/jci.insight.134309.

Loss of Sbds in zebrafish leads to neutropenia and pancreas and liver atrophy

Affiliations

Loss of Sbds in zebrafish leads to neutropenia and pancreas and liver atrophy

Usua Oyarbide et al. JCI Insight. .

Abstract

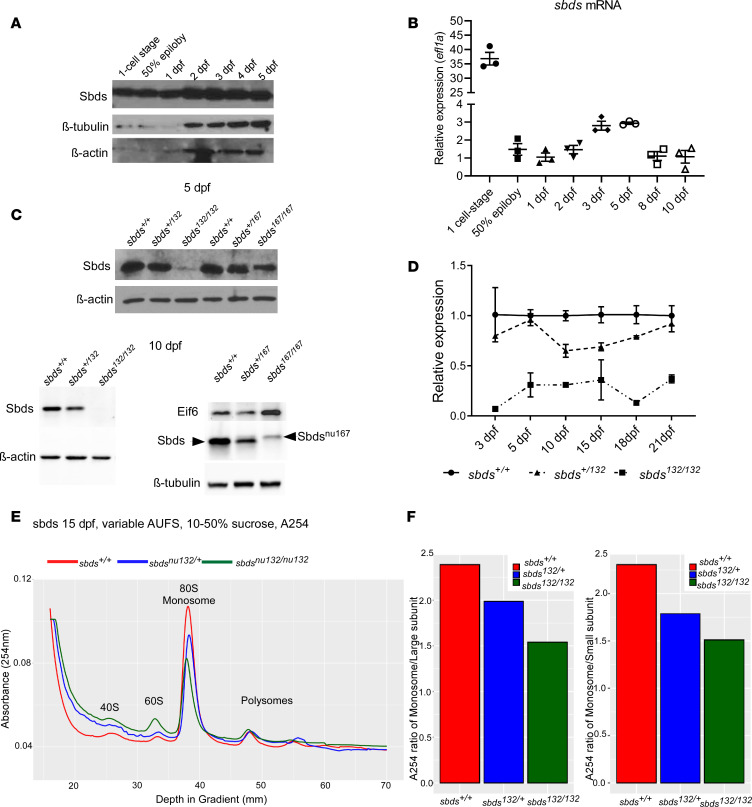
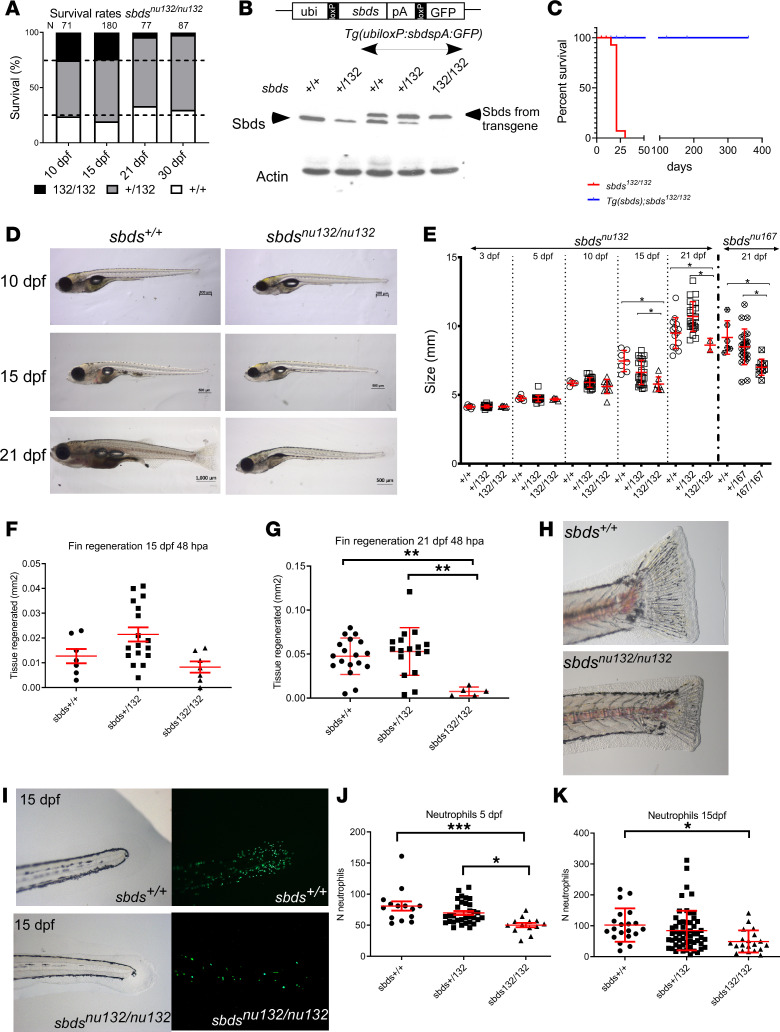
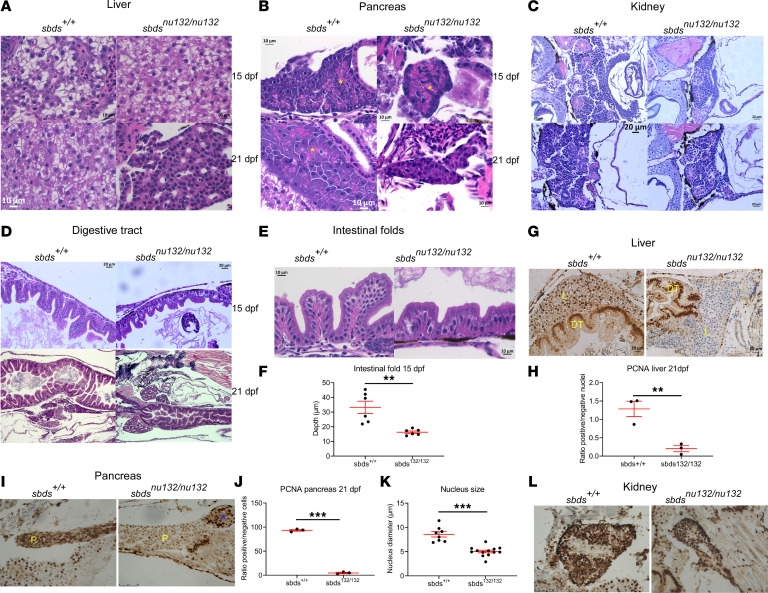
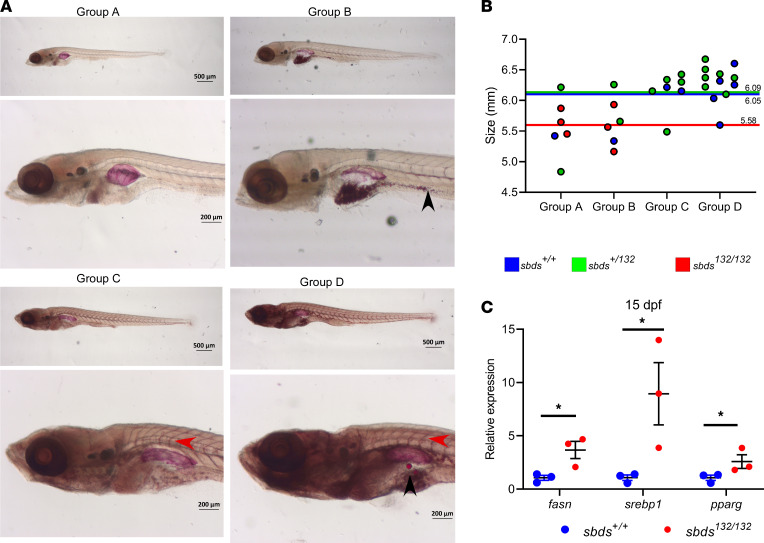
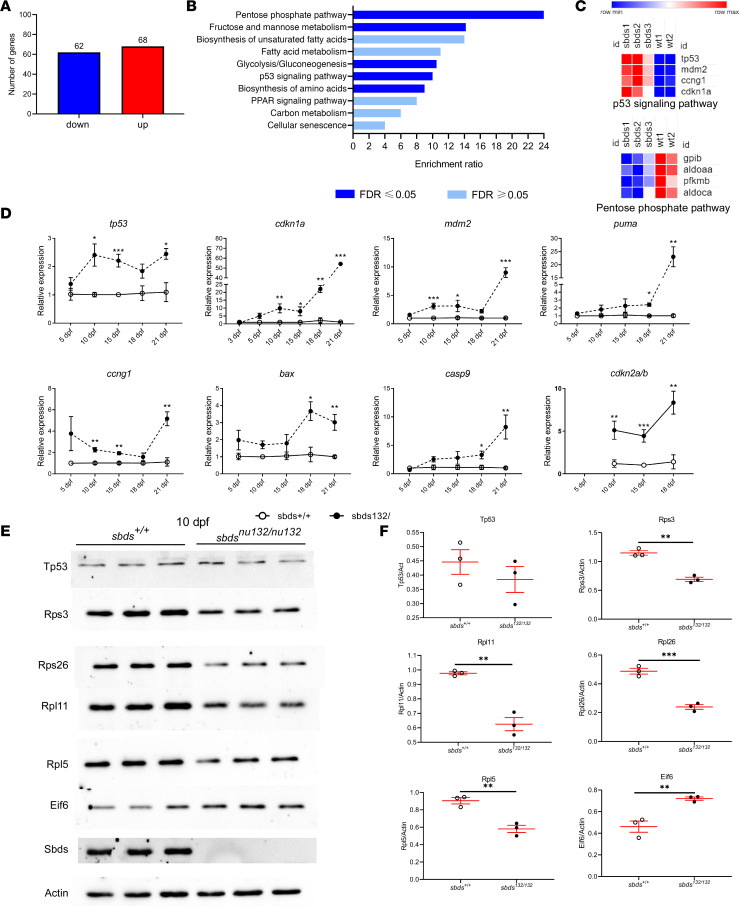
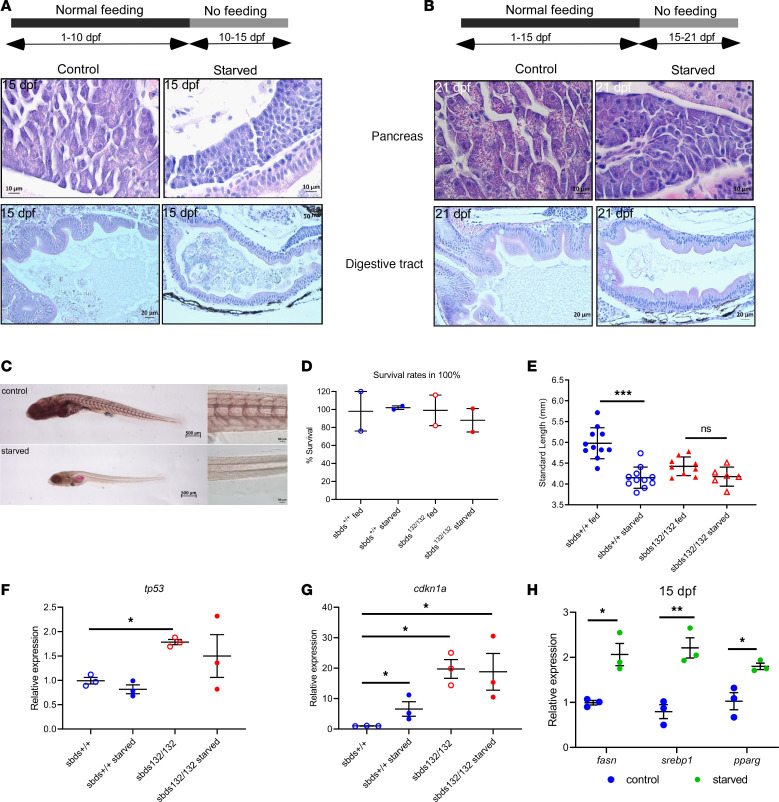
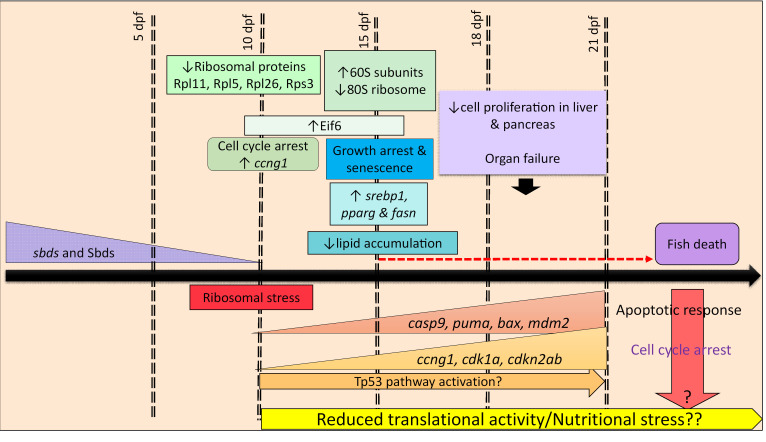
Shwachman-Diamond syndrome (SDS) is characterized by exocrine pancreatic insufficiency, neutropenia, and skeletal abnormalities. Biallelic mutations in SBDS, which encodes a ribosome maturation factor, are found in 90% of SDS cases. Sbds-/- mice are embryonic lethal. Using CRISPR/Cas9 editing, we created sbds-deficient zebrafish strains. Sbds protein levels progressively decreased and became undetectable at 10 days postfertilization (dpf). Polysome analysis revealed decreased 80S ribosomes. Homozygous mutant fish developed normally until 15 dpf. Mutant fish subsequently had stunted growth and showed signs of atrophy in pancreas, liver, and intestine. In addition, neutropenia occurred by 5 dpf. Upregulation of tp53 mRNA did not occur until 10 dpf, and inhibition of proliferation correlated with death by 21 dpf. Transcriptome analysis showed tp53 activation through upregulation of genes involved in cell cycle arrest, cdkn1a and ccng1, and apoptosis, puma and mdm2. However, elimination of Tp53 function did not prevent lethality. Because of growth retardation and atrophy of intestinal epithelia, we studied the effects of starvation on WT fish. Starved WT fish showed intestinal atrophy, zymogen granule loss, and tp53 upregulation - similar to the mutant phenotype. In addition, there was reduction in neutral lipid storage and ribosomal protein amount, similar to the mutant phenotype. Thus, loss of Sbds in zebrafish phenocopies much of the human disease and is associated with growth arrest and tissue atrophy, particularly of the gastrointestinal system, at the larval stage. A variety of stress responses, some associated with Tp53, contribute to pathophysiology of SDS.

Keywords: Embryonic development; Gastroenterology; Genetic diseases; Hematology; P53.


Conflict of interest statement

Conflict of interest: The authors have declared that no conflict of interest exists.

Figures

Figure 1
Figure 1. Sbds and sbds expression during development.
(A) Western blot of lysates from 25–30 pooled WT embryos showing Sbds expression at different stages in WT zebrafish. (B) Sbds expression profile in WT zebrafish the first 10 dpf with eifl1a as housekeeping gene. Gene expression normalized to 1 dpf and efl1a. (C) Western blotting showing Sbds expression at 5 and 10 dpf. (D) Sbds mRNA expression at different ages for WT, heterozygous, and homozygous mutants for the sbdsnu132 mutation. Expression is normalized against β-actin. (E) Polysome profile of 15 dpf larvae shows an increase of 60S and lower 80S peaks on sucrose gradient in sbds mutants and heterozygotes compared with WT siblings. (F) Ratio of monosome with respect to 40S and 60S subunits. Mutants and heterozygotes showed a lower ratio compared with WT siblings. AUFS, absorbance units full scale.
Figure 2
Figure 2. Sbds mutation leads to a defect in growth and fin regeneration and neutropenia.
(A) Survival rates for siblings of sbdsnu132. (B) Rescue of sbds mutants: Western blot showing Sbds from fins of adult fish with the indicated different genotypes. Note that the transgenic line expresses Sbds of a slightly bigger mass, due to an inadvertently introduced initiation codon upstream of the coding sequence. We took advantage of this 23–amino acid tag to distinguish between endogenous and exogenously introduced Sbds. Actin is shown as a control for protein loading. (C) Survival analysis, which demonstrates the rescue of sbdsnu132/nu132 by the transgenic line Tg(ubiloxP:sbdsloxP:GFP) N = 50; sbdsnu132/nu132. (D) Images of 10, 15, and 21 dpf larvae from the same clutch: sbds+/+ and sbdsnu132/nu132. Scale bars: 200 μm (10 dpf), 500 μm (15 dpf), 1000 μm (sbds+/+ 21 dpf), and 500 μm (sbdsnu132/nu132 21 dpf). (E) Size variability of mutants (sbdsnu132 and sbdsnu167) in the first 21 dpf. Fin regeneration 48 hours after amputation (hpa) in fish that are (F) 15 dpf (N = 30) and (G) 21 dpf, which shows less regeneration (N = 42). (H) Representative images of the fins 48 hpa in 21 dpf larvae for sbds+/+ and sbdsnu132/nu132. The sbdsnu132/nu132 mutants possess a decreased number of neutrophils. Original magnification, ×6.3. (I) Presence of neutrophils at 15 dpf in sbds+/+ and sbdsnu132/nu132 using the Tg(mpx:Dendra2)uw4. Original magnification, ×20. Number of neutrophils (J) at 5 and (K) at 15 dpf; N = 59 and N = 96, respectively. ANOVA test. *P < 0.05, **P < 0.001, ***P < 0.0001.
Figure 3
Figure 3. Sbdsnu132/nu132 mutants lead to defects in the liver, pancreas, and digestive tract.
H&E staining of (A) liver, showing no differences between sbds+/+ and sbdsnu132/nu132 at 15 dpf and liver fibrosis in sbds mutants at 21 dpf (original magnification, ×40); (B) pancreas, showing reduction of zymogen granules (yellow stars) (original magnification, ×40); (C) kidney and (D) digestive tract, showing a reduction in folds’ depth at 15 dpf and a constriction at 21 dpf in sbds mutants (original magnification, ×20); (E) intestinal folds at higher magnification (original magnification, ×40); and (F) quantitative differences in the depths of the epithelial folds. Immunohistochemistry for proliferation using PCNA in (G) liver at 21 dpf; (H) ratio of PCNA+ nuclei to total nuclei in the liver; (I) immunohistochemistry of pancreas, with blue star denoting the islet, at 21 dpf; and (J) ratio of PCNA+ nuclei to total nuclei in the pancreas and (K) kidney; no differences were detected in the ratios of positive nuclei to total nuclei (data not shown). (L) Quantification of the nucleus size in pancreatic acinar cells of sbds mutants versus WT siblings. *P < 0.05, **P < 0.001, ***P < 0.0001, t test. DT, digestive tract; L, liver; P, pancreas.
Figure 4
Figure 4. Sbdsnu132/nu132 mutants show a decrease in lipid accumulation.
(A) Oil Red O (ORO) staining for neutral lipid accumulation: different groups depending on ORO staining. Red arrow shows lipid accumulation in the blood vessels; lipid droplets are indicated by a black arrow. (B) Size distribution and genotypes depending on the ORO staining. Colored lines show the mean SL for each group. (C) Gene expression of lipid metabolism markers in 15 dpf larvae. Statistical analysis was performed using the t test. *P < 0.05.
Figure 5
Figure 5. Transcriptional analysis identifies the upregulation of Tp53-associated genes, whereas Western blotting demonstrates a decrease in ribosomal proteins.
RNA-Seq results. (A) Bioinformatic analysis of differentially expressed genes. (B) Gene enrichment analysis. (C) Heatmap of selected genes in Tp53 and pentose phosphate pathways. Relative expression based on fragments per kilobase of transcript per million mapped reads (FPKM) values significantly different between sbds mutants and WT. The color scale at the bottom represents the expression level, where red, blue, and white colors indicate upregulation, downregulation, and unaltered expression, respectively, on FPKM values. RT-qPCR analysis (D) mRNA levels at different time points of genes related to Tp53 pathway. (E) Western blotting at 10 dpf, 3 biological replicates for sbds+/+ and sbdsnu132/nu132. Two independent experiments with N = 3 each. (F) Quantification of Western blots using ImageJ (NIH). Statistical analysis was performed using the t test. *P < 0.05, **P < 0.001, ***P < 0.0001.
Figure 6
Figure 6. Sbds mutants show some features of starved fish.
(A and B) H&E staining of pancreas and digestive tract in starvation assays. (C) ORO staining for lipid accumulation in starved and fed fish for 10–15 or 15–21 dpf. A model of starvation was performed to determine size distribution and fin regeneration. Scale bars: 500 μm (left), 50 μm (right). (D) Survival rates and (E) size distribution in WT and mutants after starvation. Expression of (F) tp53 and (G) cdk1a show a dysregulation of cdkn1a in starved mutants. (H) Gene expression of lipid metabolism markers in starved WT fish. Statistical analysis was performed using the ANOVA and t test. *P < 0.05, **P < 0.001, ***P < 0.0001.
Figure 7
Figure 7. Scheme for the developmental pathophysiology of SDS based on phenotypic, biochemical, and genetic analysis of zebrafish mutants.

References

    1. Myers KC, et al. Variable clinical presentation of Shwachman-Diamond syndrome: update from the North American Shwachman-Diamond Syndrome Registry. J Pediatr. 2014;164(4):866–870. doi: 10.1016/j.jpeds.2013.11.039. - DOI - PMC - PubMed
    1. Dror Y, et al. Draft consensus guidelines for diagnosis and treatment of Shwachman-Diamond syndrome. Ann N Y Acad Sci. 2011;1242:40–55. doi: 10.1111/j.1749-6632.2011.06349.x. - DOI - PubMed
    1. Rothbaum R, et al. Shwachman-Diamond syndrome: report from an international conference. J Pediatr. 2002;141(2):266–270. - PubMed
    1. Bluteau O, et al. A landscape of germ line mutations in a cohort of inherited bone marrow failure patients. Blood. 2018;131(7):717–732. doi: 10.1182/blood-2017-09-806489. - DOI - PubMed
    1. Ong SY, Li ST, Wong GC, Ho AYL, Nagarajan C, Ngeow J. Delayed diagnosis of Shwachman diamond syndrome with short telomeres and a review of cases in Asia. Leuk Res Rep. 2018;9:54–57. - PMC - PubMed

Publication types

MeSH terms