. 2020 Aug 4;11(8):883.
doi: 10.3390/genes11080883.

Exploring the lncRNAs Related to Skeletal Muscle Fiber Types and Meat Quality Traits in Pigs

Affiliations

Exploring the lncRNAs Related to Skeletal Muscle Fiber Types and Meat Quality Traits in Pigs

Rongyang Li et al. Genes (Basel). .

Abstract

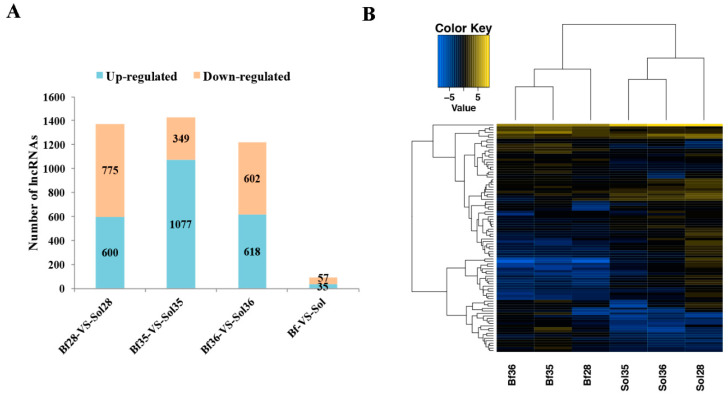
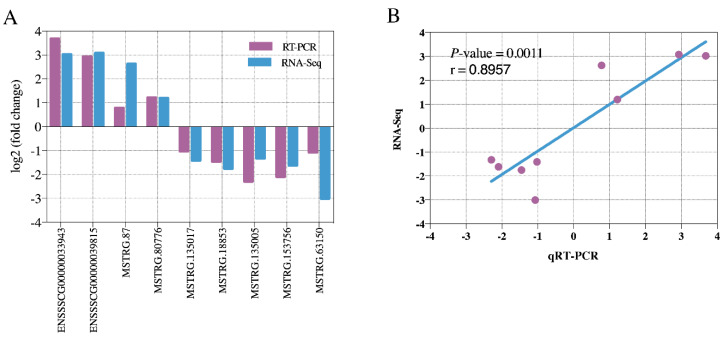
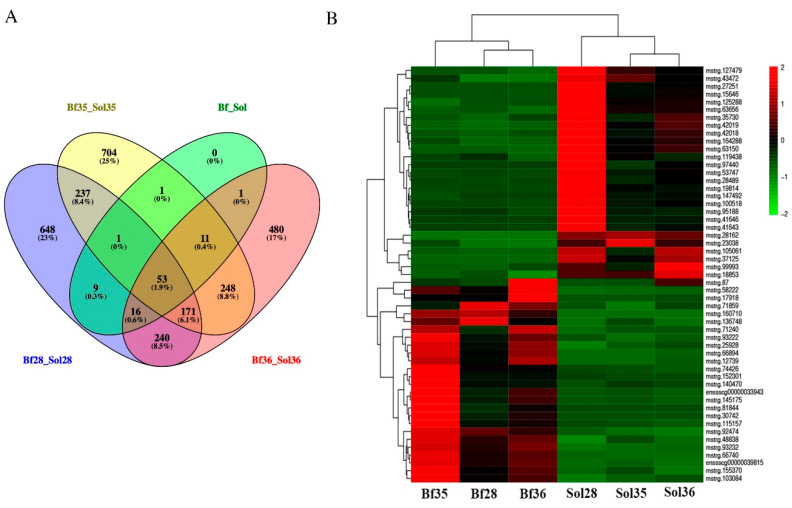
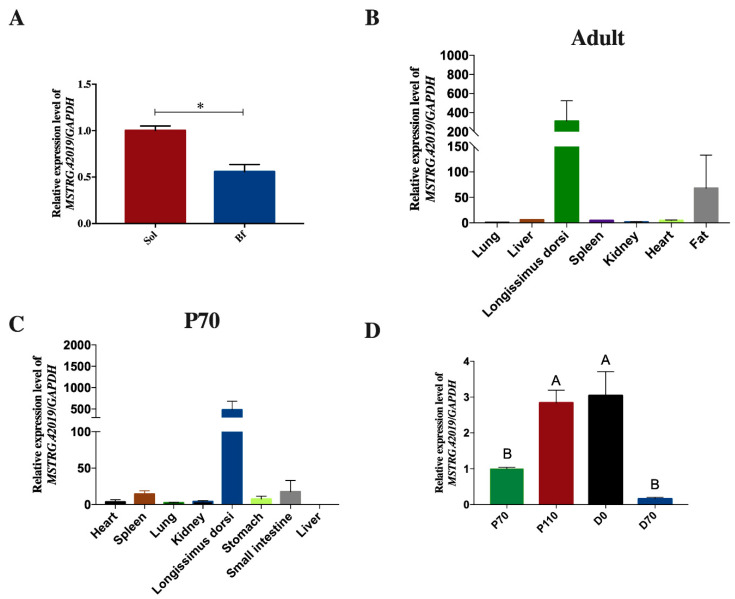
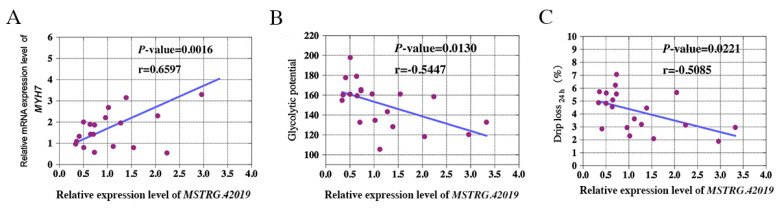
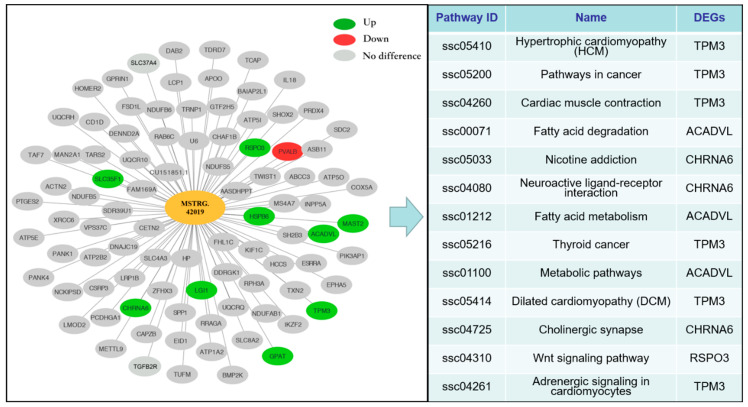
The alteration in skeletal muscle fiber is a critical factor affecting livestock meat quality traits and human metabolic diseases. Long non-coding RNAs (lncRNAs) are a diverse class of non-coding RNAs with a length of more than 200 nucleotides. However, the mechanisms underlying the regulation of lncRNAs in skeletal muscle fibers remain elusive. To understand the genetic basis of lncRNA-regulated skeletal muscle fiber development, we performed a transcriptome analysis to identify the key lncRNAs affecting skeletal muscle fiber and meat quality traits on a pig model. We generated the lncRNA expression profiles of fast-twitch Biceps femoris (Bf) and slow-twitch Soleus (Sol) muscles and identified the differentially expressed (DE) lncRNAs using RNA-seq and performed bioinformatics analyses. This allowed us to identify 4581 lncRNA genes among six RNA libraries and 92 DE lncRNAs between Bf and Sol which are the key candidates for the conversion of skeletal muscle fiber types. Moreover, we detected the expression patterns of lncRNA MSTRG.42019 in different tissues and skeletal muscles of various development stages. In addition, we performed a correlation analyses between the expression of DE lncRNA MSTRG.42019 and meat quality traits. Notably, we found that DE lncRNA MSTRG.42019 was highly expressed in skeletal muscle and its expression was significantly higher in Sol than in Bf, with a positive correlation with the expression of Myosin heavy chain 7 (MYH7) (r = 0.6597, p = 0.0016) and a negative correlation with meat quality traits glycolytic potential (r = -0.5447, p = 0.0130), as well as drip loss (r = -0.5085, p = 0.0221). Moreover, we constructed the lncRNA MSTRG.42019-mRNAs regulatory network for a better understanding of a possible mechanism regulating skeletal muscle fiber formation. Our data provide the groundwork for studying the lncRNA regulatory mechanisms of skeletal muscle fiber conversion, and given the importance of skeletal muscle fiber types in muscle-related diseases, our data may provide insight into the treatment of muscular diseases in humans.

Keywords: RNA-seq; lncRNA; meat quality; metabolic diseases; pig; skeletal muscle fiber.


Conflict of interest statement

The authors declare that they have no competing interests.

Figures

Figure 1
Figure 1
Statistics and heat map analyses of differentially expressed (DE) long non-coding RNAs (lncRNAs). (A) Statistics of DE lncRNAs. The X-axis represents the different compared groups, Biceps femoris (Bf) vs. Soleus (Sol) indicates the DE lncRNAs from the DEseq2 method; Bf28 vs. Sol28, Bf35 vs. Sol35, and Bf36 vs. Sol36 indicate DE lncRNAs from the DEGseq method. The Y-axis shows the number of DE lncRNAs. (B) Heat map analysis of DE lncRNAs between Bf and Sol muscles. Heat map analysis was conducted with 92 overlapped DE lncRNAs among three different comparative groups (Bf28 vs. Sol28, Bf35 vs. Sol35, and Bf36 vs. Sol36). Each column represents a sample and each row represents a DE lncRNA. Yellow and blue gradients indicate an increase and decrease in gene expression abundance, respectively.
Figure 2
Figure 2
Validation of DE lncRNAs and correlation analysis. (A) Validation of DE lncRNAs by qRT-PCR (n = 3). Relative expression levels were calculated using the 2−ΔΔct value method and porcine GAPDH was used for normalization of lncRNAs expression levels as an endogenous reference gene. The X-axis represents DE lncRNAs and the Y-axis represents the log2 (fold change) for qRT-PCR and RNA-Seq. (B) Correlation analysis of the expression of DE lncRNAs between qRT-PCR and RNA-Seq. The X and Y-axis represent the log2 (fold change) measured by qRT-PCR and RNA-Seq, respectively.
Figure 3
Figure 3
Overlapped and heat map analyses of DE lncRNAs. (A) Venn diagram of DE lncRNAs. A total of 53 overlapped DE lncRNAs were obtained from DEseq2 and DEGseq methods. Different color represents a different combination, and the number in the overlapped region represents the overlapped DE lncRNAs number. (B) Heat map analysis of 53 DE lncRNAs. Heat map analysis was conducted with 53 overlapped DE lncRNAs from four different comparative groups (Bf28 vs. Sol28, Bf35 vs. Sol35, Bf36 vs. Sol36, and Bf vs. Sol). Each column represents a sample and each row represents a DE lncRNA. Red and green gradients indicate an increase and decrease in gene expression abundance, respectively.
Figure 4
Figure 4
Expression patterns of lncRNA MSTRG.42019. (A) Expression of lncRNA MSTRG.42019 in Bf and Sol muscles. (B) Expression profile of lncRNA MSTRG.42019 in different tissues of adult pigs, n = 3. (C) Expression profile of lncRNA MSTRG.42019 in different tissues of 70-day-old fetuses, n = 3. (D) Expression patterns of lncRNA MSTRG.42019 in Longissimus dorsi muscles derived from different developmental stages, n = 3. Expression levels were determined by qRT-PCR and relative expression levels were calculated using the 2−ΔΔct method and normalized to the expression of GAPDH. The expression of lncRNA MSTRG.42019 in the sample of the first column was determined as control and normalized to 1. All data are presented as mean ± SE, and an unpaired Student’s t-test in the Prism 7 software was performed to evaluate significant differences between Bf and Sol. ANOVA with Duncan’s test was used to evaluate significant differences between groups P70 (70 days of pregnancy), P110 (110 days of pregnancy), D0 (the day of birth), and D70 (70 days after birth). * p ≤ 0.05, different letters above the bars indicate significant differences; p < 0.01.
Figure 5
Figure 5
Correlation analyses between the expression of lncRNA MSTRG.42019 and muscle fiber-related genes and meat quality traits. (A) Correlation between the expression of lncRNA MSTRG.42019 and Myosin heavy chain 7 (MYH7); (B) correlation between the expression of lncRNA MSTRG.42019 and glycolytic potential of Longissimus dorsi muscles; (C) correlation between the expression of lncRNA MSTRG.42019 and drip loss of Longissimus dorsi muscles. Twenty Longissimus dorsi muscles were derived from a 279 [(P) × (D)] × [(L) × (Y)] commercial hybrid pig population.
Figure 6
Figure 6
LncRNA MSTRG.42019–target mRNA interaction network and KEGG pathway search. Cytoscape was used to construct the interaction network between lncRNA MSTRG.42019 and target mRNAs. Red and green represent down-regulated and up-regulated target genes from Bf and Sol, respectively, and gray indicates non-DE target genes. The KEGG pathway search for DE target genes was conducted using the website tool KEGG Mapper (https://www.kegg.jp/kegg/tool/map_pathway2.html).

Similar articles

Cited by

References

    1. Gundersen K. Excitation-transcription coupling in skeletal muscle: The molecular pathways of exercise. Biol. Rev. Camb. Philos. Soc. 2011;86:564–600. doi: 10.1111/j.1469-185X.2010.00161.x. - DOI - PMC - PubMed
    1. Bassel-Duby R., Olson E.N. Signaling pathways in skeletal muscle remodeling. Annu. Rev. Biochem. 2006;75:19–37. doi: 10.1146/annurev.biochem.75.103004.142622. - DOI - PubMed
    1. Reyes N.L., Banks G.B., Tsang M., Margineantu D., Gu H., Djukovic D., Chan J., Torres M., Liggitt H.D., Hirenallur S.D., et al. Fnip1 regulates skeletal muscle fiber type specification, fatigue resistance, and susceptibility to muscular dystrophy. Proc. Natl. Acad. Sci. USA. 2015;112:424–429. doi: 10.1073/pnas.1413021112. - DOI - PMC - PubMed
    1. Petchey L.K., Risebro C.A., Vieira J.M., Roberts T., Bryson J.B., Greensmith L., Lythgoe M.F., Riley P.R. Loss of Prox1 in striated muscle causes slow to fast skeletal muscle fiber conversion and dilated cardiomyopathy. Proc. Natl. Acad. Sci. USA. 2014;111:9515–9520. doi: 10.1073/pnas.1406191111. - DOI - PMC - PubMed
    1. Boyer J.G., Prasad V., Song T., Lee D., Fu X., Grimes K.M., Sargent M.A., Sadayappan S., Molkentin J.D. ERK1/2 signaling induces skeletal muscle slow fiber-type switching and reduces muscular dystrophy disease severity. JCI Insight. 2019:5. doi: 10.1172/jci.insight.127356. - DOI - PMC - PubMed

Publication types

LinkOut - more resources