. 2020 Sep;4(9):964-971.
doi: 10.1038/s41562-020-0931-9. Epub 2020 Aug 5.

Modelling the impact of testing, contact tracing and household quarantine on second waves of COVID-19

Affiliations

Modelling the impact of testing, contact tracing and household quarantine on second waves of COVID-19

Alberto Aleta et al. Nat Hum Behav. 2020 Sep.

Abstract

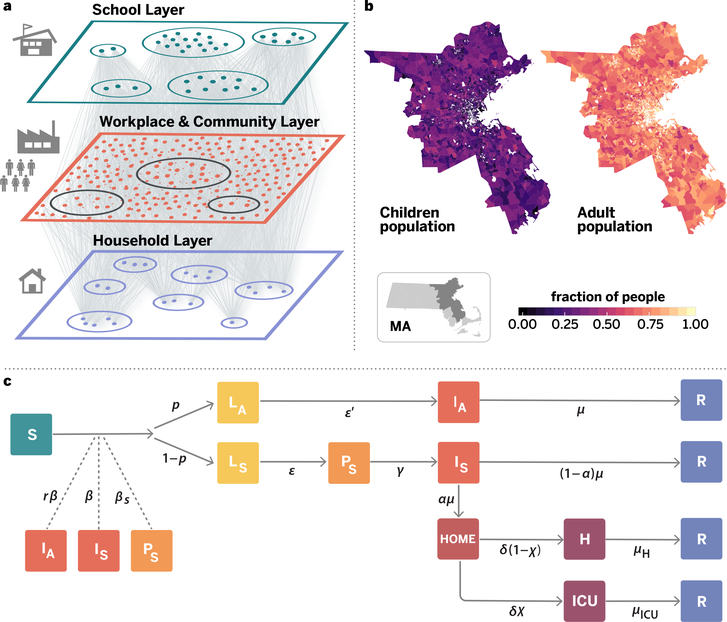
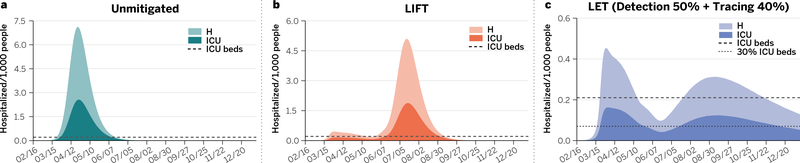
While severe social-distancing measures have proven effective in slowing the coronavirus disease 2019 (COVID-19) pandemic, second-wave scenarios are likely to emerge as restrictions are lifted. Here we integrate anonymized, geolocalized mobility data with census and demographic data to build a detailed agent-based model of severe acute respiratory syndrome coronavirus 2 (SARS-CoV-2) transmission in the Boston metropolitan area. We find that a period of strict social distancing followed by a robust level of testing, contact-tracing and household quarantine could keep the disease within the capacity of the healthcare system while enabling the reopening of economic activities. Our results show that a response system based on enhanced testing and contact tracing can have a major role in relaxing social-distancing interventions in the absence of herd immunity against SARS-CoV-2.


Figures

Figure 1
Figure 1. Model components.
Panel a is a schematic illustration of the weighted multilayer synthetic population built from mobility data in the metropolitan area of Boston. The agent-based system is made up by around 64000 adults and 21000 children, whose geographical distributions are shown in panel b. Nodes are connected by more than 5 million weighted edges. Community layers (that include workplaces), are further classified into categories according to Foursquare’s taxonomy of places. Panel c displays the compartmental model used to describe the natural history of the disease as well as the transition rates between the different states. Specifically, we consider Susceptible (S), Latent asymptomatic (LA), Latent symptomatic (LS), Pre-symptomatic (PS), Infectious asymptomatic (IA), Infectious symptomatic (IS), Hospitalised (H), Hospitalized in intensive care (ICU) and Recovered (R) individuals. More details of the model and the transitions between compartments are provided in Methods and the SM.
Figure 2
Figure 2. Impact of COVID-19 under different scenarios.
Evolution of the number of new cases (a, d, g), the outbreak size (b, e, h) and the effective reproductive number (c, f, i) as a function of time in each situation studied. Results of the SARS-CoV-2 transmission dynamics are shown for the unmitigated scenario (top panels a-c), and the two social distancing interventions considered, LIFT (d-f) and LET scenarios (g-h). In both cases, we considered the closure of schools and non-essential places for 8 weeks. This is the strictest lock-down period, which is followed by a partial lifting of the stay-at-home policy whose duration is set to 4 weeks. During the partial lifting, all places in the community layer are open except mass-gathering locations (restaurants, theaters, etc, see SM). Finally, a full reopening takes place after the period of partial lifting ends (relevant events are marked with the vertical lines). Panels d-f consider that no other measures are adopted concurrently to the lifting of the restrictions, whereas the results in panels g-i have been obtained when the reopening is accompanied by an active policy consisting of testing the symptomatic individuals, home isolating them, and quarantining their household and the households of a fraction of their contacts, as indicated in the legend of the bottom panels. Note that the vertical scales of panels a, d, and g are not the same and that both the number of new cases and total cases are per 1,000 inhabitants. In all panels the solid line represents the average over 10,000 simulations and the shaded region the 95% C.I.
Figure 3
Figure 3. Impact on the Boston health care system.
Estimated number of individuals per 1,000 inhabitants that would need hospitalization (H), and intensive care (ICU) for each of the three scenarios considered in Figure 2. Panel a corresponds to the unmitigated situation, whereas results for the LIFT and LET strategies are shown in panels b and c, respectively. The horizontal dotted-dashed lines represent the ICU basal capacity of the Boston health care system. The dotted line in panel c indicates 30% of the ICU basal capacity.
Figure 4
Figure 4. Affordability of the best way-out scenario.
LET strategy with 50% detection and 40% tracing. (a) Fraction of the population that needs to be put under quarantine as a function of time and percentage of contact tracing. (b) Health status of the individuals that are quarantined for a contact tracing level of 40%. Note that only symptomatic individuals are tested, which implies that a large fraction of the quarantined population is of unknown status. This fraction of individuals quarantined with unknown health condition could be reduced if the capacity to do more tests increases. As it is shown, the pandemic might span over several months depending on the level of contact tracing. (c) Number of individuals whose contacts are traced each day per 1,000 persons. Relevant intervention actions are signaled by the vertical dashed lines in all panels.

Update of

References

    1. World Health Organization, “Novel Coronavirus – China” (2020). URL https://www.who.int/csr/don/12-january-2020-novel-coronavirus-china/en/.
    1. Dong E, Du H & Gardner L An interactive web-based dashboard to track COVID-19 in real time. The Lancet infectious diseases 20, 533–534 (2020). - PMC - PubMed
    1. Kraemer MU et al. The effect of human mobility and control measures on the COVID-19 epidemic in China. Science 368, 493–497 (2020). - PMC - PubMed
    1. Flaxman S et al. Estimating the number of infections and the impact of non-pharmaceutical interventions on COVID-19 in European countries: technical description update. Preprint at arXiv: https://arxiv.org/abs/2004.11342 (2020).
    1. Walker PGT et al. The impact of COVID-19 and strategies for mitigation and suppression in low- and middle-income countries. Science eabc0035 (2020). - PMC - PubMed

Publication types

MeSH terms