. 2020 Aug;584(7820):252-256.
doi: 10.1038/s41586-020-2563-7. Epub 2020 Aug 5.

Rescue of oxytocin response and social behaviour in a mouse model of autism

Affiliations

Rescue of oxytocin response and social behaviour in a mouse model of autism

Hanna Hörnberg et al. Nature. 2020 Aug.

Abstract

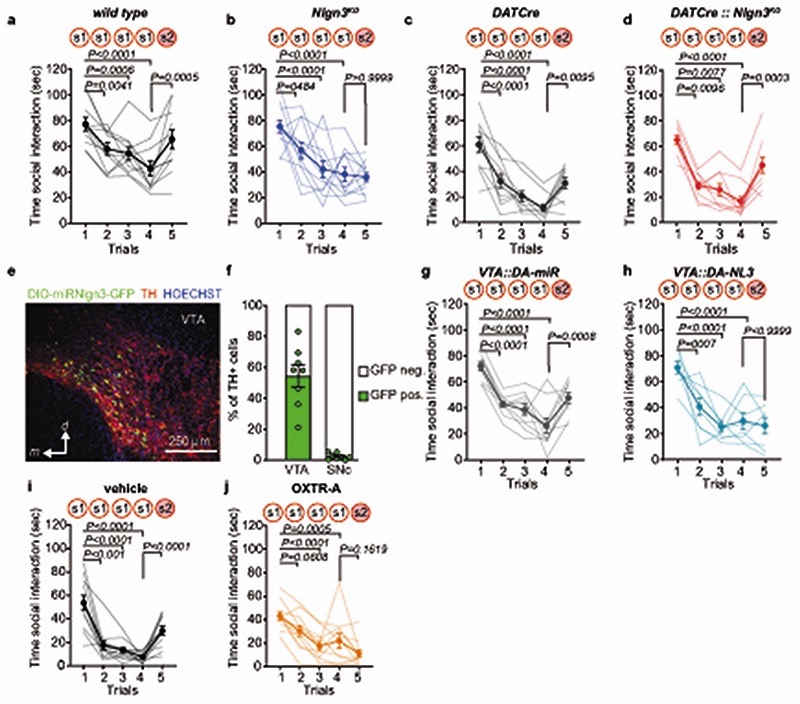
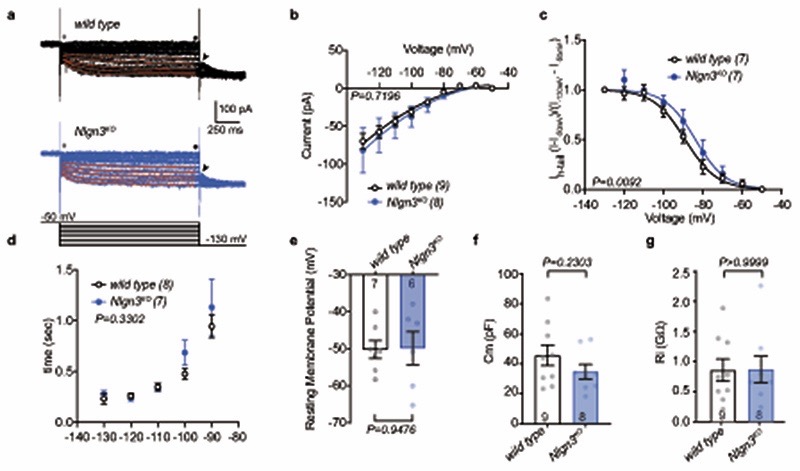
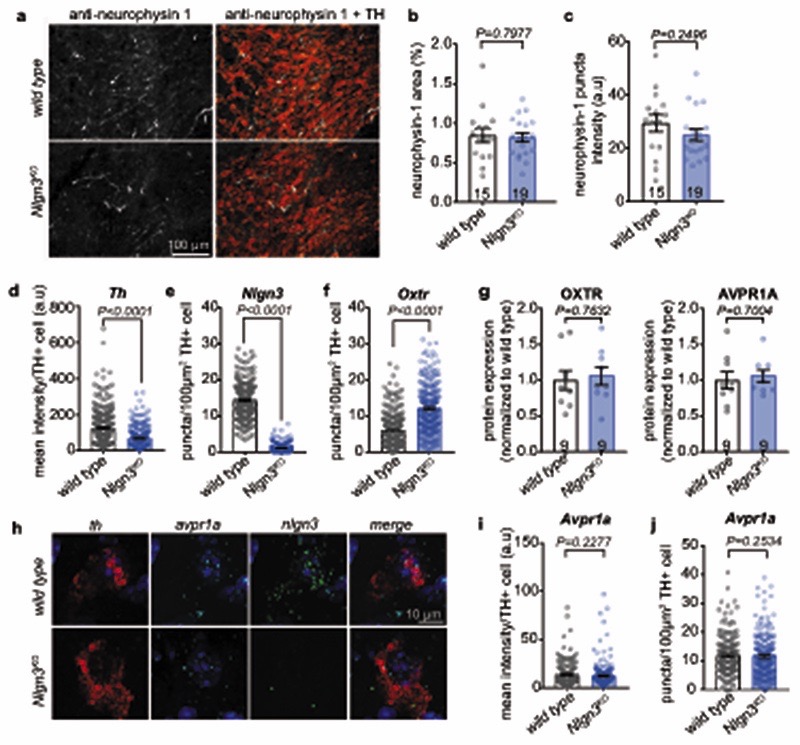
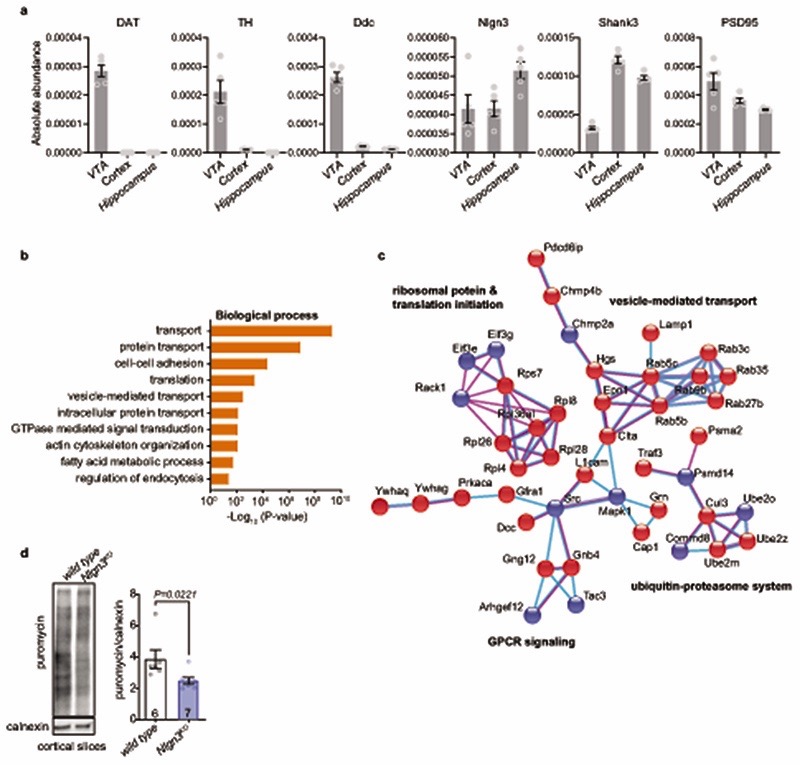
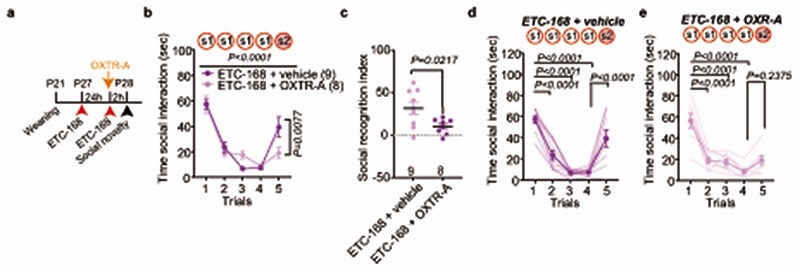
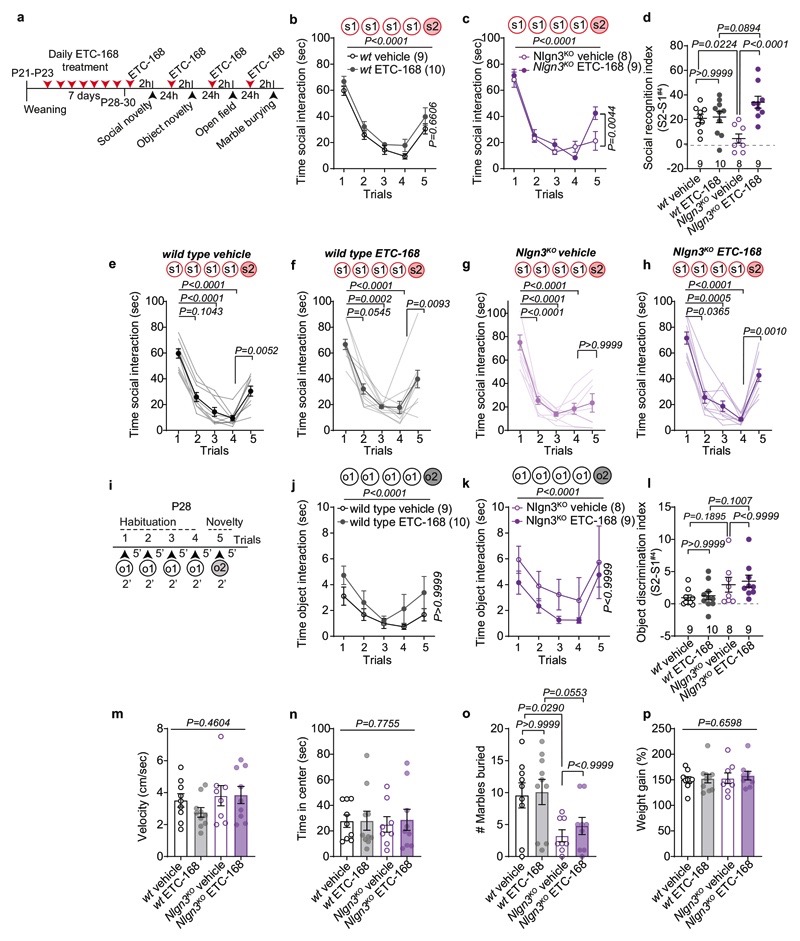
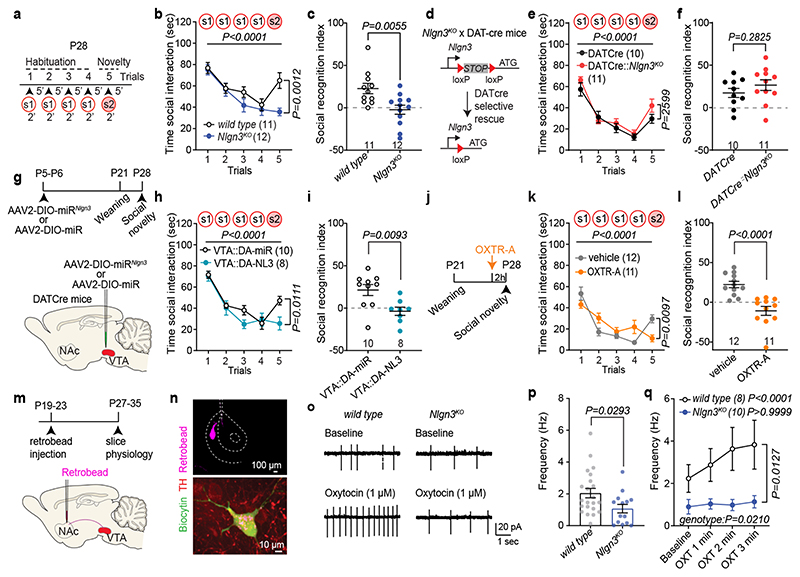
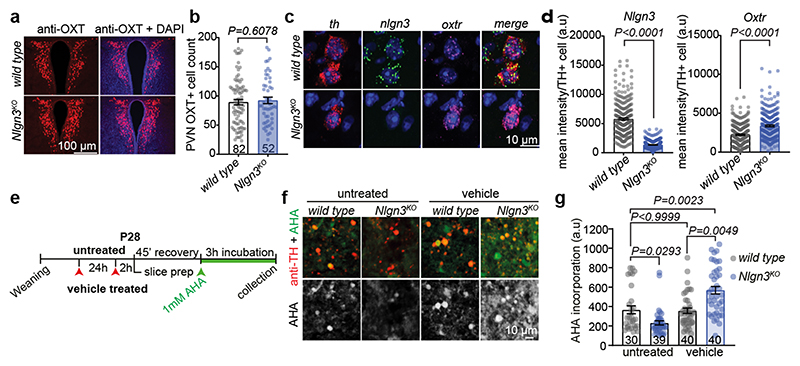
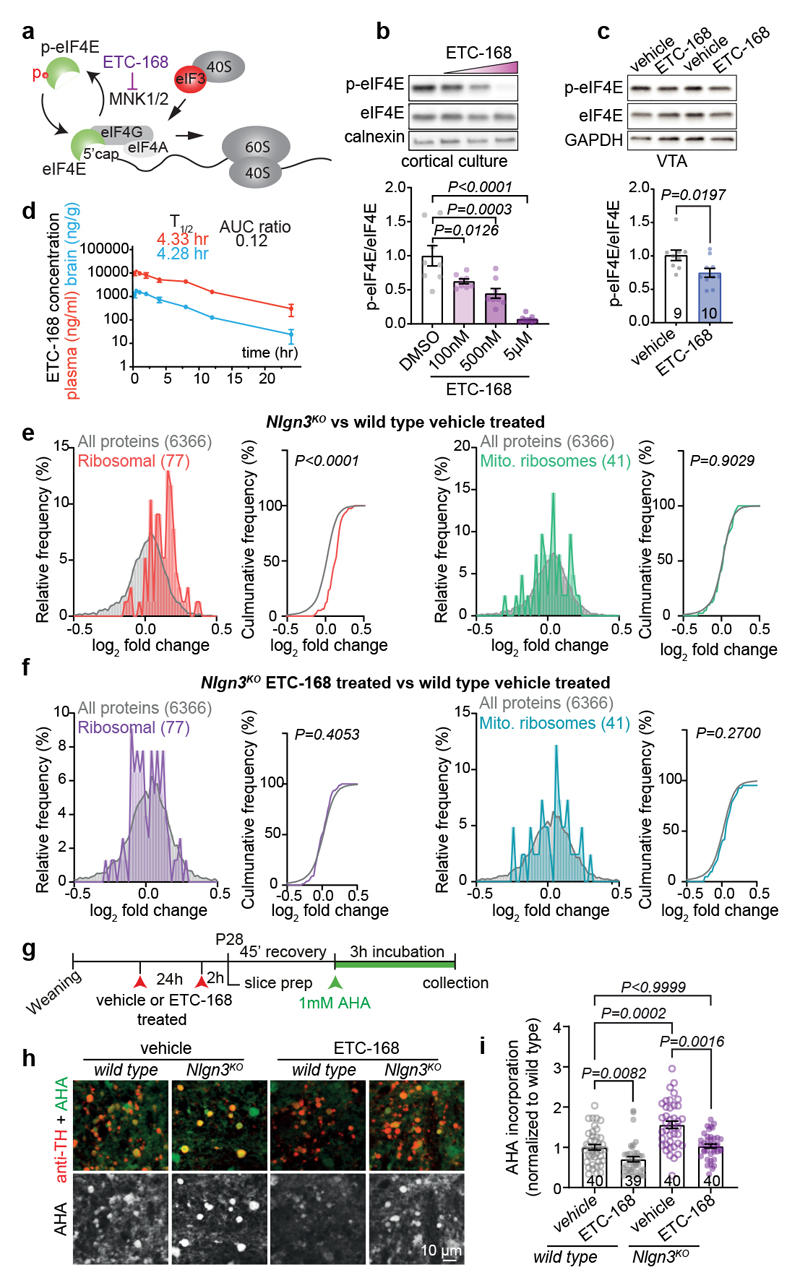
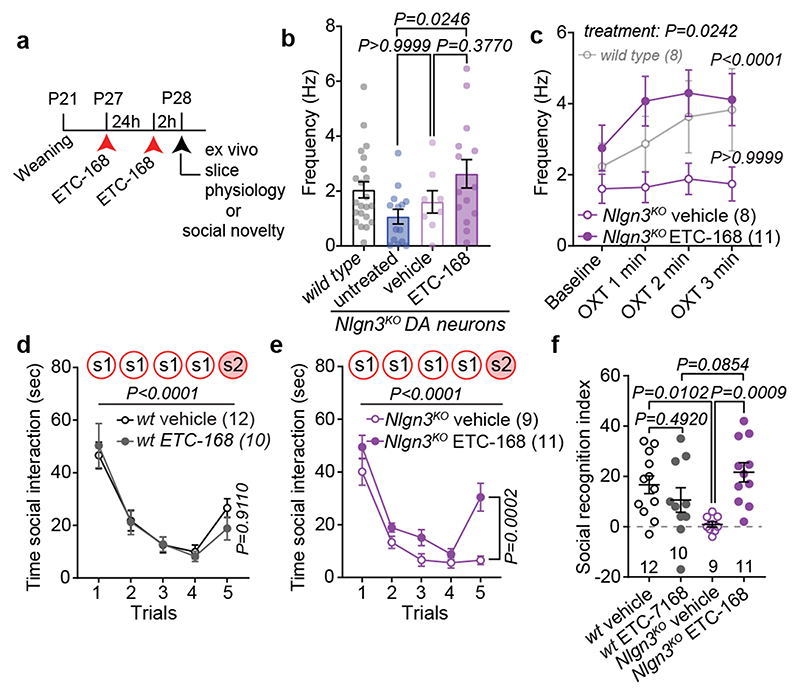
A fundamental challenge in developing treatments for autism spectrum disorders is the heterogeneity of the condition. More than one hundred genetic mutations confer high risk for autism, with each individual mutation accounting for only a small fraction of cases1-3. Subsets of risk genes can be grouped into functionally related pathways, most prominently those involving synaptic proteins, translational regulation, and chromatin modifications. To attempt to minimize this genetic complexity, recent therapeutic strategies have focused on the neuropeptides oxytocin and vasopressin4-6, which regulate aspects of social behaviour in mammals7. However, it is unclear whether genetic risk factors predispose individuals to autism as a result of modifications to oxytocinergic signalling. Here we report that an autism-associated mutation in the synaptic adhesion molecule Nlgn3 results in impaired oxytocin signalling in dopaminergic neurons and in altered behavioural responses to social novelty tests in mice. Notably, loss of Nlgn3 is accompanied by a disruption of translation homeostasis in the ventral tegmental area. Treatment of Nlgn3-knockout mice with a new, highly specific, brain-penetrant inhibitor of MAP kinase-interacting kinases resets the translation of mRNA and restores oxytocin signalling and social novelty responses. Thus, this work identifies a convergence between the genetic autism risk factor Nlgn3, regulation of translation, and oxytocinergic signalling. Focusing on such common core plasticity elements might provide a pragmatic approach to overcoming the heterogeneity of autism. Ultimately, this would enable mechanism-based stratification of patient populations to increase the success of therapeutic interventions.


Conflict of interest statement

Competing interests

S.B. P.S. A.M. and K.N. have filed patents on the use of MNK inhibitors for treatment of neurodevelopmental disorders. A.M. and K.N. are current or former employees of the Experimental Therapeutics Centre Singapore which has a commercial interest in the development of MNK1/2 inhibitors.

Figures

Extended Data Fig. 1
Extended Data Fig. 1. Loss of social recognition in Nlgn3KO mice.
a-b, Mean social interaction time and data for individual mice in the social habituation/recognition test plotted for (a) wild type (n=11) and (b) Nlgn3KO mice (n=12). c,d, Mean social interaction time and data for individual mice plotted for (c) DATCre control mice (n=10) and (d) DATCre::Nlgn3KO mice (n=11). e, Example for validation of targeted gene knockdown (n=8 mice) from AAV2-DIO-miRNL3-GFP viruses (green) in TH-positive cells (red) in the VTA of DATCre mice. f, Quantification of percentage of TH-positive cells in VTA and SNc of DATCre mice that express GFP from the AAV2-DIO-miR-GFP vector (n=8). g, h, Mean social interaction time and data for individual mice plotted for control mice (g, VTA::DA-miR, n=10) and VTA DA-specific Nlgn3 loss-of-function (h, VTA::DA-NL3, n=8) in the social habituation/recognition test. g, Mean social interaction time and data for individual mice plotted for (i) vehicle (n=12) and (j) OXTR-A treated mice (n=11). All error bars are s.e.m. RM one-way ANOVA followed by Bonferroni’s post-hoc test for planned multiple comparison for a, b, c, g, h, i, j; Friedman test followed by Dunn’s post-hoc test for planned multiple comparison for d. See Supplementary information for additional statistics.
Extended Data Fig. 2
Extended Data Fig. 2. Properties of NAc projecting VTA DA neurons in wild type and Nlgn3KO mice.
(a) Representative Ih currents recorded from wild type (black) and Nlgn3KO (blue) neurons evoked by consecutive hyperpolarizing voltage steps of −10 mV from −50 to −130 mV (bottom panel). At the end of each voltage step the voltage command was returned to −130 mV to evoke tail currents (Ih-tail, depicted with an arrowhead). Red lines show fit of a single exponential function used to assess the Ih activation kinetics. (b) Averaged Ih amplitudes were plotted against the voltage step. Ih current amplitudes were measured at the steady state (indicated with • in a) and the leak current values, as defined as the amplitude of the instantaneous currents at the onset of voltage steps (indicated with an * in a), subtracted. (c) Voltage-dependency of Ih-tail currents. Ih-tail amplitudes were normalized relative to Ih-tail at – 50 mV and −130 mV. Solid lines show fits with a Boltzmann function for least square fit. P-value on graph show difference in V50 between datasets. (d) Activation kinetics of the Ih as determined by the τ values obtained from the exponential fitting, as a function of the voltage commands voltage. Only the values obtained from commands between −130 mV to −90 mV were evaluated. (e) Comparison between groups of the resting membrane potential as assessed with current clamp recordings. (f) Membrane capacitance (Cm) of wild type and Nlgn3KO DA neurons. (g) Input resistant values (Rin) for wild type and Nlgn3KO.Cm and Ri values were obtained in voltage clamp mode by applying a −5 mV (200 ms) voltage command from a holding potential set at −50 mV. All error bars are s.e.m. P-value on graph represent genotype difference. n=5 mice per genotype, numbers on graphs represent cells. RM two-way ANOVA for b; Boltzmann sigmoidal for c; Mixed-effects model for d; unpaired two-sided t-test for e, f; two-sided Mann-Whitney test for g. See Supplementary information for additional statistics.
Extended Data Fig. 3
Extended Data Fig. 3. Oxytocinergic innervation to VTA and vasopressin receptor 1a mRNA levels are not affected in Nlgn3KO mice.
a, Representative images from 3 mice per genotype of neurophysin 1 (green), a cleavage product of the oxytocin neuropeptide precursor that is transported in vesicles together with oxytocin, and TH (red) immunofluorescence in the VTA of wild type and Nlgn3KO mice. Note that oxytocinergic axons arise from multiple hypothalamic nuclei, including the paraventricular nucleus. b, Mean VTA area coverage and c, puncta fluorescence in the VTA from wild type and Nlgn3KO mice. n= 3 mice per genotype. Number in brackets represent sections. d, Quantification of mean th intensity per TH+ cell. e, Quantification of Nlgn3 puncta per 100um2 TH+ cell. f, Quantification of Oxtr puncta per 100um2 TH+ cell. n=WT: 280 cells from 4 mice; Nlgn3KO: 265 cells from 3 mice for d, e, f. g, targeted proteomic (PRM) measurements for oxytocin receptor (left) and vasopressin receptor 1A (right) proteins in VTA. Number on bars indicate mice. h, Representative images of FISH labeling of avrp1a (cyan), th (red) and Nlgn3 (green) in the VTA from wild type and Nlgn3KO mice. Experiment was repeated independently twice. i, Quantification of mean avpr1a intensity per TH+ cell. j, Quantification of avpr1a puncta per 100um2 TH+ cell from wild type and Nlgn3KO VTA. n: wild type=169 cells from 4 animals; Nlgn3 KO=200 cells from 3 animals for i and j. All error bars are s.e.m. Unpaired two-sided t-test for b, c, g; two-sided Mann-Whitney U test for d, e, f, i, j. See Supplementary information for additional statistics.
Extended Data Fig. 4
Extended Data Fig. 4. Ribosomal proteins and translation processes are altered in Nlgn3KO mice.
a, TMT proteomics: graphs plotting abundance of dopamine markers and synaptic proteins from VTA, cortex and hippocampus. Dopaminergic markers are strongly enriched in VTA samples. n= 5 animals per brain region. b, c, Proteomic analysis of wild type and Nlgn3KO VTA, n=5 mice per genotype. b, Enrichment of GO terms for biological processes for proteins significantly altered (P<0.05) in Nlgn3KO mice compared to wild type. c, Network-based analysis of proteins altered in Nlgn3KO VTA (P<0.01). Blue nodes indicate downregulated proteins, red nodes upregulated proteins, light blue lines indicate interactions known from database and purple lines interactions experimentally determined. Disconnected nodes and nodes containing less than 6 proteins are not shown. See methods for additional information of statistics and analysis parameters. d, Mean puromycin incorporation in acute cortical slices from adult wild type and Nlgn3KO mice. All error bars are s.e.m. Two-sided Mann-Whitney U test for d. See Supplementary information for additional statistics.
Extended Data Fig. 5
Extended Data Fig. 5. Pharmacological profile of novel MNK1/2 inhibitor ETC-168
a, b, Quantification of (a) p-ERK1/2 and (b) p-eIF4G levels compared to non-phosphorylated protein in cortical neurons at DIV14 treated with ETC-168. n=8 replicates from 3 independent experiments. c-d, Quantification of (c) eIF4E (d) ERK1/2 and (e) eIF4G levels normalized to calnexin in cortical neurons at DIV14 treated with ETC-168. One-way ANOVA. n=8 replicates from 3 independent experiments. f, Representative western blot of cerebellar lysate from wild type mice treated with vehicle or ETC-168 and quantification of p-eIF4E levels compared to eIF4E. n: vehicle=4; 1 mg/kg=3; 5 mg/kg=6. g, Representative western blot of VTA lysate from wild type mice and Nlgn3KO mice (n=7 mice per genotype). h, Quantification of p-eIF4E compared to eIF4E and eIF4E levels in VTA of wild type mice and Nlgn3KO mice. n= 7 mice per genotype. i, Normalized p-eIF4E AlphaLisa counts from wild type and Nlgn3KO VTA lysate. n= 7 mice per genotype. j, k, Representative western blot (j) and quantification (k) of p-MNK1 and MNK1 levels in VTA lysate from wild type mice and Nlgn3KO mice. n= 7 mice per genotype. l, Normalized p-eIF4E AlphaLisa counts from VTA from wild type treated with 5mg/kg ETC-168 for 24h +2h. n= 5 mice per genotype. All error bars are s.e.m. One-way ANOVA for a, c, d, e, f; Kruskal-Wallis test for b; Unpaired two-sided t-test for h, k; two-sided Mann-Whitney test for i, l. See Supplementary information for additional statistics.
Extended Data Fig. 6
Extended Data Fig. 6. ETC-168 treatment restores cognitive rigidity in Fmr1KO mice.
a, Schematics of the Place-independent cue discrimination and reversal task. This task was chosen given that phenotypes in cognitive rigidity tasks have been replicated in multiple studies on this model. b, Mean consecutive correct responses plotted for Fmr1WT/y and Fmr1KO/y mice. c, Treatment schedule of Fmr1WT/y and Fmr1KO /y mice. Animals were treated daily with vehicle during the learning phase and with 5 mg/kg ETC-168 during the reversal phase 2 hours before the start of the test. d, Mean consecutive correct responses plotted for vehicle treated Fmr1WT /y and vehicle or ETC-168 Fmr1KO/y mice. Numbers in brackets indicate mice. Error bars report s.e.m. RM two-way ANOVA followed by Bonferrroni’s post-hoc test for b, d. See Supplementary information for additional statistics.
Extended Data Fig. 7
Extended Data Fig. 7. Effect of ETC-168 treatment on protein abundance in wild type and Nlgn3KO mice.
a, Experimental outline. b, Representative western blot and quantification of p-eIF4E compared to eIF4E levels in VTA lysate from wild type mice treated with vehicle or 5mg/kg ETC-168 for 7 consecutive days. n: vehicle=6; ETC-168: 7. c, Normalized p-eIF4E AlphaLisa counts from wild type mice VTA treated with vehicle or 5mg/kg ETC-168 for 7 consecutive days. n: vehicle=6; ETC-168: 7. d, Graphs plotting TMT proteomic normalized protein expression of dopaminergic markers in VTA from vehicle or ETC-168 treated wild type and Nlgn3KO mice. Animals were treated for 7 days. n=4 mice per genotype and treatment. e,f, Graphical representation of Molecular function GO terms enriched in (e) Nlgn3KO versus wild type vehicle treated and (f) Nlgn3KO ETC-168 versus wild type vehicle treated VTA. GO terms were summarized using REVIGO and only terms with Q<0.01 are represented. g,h, TMT proteomic comparison of VTA from (g) vehicle-treated mice and (h) ETC-168 treated Nlgn3KO versus wild type. Relative frequency of log2 fold change in core proteasome n abundance (Nlgn3KO/wild type) is plotted. n= 4 mice per genotype and treatment. All error bars are s.e.m. Unpaired two-sided t-test for b; two-sided Mann-Whitney U test for c. Kolmogorov-Smirnov test for g, h. See methods and Supplementary information for additional statistics.
Extended Data Fig. 8
Extended Data Fig. 8. Effect of short-term ETC-168 treatment on social recognition in wild type and Nlgn3KO mice.
a-d, Time course of time interacting in the social habituation/recognition test for mice after short-term treatment with ETC-168. (a) Wild type vehicle (n=12), (b) wild type ETC-168 (n=10), (c) Nlgn3KO vehicle (n=9), and (d) Nlgn3KO ETC-168 (n=11). Error bars report s.e.m. Friedmans test followed by Dunn’s post hoc test for planned multiple comparison for a, c, d, RM one-way ANOVA followed by Bonferroni’s post-hoc test for planned multiple comparison for b. See Supplementary information for additional statistics.
Extended Data Fig. 9
Extended Data Fig. 9. Effect of ETC-168 treatment is dependent on the oxytocin receptor.
a, Experimental outline. b, Mean social interaction time in Nlgn3KO mice treated with 5 mg/kg ETC-168 and either vehicle or 10 mg/kg OXTR-A. Number in brackets indicate mice. c, Social recognition index for Nlgn3KO mice treated with ETC-168 and vehicle, or ETC-168 and OXTR-A. Number on graph indicate mice. d-e, Individual values and mean of time interacting in the social habituation/recognition test after treatment with (d) ETC-168 + vehicle (n=9), or (e) ETC-168 + OXTR-A (n=8). Error bars report s.e.m. RM two-way ANOVA followed by Bonferroni’s post-hoc test for b; unpaired two-sided t-test for c; RM one-way ANOVA followed by Bonferroni’s post-hoc test for planned multiple comparison for d, e. See Supplementary information for additional statistics.
Extended Data Fig. 10
Extended Data Fig. 10. Effect of long-term ETC-168 treatment on behavior in wild type and Nlgn3KO mice.
a, Experimental schematics of chronic ETC-168 treatment and behavior schedule. Number of animals per treatment conditions for all behaviors in b-p: wild type vehicle=9, wild type ETC-168=10, Nlgn3KO vehicle=8, Nlgn3KO ETC-168=9. b, c, Mean social interaction time in (b) wild type and (c) Nlgn3KO mice treated for 8 days with vehicle or 5 mg/kg ETC-168. d, Social recognition index for wild type and Nlgn3KO mice treated with vehicle or 5 mg/kg ETC-168. Numbers in brackets indicate mice. e-f, Individual values and mean time interacting in the social habituation/recognition test after chronic treatment with ETC-168 for (e) wild type vehicle (n=9), (f) wild type ETC-168 (n=10), (g) Nlgn3KO vehicle (n=8), and (h) Nlgn3KO ETC-168 (n=9). i, Experimental schematics of object habituation/recognition test in juvenile mice. j-l, Mean object interaction time plotted for (j) wild type and (k) Nlgn3KO mice. P-value above graphs report Trial. l, Object recognition index. m, Mean velocity (cm/sec) in an open field arena during 7 min. n, Time spend in center of the open field arena. o, Number of marbles buried during a 30 minutes marble burying test. p, Percentage weight gain in wild type and Nlgn3KO mice treated with ETC-168 or vehicle. P-value for treatment is displayed on graphs. Error bars report s.e.m. RM two-way ANOVA followed by Bonferroni’s post-hoc test for genotype and treatment for b, c, j, k; RM two-way ANOVA followed by Bonferroni’s post-hoc test for genotype and treatment for d, l, o; Friedman test followed by Dunn’s post-hoc test for planned multiple comparison for e, f, h; One-way ANOVA followed by Bonferroni’s post-hoc test for planned multiple comparison for g; RM two-way ANOVA for m, n, p. See Supplementary information for additional statistics.
Fig. 1
Fig. 1. Oxytocin response is altered in VTA DA neurons lacking Nlgn3.
a, 5-trial social habituation/recognition task. s1=first, s2=second social stimulus. b,c, Mean social interaction time (b) and social recognition index (c) in wild type and Nlgn3KO mice. Numbers on graphs represent mice. d, Nlgn3KO mutation containing a loxP-flanked transcriptional stop cassette. In DATCre mice Nlgn3 is selectively re-expressed in dopaminergic neurons. e,f, Mean social interaction time (e) and social recognition index (f) in DATCre and DATCre::Nlgn3KO mice. g, VTA AAV-injection in DAT-Cre mice for microRNA-mediated knockdown of Nlgn3 in VTA-DA neurons (VTA::DA-NL3). h,i, Mean social interaction (h) and social recognition index (i) for VTA::DA-NL3 or control (VTA::DA-miR) mice. j, Oxytocin receptor antagonist treatment (OXTR-A, L-368,899 10 mg/kg i.p. in saline). k,l Mean social interaction (k) and social recognition index (l) for OXTR-A and vehicle treated mice. m, Retrobeads were injected in the NAc medial shell and tissues prepared for slice physiology. n, Retrobead injection site in the NAc (top) and TH immunoreactivity and retrobead labeling in biocytin-filled VTA neurons (bottom) after recording. o, Example traces of spontaneous firing at baseline (top) and after bath application of 1 μM OXT (bottom) in VTA DA neurons from wild type (left) and Nlgn3 KO (right). p, Frequency at baseline in TH-positive wild type and Nlgn3 KO VTA DA neurons. n: wild type=22 cells from 12 animals; Nlgn3 KO=14 neurons from 8 animals. q, Average firing frequency (Hz) after bath application with OXT in retrobead-labeled TH-positive cells in VTA of wild type and Nlgn3KO mice. P-value on graph: Within group comparison of baseline vs. OXT 3rd min. n: wild type= 8 cells from 7 animals; Nlgn3 KO=10 neurons from 7 animals. Error bars are s.e.m. RM two-way ANOVA followed by Bonferroni’s post-hoc test for b, e, h, k, q; unpaired two-sided t-test for c, f, i, p; two-sided Mann-Whitney test for l. Additional statistics in Supplementary Information.
Fig. 2
Fig. 2. Disruption of translational regulation in VTA of Nlgn3KO mice.
a, Representative image of OXT (red) and DAPI (blue) immunofluorescence in the PVN of wild type and Nlgn3KO mice. b, Mean OXT positive cells per section in the PVN in wild type and Nlgn3KO mice. n= 3 mice per genotype, numbers on bar indicate sections analyzed. c, Representative fluorescent in situ hybridization (FISH) images in the VTA from wild type (top) and Nlgn3KO (bottom) using probes for th (red), nlgn3 (green) and oxtr (magenta). d, Quantification of mean fluorescence intensity per th+ cell from wild type and Nlgn3 KO VTA for nlgn3 (left) and oxtr (right). n: wild type= 280 cells from 4 animals; Nlgn3 KO=265 cells from 3 animals. e, Scheme for AHA incorporation on slice preparations from untreated and vehicle treated mice. f, Representative images of acute slice measurements of protein synthesis in VTA visualized by AHA incorporation (green) with marking of TH-positive cells (red). g, quantitative assessment of AHA incorporation in naïve mice versus mice treated by oral gavage with vehicle. n: wild type untreated= 3 animals; Nlgn3KO untreated, Nlgn3KO vehicle and wild type vehicle = 4 animals. Numbers on graph refer to the number of images analyzed (8-20 VTA DA cells per image, approximately 10 images per animal). All error bars are s.e.m. Two-sided Mann-Whitney test for b, d; Kruskal-Wallis test followed by Dunn’s multiple comparison test for g. See Supplementary information for additional statistics.
Fig. 3
Fig. 3. The novel MNK1/2 inhibitor ETC-168 rescues translation in Nlgn3KO VTA.
a, ETC-168 targets MNK1/2. Note that eIF4E phosphorylation decreases affinity of eIF4E for the mRNA 5’cap structure b, eIF4E phosphorylation in day in vitro 14 cortical neurons treated with ETC-168 for 3 hours. n=8 replicates, 3 independent experiments. c, Representative western blot and quantification of VTA lysate from wild type mice treated with vehicle or 5 mg/kg ETC-168. Numbers on graphs represent mice. d, Pharmacokinetic analysis of ETC-168 in male mice (n=27) after single oral dose of 10 mg/kg. Plasma levels in red, brain levels in blue. Half life (T1/2), maximal concentration (Cmax), and brain to plasma exposure (AUCratio) are displayed on the graph. e, Tandem mass tag (TMT) proteomic comparison of VTA from vehicle-treated mice (n=4 mice per genotype and treatment). Relative frequency of log2 fold change in either all detected proteins, cytosolic, or mitochondrial ribosomal protein abundance is plotted (Nlgn3KO/wild type). f, Comparison as in e for log2 fold change in protein abundance in ETC-168 treated Nlgn3KO versus wild type. g, FUNCAT assay in acute slices from vehicle or ETC-168 treated mice (5mg/kg or vehicle by oral gavage). h, Representative examples of AHA incorporation (green) in TH-positive cells (red). i, Quantitative assessment of AHA incorporation in vehicle (as in Fig. 2h for comparison to untreated mice) versus ETC-168 treated wild type and Nlgn3KO mice. n=4 mice per genotype and treatment. Numbers on graphs refer are number of images analyzed. Error bars are s.e.m. One-way ANOVA followed by Bonferroni’s post-hoc test for b; two-sided unpaired t-test for c; Kolmogorov-Smirnov test for e, f; Kruskal-Wallis test followed by Dunn’s multiple comparison test for i. Additional statistics in Supplementary Information.
Fig. 4
Fig. 4. MNK inhibition restores social novelty responses in Nlgn3 KO mice.
a, Scheme for drug treatment and analysis. b, Firing frequency at baseline in VTA DA neurons from Nlgn3 KO animals untreated, treated with vehicle, or 5 mg/kg ETC-168. n: untreated=14 neurons from 8 mice; vehicle=8 neurons from 4 mice; ETC-168=14 neurons from 8 mice. The wild type mouse data from Fig. 1c is presented for comparison (n=22). c, OXT-induced frequency changes over time in VTA DA neurons from Nlgn3 KO animals treated with vehicle or 5 mg/kg ETC-168. Wild type mice from Fig. 1e are presented for comparison. P-values on graph: Baseline vs. OXT 3rd min. n: vehicle treated=8 cells from 4 mice; ETC-168 treated=11 neurons from 6 mice. d, e, Mean social interaction time in (d) wild type and (e) Nlgn3KO mice treated with vehicle or 5 mg/kg ETC-168. f, Social recognition index for wild type and Nlgn3KO mice treated with vehicle or 5 mg/kg ETC-168. Numbers in brackets indicate mice. All error bars are s.e.m. One-way ANOVA followed by Bonferroni’s post-hoc test for b; RM two-way ANOVA followed by Bonferroni’s post-hoc test for c; RM two-way ANOVA between all genotype and treatment groups followed by Bonferroni’s post-hoc test for d, e; RM two-way ANOVA followed by Bonferroni’s post-hoc test for treatment and genotype for f. Additional statistics Supplementary Information.

Comment in

  • Targeting translation.
    Wrighton KH. Wrighton KH. Nat Rev Drug Discov. 2020 Oct;19(10):670. doi: 10.1038/d41573-020-00147-4. Nat Rev Drug Discov. 2020. PMID: 32811987 No abstract available.
  • Targeting translation.
    Wrighton KH. Wrighton KH. Nat Rev Neurosci. 2020 Oct;21(10):522-523. doi: 10.1038/s41583-020-0368-1. Nat Rev Neurosci. 2020. PMID: 32811989 No abstract available.

References

    1. de la Torre-Ubieta L, Won H, Stein JL, Geschwind DH. Advancing the understanding of autism disease mechanisms through genetics. Nature medicine. 2016;22:345–361. - PMC - PubMed
    1. O’Roak BJ, et al. Sporadic autism exomes reveal a highly interconnected protein network of de novo mutations. Nature. 2012;485:246–250. - PMC - PubMed
    1. Iossifov I, et al. De novo gene disruptions in children on the autistic spectrum. Neuron. 2012;74:285–299. - PMC - PubMed
    1. Yamasue H, Aran A, Berry-Kravis E. Emerging pharmacological therapies in fragile X syndrome and autism. Curr Opin Neurol. 2019 - PubMed
    1. Bolognani F, et al. A phase 2 clinical trial of a vasopressin V1a receptor antagonist shows improved adaptive behaviors in men with autism spectrum disorder. Science translational medicine. 2019;11 - PubMed

Publication types

MeSH terms