Review
. 2021 Jan;18(1):35-55.
doi: 10.1038/s41571-020-0408-9. Epub 2020 Aug 5.

ROS1-dependent cancers - biology, diagnostics and therapeutics

Affiliations
Review

ROS1-dependent cancers - biology, diagnostics and therapeutics

Alexander Drilon et al. Nat Rev Clin Oncol. 2021 Jan.

Abstract

The proto-oncogene ROS1 encodes a receptor tyrosine kinase with an unknown physiological role in humans. Somatic chromosomal fusions involving ROS1 produce chimeric oncoproteins that drive a diverse range of cancers in adult and paediatric patients. ROS1-directed tyrosine kinase inhibitors (TKIs) are therapeutically active against these cancers, although only early-generation multikinase inhibitors have been granted regulatory approval, specifically for the treatment of ROS1 fusion-positive non-small-cell lung cancers; histology-agnostic approvals have yet to be granted. Intrinsic or extrinsic mechanisms of resistance to ROS1 TKIs can emerge in patients. Potential factors that influence resistance acquisition include the subcellular localization of the particular ROS1 oncoprotein and the TKI properties such as the preferential kinase conformation engaged and the spectrum of targets beyond ROS1. Importantly, the polyclonal nature of resistance remains underexplored. Higher-affinity next-generation ROS1 TKIs developed to have improved intracranial activity and to mitigate ROS1-intrinsic resistance mechanisms have demonstrated clinical efficacy in these regards, thus highlighting the utility of sequential ROS1 TKI therapy. Selective ROS1 inhibitors have yet to be developed, and thus the specific adverse effects of ROS1 inhibition cannot be deconvoluted from the toxicity profiles of the available multikinase inhibitors. Herein, we discuss the non-malignant and malignant biology of ROS1, the diagnostic challenges that ROS1 fusions present and the strategies to target ROS1 fusion proteins in both treatment-naive and acquired-resistance settings.


Conflict of interest statement

Competing interests

A.D. has received honoraria from or participated on the advisory boards of 14ner/Elevation Oncology, Abbvie, ArcherDX, AstraZeneca, Beigene, BergenBio, Blueprint Medicines, Exelixis, Helsinn, Hengrui Therapeutics, Ignyta/Genentech/Roche, Loxo/Bayer/Lilly, Monopteros, MORE Health, Pfizer, Remedica, Takeda/Ariad/Millenium, TP Therapeutics, Tyra Biosciences and Verastem; research support paid to his institution from Exelixis, GlaxoSmithKlein, Pfizer, PharmaMar, Taiho and Teva; research support from Foundation Medicine; personal fees from Boehringer Ingelheim, Merck, Merus and Puma; and CME honoraria from Axis, Medscape, OncLive, Paradigm Medical Communications, Peerview Institute, PeerVoice, Physicians Education Resources, Research to Practice, Targeted Oncology and WebMD. The other authors declare no competing interests.

Figures

Fig. 1 |
Fig. 1 |. ROS1 gene, structure and signalling.
a | ROS1 is located on the minus strand of chromosomal region 6q22.1 (upper part), although the plus strand orientation is depicted here for simplicity and consists of 43 exons (lower part). The first 32 exons encode the extracellular region of ROS1, exon 33 encodes the single transmembrane (TM) domain and exons 36–41 encode the kinase domain (KD). b | The ROS1 receptor domain structure, predicted on the basis of homology with other proteins, consists of nine fibronectin type III motifs, three β-propeller (YWTD repeat) domains, a single TM domain and an intracellular tyrosine KD. In mice, neural epidermal growth factor–like like 2 (NELL2) has been shown to bind with mouse ROS1 in the epididymis and is presumed to mediate ROS1 homodimerization (as shown) or oligomerization, resulting in activation of the KD and autophosphorylation and thus in ROS1 signalling. Whether human NELL2 binds to the cognate ROS1 receptor in relevant tissues, such as the human lungs or testes, currently remains unknown. c | Cell signalling pathways induced by ROS1 catalytic activity include the RAS–RAF–MEK–ERK (MAPK), PI3K–AKT–mTOR, JAK–STAT3 and VAV3–RHO pathways. Autophosphorylation occurs at various tyrosine residues (Y1923, Y2110, Y2114, Y2115, Y2274 and Y2334) in the ROS1 intracellular domain, as detected by mass spectrometry. The precise docking sites for GRB2, SHC, SOS and p110 (PI3K) have not been clearly defined; however, phosphorylated Y2274 is a known docking site for the non-receptor tyrosine phosphatases SHP2 (PTPN6) and SHP1 (PTPN11). Phosphorylation of SHP2 on the canonical Y542 and Y580 sites by ROS1 enhances the catalytic activity of this phosphatase and facilitates the recruitment of additional SH2 domain-containing adaptor proteins, including GRB2 and SHIP1. VAV3, a guanine exchange factor for the small G protein RHO, is recruited to and phosphorylated by ROS1, resulting in RHO-mediated actin cytoskeletal remodelling. These pathways induce various cellular processes that generally promote cell survival, growth, proliferation, migration and invasiveness, all of which are implicated in oncogenesis.
Fig. 2 |
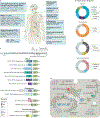
Fig. 2 |. ROS1 fusion structure and cellular location.
a | ROS1 fusions have been identified in several cancer types that occur in adults and/or children (shown on a body map). Upstream gene partners of ROS1 fusions found in specific cancer types are listed. Among these, CLIP1, KIF21A, ST13, TRIM24 and SLC6A17 (blue font) were identified within the cBioPortal database but have not been reported in peer-reviewed publications. In terms of the absolute number of patients affected, ROS1 fusions are most often found in non-small-cell lung cancers (NSCLCs) given the substantial global burden of this disease relative to that of other malignancies. According to data from the cBioPortal, 78% of patients found to have a ROS1 fusion in their cancer had lung adenocarcinoma, with other cancers accounting for the remaining 22%. The prevalence of ROS1 fusions is higher among certain rare cancers such as Spitzoid neoplasms and inflammatory myofibroblastic tumours (IMTs), which affect a smaller total number of patients as compared with NSCLC. The reported prevalence of ROS1 fusions is indicated for certain cancers in parentheses in the Figure. b | ROS1 fusion partner frequencies in ROS1-rearranged NSCLCs, adult glioblastomas, IMTs and Spitzoid neoplasms are shown in circular plots (percentages shown). Large-cohort studies are lacking for other cancer types, and frequency data are thus unavailable. See Supplementary Table 1 for data on median or aggregate frequencies for each cancer type. c | The locations of four major intronic breakpoints (within introns 31, 33, 34 or 35) that generate ROS1 fusions are indicated by arrows in the upper panel. The domain organization of recurrent ROS1 fusions in NSCLC, glioblastoma, IMT and Spitz tumours is shown in the lower panel. An intact ROS1 tyrosine kinase domain (KD) and the C-terminal domain (corresponding to exons 36–43) are included in all fusions. However, ROS1 fusions can also include a portion of the last fibronectin type III (FN) motif repeat (exon 32), the transmembrane (TM) domain (exon 33) and/or a portion of the juxtamembrane domain (exons 34 and 35) of ROS1; retention of portions of these domains does not seem to affect oncogenicity. The majority of NSCLC-associated ROS1 fusion partners lack dimerization motifs, suggesting that canonical dimerization might not be required for oncogenic activation. Distinct from the native receptor, ROS1 fusions might be activated simply by conformational changes induced by the removal of most of the extracellular domain and redirection of this activity to novel subcellular locations. d | The subcellular localizations of select ROS1 fusion proteins are depicted. CC, coiled-c oil domain; FERM, band 4.1 homology and ezrin–radixin–moesin domain; PDZ, PSD95, Dlg1 and ZO-1 domain.
Fig. 3 |
Fig. 3 |. Mechanisms of resistance to ROS1 TKIs.
a | The frequencies of ROS1-intrinsic and ROS1-extrinsic crizotinib resistance observed in clinical studies, (left) and in preclinical discovery experiments, (right) are plotted. Data on primary resistance to ROS1 tyrosine kinase inhibitor (TKI) therapy and the precise frequency of ROS1 mutations in patients pre-treated with TKIs are not well defined. In one series (Series A), only 1 of 12 patients (8%) with crizotinib-resistant cancers had a detectable ROS1 kinase domain (KD) mutation; however, in another series (Series B), 9 of 17 patients (53%) had KD mutations. The overall frequency and diversity of acquired ROS1 KD resistance mutations observed in preclinical studies is larger than those reported in clinical studies. In addition, within preclinical studies, limited overlap has been observed between the resistance mutations discovered in the context of the GOPC–ROS1 versus CD74–ROS1 fusions. With CD74–ROS1, the L1982F substitution occurred concurrently with M2128V and L2026M co-occurred with K2003I (not shown). Neither of these two pairs of co-mutations were functionally tested for their resistance potential when engineered in cis as compound mutations; however, both L1982F and L2026M confer crizotinib resistance as single mutations. Additional preclinical and clinical studies are needed to ascertain whether resistance mutation profiles vary by specific ROS1 fusion types owing to subtle conformational differences between them. b | The amino acid substitutions that were observed in the aforementioned clinical studies, (left) and preclinical saturated mutagenesis experiments, (right) are mapped onto the crystal structure of the ROS1 KD. Both S1986F and S1986Y substitutions have been reported, although only the S1986F substitution is shown. L2155S substitution (right panel) has been identified but has not been functionally validated. The ribbon diagram depicting the crystal structure of the ROS1 KD, in complex with crizotinib (orange), is adapted from PDB 3ZBF. The solvent front substitutions (G2032R, D2033N and L1951R) and other substitutions in the drug binding pocket (V2098I and L2026M) introduce steric hindrance and diminish high-affinity crizotinib binding. The reduced crizotinib affinity for S1986F/Y, L1947R, G1971E, E1935G and C2060G is either confirmed or likely to reflect other conformational changes within the kinase domain structure. c | Mechanisms of ROS1-extrinsic resistance include mutations and/or copy number increases involving other receptor tyrosine kinases (RTKs) or downstream MAPK pathway effectors (indicated in red), thus establishing MAPK pathway reactivation as a convergent mechanism of resistance. An activating PI3KCA mutation (blue) has been reported in a patient with ROS1 TKI resistance. CTNNB1 (β-catenin) mutations have also been discovered in patients but are not shown in this figure. LOF, loss of function.
Fig. 4 |
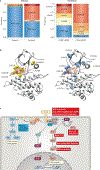
Fig. 4 |. Preclinical activity and binding modes of ROS1 TKIs.
a | A heatmap comparing the activity of type I and type II ROS1 tyrosine kinase inhibitors (TKIs) against ROS1 kinase domain (KD) substitution variants. Cell-based half maximal inhibitory concentration (IC50) values were obtained from eight studies that tested the activity of indicated ROS1 TKIs in CD74–ROS1-transformed Ba/F3 cells118–120,124,126,127,129,186 and from one study each for GOPC–ROS1-expressing or EZR–ROS1-expressing Ba/F3 cells. ΔIC50 was calculated as follows: IC50 (with the mutant fusion protein) – IC50 (with the wild-type fusion protein in the same study). Averages values of ΔIC50 were taken across studies that tested the same TKI in Ba/F3 cells transformed with the same ROS1 fusion (that is, separate averages for studies with CD74–ROS1 and those with GOPC–ROS1). Based on the correlation between preclinical inhibitory activity and the known clinical activity of a given inhibitor for the specific resistance mutation, we classified the changes in IC50 as follows: ΔIC50 ≤5 nM equates to a modestly altered TKI affinity but no resistance; ΔIC50 of 5–25 nM equates to intermediate resistance to the TKI; and ΔIC50 >25 nM equates to resistance. Negative ΔIC50 values indicate varying degrees of TKI sensitization to ROS1 substitutions. See Supplementary Figure 1 for comparative IC50 values of ROS1 inhibitors tested against different ROS1 fusions in the Ba/F3 cell model system. b | Structural model showing that crizotinib (red) preferentially binds to the active, type I (aspartate–phenylalanine–glycine (DFG)-in) conformation of the ROS1 KD (adapted from PDB 3ZBF). The atoms of the DFG motif are shown in stick configuration in purple. In the type I state, the aspartate of the DFG motif is optimally positioned to bind magnesium ions and coordinate the β and γ phosphates of ATP in order to facilitate transfer of the γ phosphate (type I inhibitors compete with ATP binding), and the phenylalanine is tucked into a hydrophobic pocket; the activation loop (A-loop, shown in purple) has an open and extended conformation. c | Molecular model showing ensemble docking of cabozantinib (black) to the type II (DFG-out) conformation of ROS1 KD, generated using computational chemistry as previously described,. Atoms of the DFG residues are shown in yellow (stick configuration). In the type II conformation, the phenylalanine (of DGF) is displaced from the hydrophobic pocket, leading to reorientation of the aspartate and causing steric hindrance to ATP binding. The A-loop (green) is collapsed onto the surface of the kinase. d | Superimposed structures of type I and type II ROS1 KD conformations docked with crizotinib and cabozantinib, respectively, were generated using MatchMaker analysis (Chimera). Expanded views to the right show steric incompatibility within the binding pocket of the DFG-in (type I) conformation for cabozantinib (upper inset panel) and of the DFG-out (type II) conformation for crizotinib (lower inset panel).
Fig. 5 |
Fig. 5 |. Clinical activity of ROS1 TKIs and potential treatment algorithm for ROS1-rearranged cancers.
a | A plot summarizing the activity of various ROS1 tyrosine kinase inhibitors (TKIs) tested in prospective trials involving patients with ROS1 fusion-positive non-small-cell lung cancer (NSCLC). The activity of early-generation and next-generation TKIs is compared in terms of objective response rate (ORR) and median progression-free survival (PFS). With TKIs for which only the ORR from a single trial is known based on preliminary data and the median PFS has not been reported, a dotted line indicates the preliminary ORR. For crizotinib, four separate studies (PROFILE 1001, OxOnc, EUCROSS and METROS) are shown. One outlier trial (AcSe) that had a much lower median PFS duration (5.5 months) than all reported prospective and retrospective (TABLE 1, Supplementary Table 3) studies has been excluded; the reason for the much shorter median PFS observed is unclear. b | A putative treatment algorithm for patients with ROS1 fusion-positive cancers. This begins with upfront ROS1 TKI therapy, which is the current standard of care for patients with advanced-stage ROS1-rearranged NSCLCs. Therapeutic choices for patients who are treatment naive with other ROS1-rearranged cancers should reflect known and emerging data. In patients treated upfront with a ROS1 TKI, sanctuary site distribution (for example, related to intracranial plasma concentration), other pharmacokinetic characteristics, binding mode and the spectrum of targets beyond ROS1 present competing evolutionary pressures that vary between different TKIs. Resistance to ROS1 TKIs can take the form of one or more of the following: sanctuary site progression, ROS1-intrinsic resistance (for example, a ROS1 kinase domain mutation) or ROS1-extrinsic resistance (for example, bypass signalling pathway activation). The presence and degree of intratumoural and intertumoural heterogeneity in resistance mechanisms might inform therapeutic choices. Current and potential future treatment strategies include TKI generation or type switching, the administration of chemotherapy and/or immunotherapy, and the combination of a ROS1 TKI with other types of therapy. In patients with ROS1-rearranged NSCLC that is resistant to an approved ROS1 TKI, chemotherapy and/or immunotherapy is the current standard of care treatment; however, sequential TKI therapy is being explored in trials. The combination of targeted therapy with chemotherapy has yet to be explored in prospective trials. This algorithm applies only to advanced-stage cancers, and the delineation of strategies for earlier-stage ROS1-rearranged disease will require additional study. Indeed, the role of neoadjuvant or adjuvant therapy that includes a ROS1 TKI has not been elucidated thus far, although this paradigm has received regulatory approval in certain other oncogene-d riven cancers (for example, adjuvant dabrafenib and trametinib for BRAF V600E/K-mutant melanomas).
Fig. 6 |
Fig. 6 |. ROS1 expression and ROS1 inhibitor safety profile.
a | A heat-map of mRNA expression shows that ROS1 is highly expressed in the human lung and, to a lesser degree, in the brain, kidney and testes. In addition to ROS1, levels of ALK, MET, NTRK1, NTRK2 and NTRK3 mRNA expression are shown for reference, given that all current ROS1 tyrosine kinase inhibitors (TKIs) also target one or more proteins encoded by these genes. Expression levels are shown in transcripts per million (TPM) values. These publicly available RNA sequencing (RNA-seq) data were obtained from the GTEx Portal. b | A Venn diagram (centre) depicting the spectrum of kinase inhibition of several ROS1 TKIs. Some of the adverse effects of selective TRK or MET inhibitors are known, whereas the profile of toxicities that are specifically mediated by ROS1 or ALK inhibition remains largely unknown. This knowledge gap is secondary to the fact that selective ROS1 or ALK inhibitors have not been developed (current inhibitors of these kinases have multiple other targets). By contrast, selective TRK or MET TKIs and monoclonal antibodies targeting MET have been tested in clinical trials. Beyond toxicities mediated by the inhibition of TRK or MET, adverse events observed across various TKI classes (left) and unique additional toxicities associated with certain TKIs (right) are listed.

References

    1. Birchmeier C, Sharma S & Wigler M Expression and rearrangement of the ROS1 gene in human glioblastoma cells. Proc. Natl Acad. Sci. USA 84, 9270–9274 (1987). - PMC - PubMed
    1. Sharma S et al. Characterization of the ros1-gene products expressed in human glioblastoma cell lines. Oncogene Res 5, 91–100 (1989). - PubMed
    1. Birchmeier C, O’Neill K, Riggs M & Wigler M Characterization of ROS1 cDNA from a human glioblastoma cell line. Proc. Natl Acad. Sci. USA 87, 4799–4803 (1990). - PMC - PubMed
    1. Charest A et al. Oncogenic targeting of an activated tyrosine kinase to the Golgi apparatus in a glioblastoma. Proc. Natl Acad. Sci. USA 100, 916–921 (2003). - PMC - PubMed
    1. Charest A et al. Fusion of FIG to the receptor tyrosine kinase ROS in a glioblastoma with an interstitial del(6) (q21q21). Genes Chromosomes Cancer 37, 58–71 (2003). - PubMed

Publication types