Ambient air pollution and cause-specific risk of hospital admission in China: A nationwide time-series study
- PMID: 32760064
- PMCID: PMC7410211
- DOI: 10.1371/journal.pmed.1003188
Ambient air pollution and cause-specific risk of hospital admission in China: A nationwide time-series study
Abstract
Background: The impacts of air pollution on circulatory and respiratory systems have been extensively studied. However, the associations between air pollution exposure and the risk of noncommunicable diseases of other organ systems, including diseases of the digestive, musculoskeletal, and genitourinary systems, remain unclear or inconclusive. We aimed to systematically assess the associations between short-term exposure to main air pollutants (fine particulate matter [PM2.5] and ozone) and cause-specific risk of hospital admission in China over a wide spectrum of human diseases.
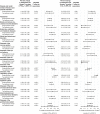
Methods and findings: Daily data on hospital admissions for primary diagnosis of 14 major and 188 minor disease categories in 252 Chinese cities (107 cities in North China and 145 cities in South China) from January 1, 2013, to December 31, 2017, were obtained from the Hospital Quality Monitoring System of China (covering 387 hospitals in North China and 614 hospitals in South China). We applied a 2-stage analytic approach to assess the associations between air pollution and daily hospital admissions. City-specific associations were estimated with quasi-Poisson regression models and then pooled by random-effects meta-analyses. Each disease category was analyzed separately, and the P values were adjusted for multiple comparisons. A total of 117,338,867 hospital admissions were recorded in the study period. Overall, 51.7% of the hospitalized cases were male, and 71.3% were aged <65 years. Robust positive associations were found between short-term PM2.5 exposure and hospital admissions for 7 major disease categories: (1) endocrine, nutritional, and metabolic diseases; (2) nervous diseases; (3) circulatory diseases; (4) respiratory diseases; (5) digestive diseases; (6) musculoskeletal and connective tissue diseases; and (7) genitourinary diseases. For example, a 10-μg/m3 increase in PM2.5 was associated with a 0.21% (95% CI 0.15% to 0.27%; adjusted P < 0.001) increase in hospital admissions for diseases of the digestive system on the same day in 2-pollutant models (adjusting for ozone). There were 35 minor disease categories significantly positively associated with same-day PM2.5 in both single- and 2-pollutant models, including diabetes mellitus, anemia, intestinal infection, liver diseases, gastrointestinal hemorrhage, renal failure, urinary tract calculus, chronic ulcer of skin, and back problems. The association between short-term ozone exposure and respiratory diseases was robust. No safety threshold in the exposure-response relationships between PM2.5 and hospital admissions was observed. The main limitations of the present study included the unavailability of data on personal air pollution exposures.
Conclusions: In the Chinese population during 2013-2017, short-term exposure to air pollution, especially PM2.5, was associated with increased risk of hospitalization for diseases of multiple organ systems, including certain diseases of the digestive, musculoskeletal, and genitourinary systems; many of these associations are important but still not fully recognized. The effect estimates and exposure-response relationships can inform policy making aimed at protecting public health from air pollution in China.
Conflict of interest statement
The authors have declared that no competing interests exist.
Figures


References
-
- Cohen AJ, Brauer M, Burnett R, Anderson HR, Frostad J, Estep K, et al. Estimates and 25-year trends of the global burden of disease attributable to ambient air pollution: an analysis of data from the Global Burden of Diseases Study 2015. Lancet. 2017;389(10082):1907–18. 10.1016/S0140-6736(17)30505-6 - DOI - PMC - PubMed
Publication types
MeSH terms
Substances
LinkOut - more resources
Full Text Sources
Medical
Molecular Biology Databases

