

FKBP5 Exacerbates Impairments in Cerebral Ischemic Stroke by Inducing Autophagy via the AKT/FOXO3 Pathway
- PMID: 32760250
- PMCID: PMC7374263
- DOI: 10.3389/fncel.2020.00193
FKBP5 Exacerbates Impairments in Cerebral Ischemic Stroke by Inducing Autophagy via the AKT/FOXO3 Pathway
Abstract
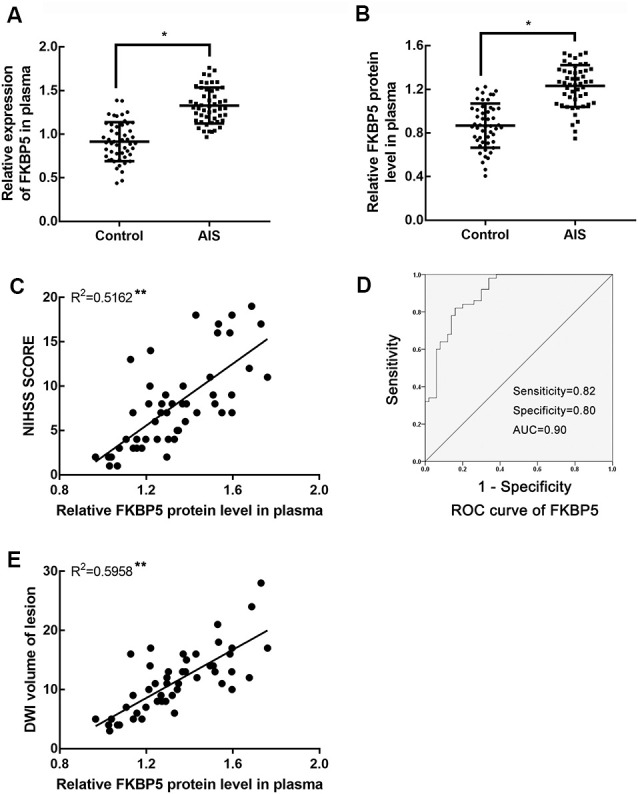
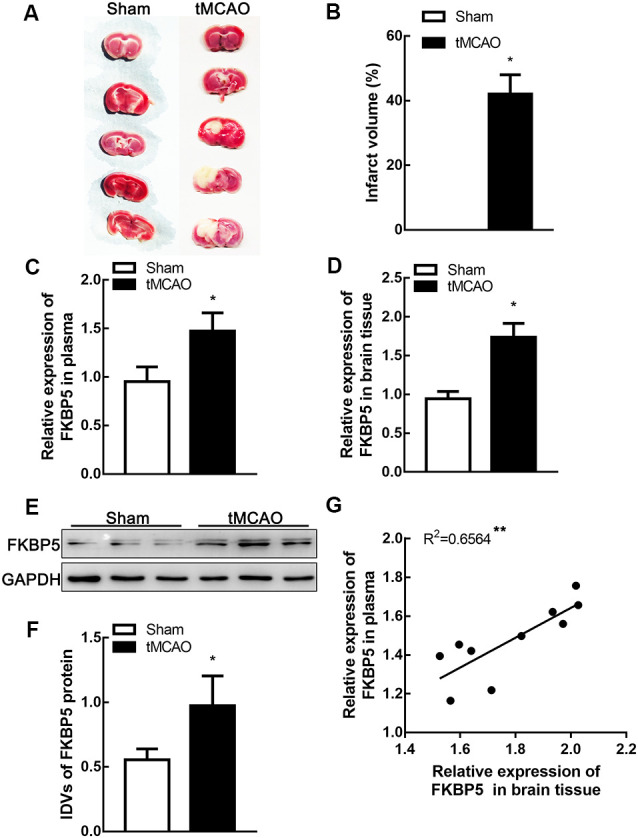
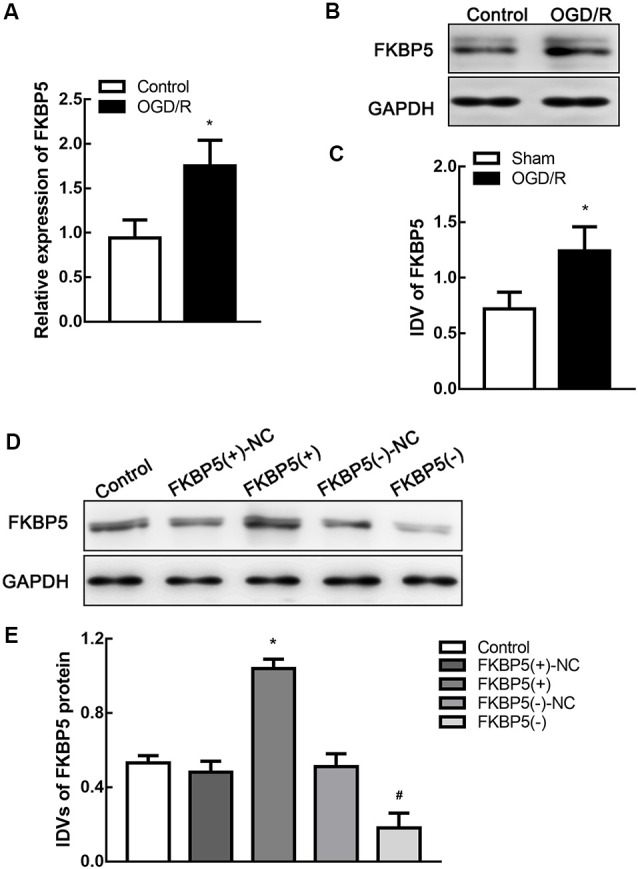
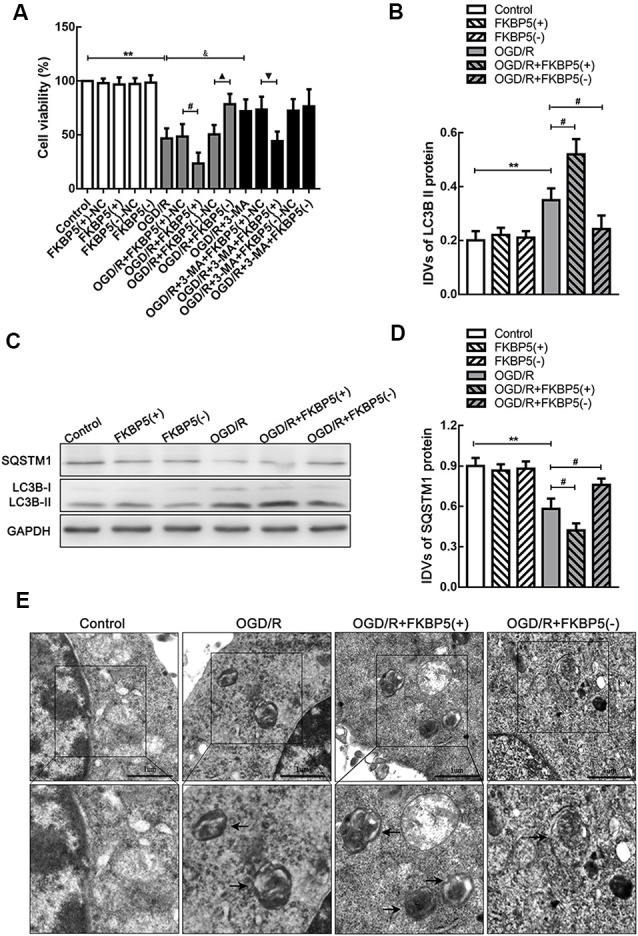
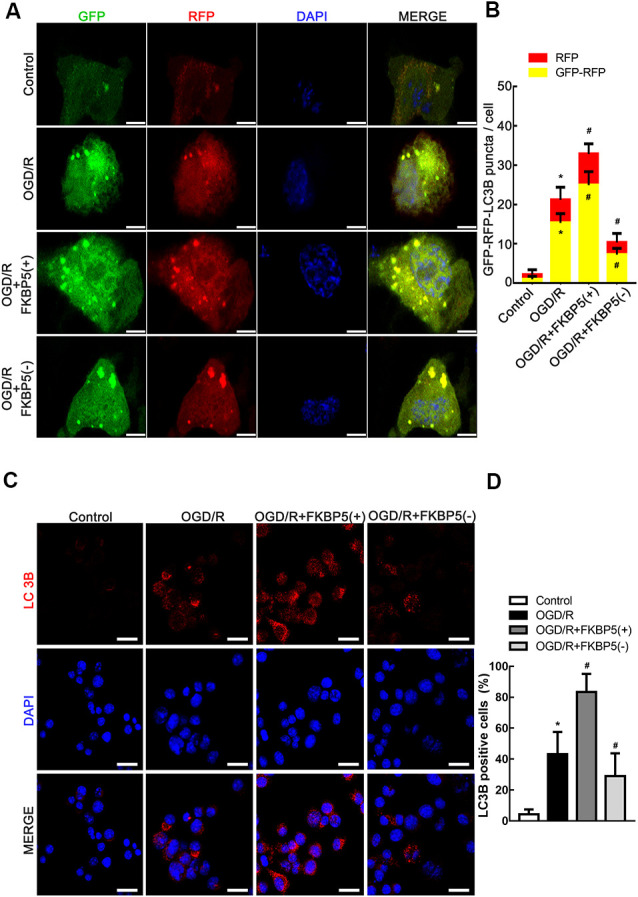
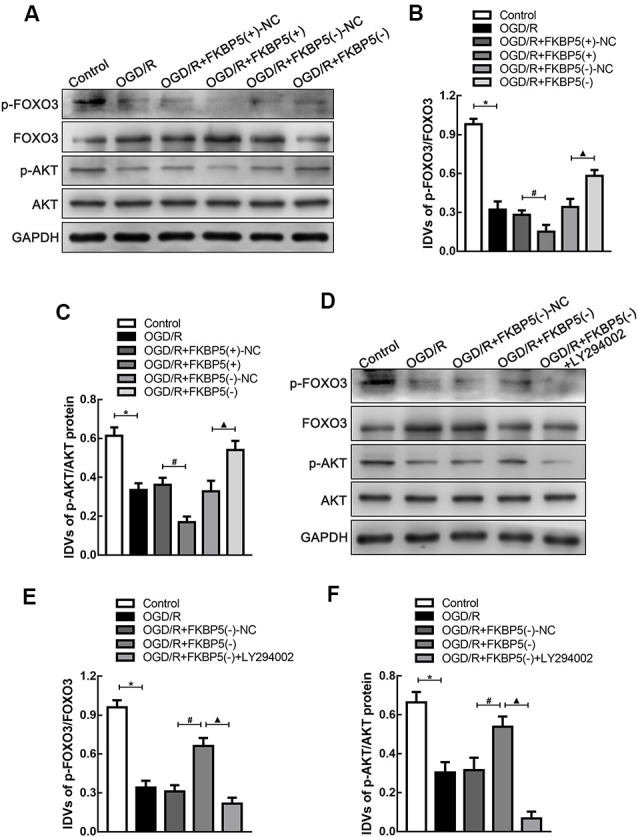
Cerebral ischemic stroke is regarded as one of the most serious diseases in the human central nervous system. The secondary ischemia and reperfusion (I/R) injury increased the difficulty of treatment. Moreover, the latent molecular regulating mechanism in I/R injury is still unclear. Based on our previous clinical study, we discovered that FK506 binding protein 5 (FKBP5) is significantly upregulated in patients, who suffered acute ischemic stroke (AIS), with high diagnostic value. Levels of FKBP5 were positively correlated with patients' neurological impairments. Furthermore, a transient middle cerebral artery occlusion (tMCAO) model of mice was used to confirm that FKBP5 expression in plasma could reflect its relative level in brain tissue. Thus, we hypothesized that FKBP5 participated in the regulation of cerebral I/R injury. In order to explore the possible roles FKBP5 acted, the oxygen and glucose deprivation and reoxygenation (OGD/R) model was established to mimic I/R injury in vitro. FKBP5 expressing levels were changed by plasmid stable transfection. The altered expression of FKBP5 influenced cell viability and autophagy after OGD/R injury notably. Besides, AKT/FOXO3 cascade was involved in the FKBP5-regulating process. In the present study, FKBP5 was verified upregulated in cerebral I/R injury, related to the severity of ischemia and reperfusion injury. Additionally, our analyses revealed that FKBP5 regulates autophagy induced by OGD/R via the downstream AKT/FOXO3 signaling pathway. Our findings provide a novel biomarker for the early diagnosis of ischemic stroke and a potential strategy for treatment.
Keywords: FKBP5; FOXO3; autophagy; cerebral ischemic stroke; ischemia and reperfusion injury.
Copyright © 2020 Yu, Yu, Bu, He and Feng.
Figures
Similar articles
-
Expression and regulation of miR-449a and AREG in cerebral ischemic injury.Metab Brain Dis. 2019 Jun;34(3):821-832. doi: 10.1007/s11011-019-0393-9. Epub 2019 Feb 18. Metab Brain Dis. 2019. PMID: 30773606
-
KCNQ1OT1 promotes autophagy by regulating miR-200a/FOXO3/ATG7 pathway in cerebral ischemic stroke.Aging Cell. 2019 Jun;18(3):e12940. doi: 10.1111/acel.12940. Epub 2019 Apr 3. Aging Cell. 2019. PMID: 30945454 Free PMC article.
-
LncRNA SNHG12 as a potent autophagy inducer exerts neuroprotective effects against cerebral ischemia/reperfusion injury.Biochem Biophys Res Commun. 2019 Jun 25;514(2):490-496. doi: 10.1016/j.bbrc.2019.04.158. Epub 2019 May 2. Biochem Biophys Res Commun. 2019. PMID: 31056262
-
Activation of the Akt/FoxO3 signaling pathway enhances oxidative stress-induced autophagy and alleviates brain damage in a rat model of ischemic stroke.Can J Physiol Pharmacol. 2023 Jan 1;101(1):18-26. doi: 10.1139/cjpp-2022-0341. Epub 2022 Oct 31. Can J Physiol Pharmacol. 2023. PMID: 36315971
-
Crosstalk Between Autophagy and Cerebral Ischemia.Front Neurosci. 2019 Jan 14;12:1022. doi: 10.3389/fnins.2018.01022. eCollection 2018. Front Neurosci. 2019. PMID: 30692904 Free PMC article. Review.
Cited by
-
MicroRNA-379-5p targets MAP3K2 to reduce autophagy and alleviate neuronal injury following cerebral ischemia via the JNK/c-Jun signaling pathway.Kaohsiung J Med Sci. 2022 Mar;38(3):230-243. doi: 10.1002/kjm2.12488. Epub 2021 Dec 21. Kaohsiung J Med Sci. 2022. PMID: 34931755 Free PMC article.
-
Attenuating Neuronal Autophagy Alleviates Inflammatory Injury in OGDDeprived Co-culture of HT22 with BV2.Acta Naturae. 2023 Jul-Sep;15(3):91-99. doi: 10.32607/actanaturae.11830. Acta Naturae. 2023. PMID: 37908770 Free PMC article.
-
New insights into the interplay between autophagy and oxidative and endoplasmic reticulum stress in neuronal cell death and survival.Front Cell Dev Biol. 2022 Sep 16;10:994037. doi: 10.3389/fcell.2022.994037. eCollection 2022. Front Cell Dev Biol. 2022. PMID: 36187470 Free PMC article. Review.
-
A novel link between silent information regulator 1 and autophagy in cerebral ischemia-reperfusion.Front Neurosci. 2022 Nov 23;16:1040182. doi: 10.3389/fnins.2022.1040182. eCollection 2022. Front Neurosci. 2022. PMID: 36507335 Free PMC article. Review.
-
The forkhead box O3 (FOXO3): a key player in the regulation of ischemia and reperfusion injury.Cell Mol Life Sci. 2023 Mar 20;80(4):102. doi: 10.1007/s00018-023-04755-2. Cell Mol Life Sci. 2023. PMID: 36939886 Free PMC article. Review.
References
-
- Chen R. L., Nagel S., Papadakis M., Bishop T., Pollard P., Ratcliffe P. J., et al. . (2012). Roles of individual prolyl-4-hydroxylase isoforms in the first 24 hours following transient focal cerebral ischaemia: insights from genetically modified mice. J. Physiol. 590, 4079–4091. 10.1113/jphysiol.2012.232884 - DOI - PMC - PubMed
LinkOut - more resources
Full Text Sources
Research Materials
Miscellaneous