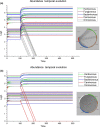
. 2020 Jun 18;10(14):7062-7072.
doi: 10.1002/ece3.6408. eCollection 2020 Jul.

Testing for top-down cascading effects in a biomass-driven ecological network of soil invertebrates

Affiliations

Testing for top-down cascading effects in a biomass-driven ecological network of soil invertebrates

Erminia Conti et al. Ecol Evol. .

Abstract

To investigate the structural changes of a food-web architecture, we considered real data coming from a soil food web in one abandoned pasture with former low-pressure agriculture management and we reproduced the corresponding ecological network within a multi-agent fully programmable modeling environment in order to simulate dynamically the cascading effects due to the removal of entire functional guilds.We performed several simulations differing from each other for the functional implications. At the first trophic level, we simulated a removal of the prey, that is, herbivores and microbivores, while at the second trophic level, we simulated a removal of the predators, that is, omnivores and carnivores. The five main guilds were removed either separately or in combination.The alteration in the food-web architecture induced by the removal of entire functional guilds was the highest when the entire second trophic level was removed, while the removal of all microbivores caused an alteration in the food-web structure of less than 5% of the total changes due to the removal of opportunistic and predatory species.Omnivores alone account for the highest shifts in time of the numerical abundances of the remaining species, providing computational evidence of the importance of the degree of omnivory in the stabilization of soil biota.

Keywords: ecological network; functional biodiversity; lotka–volterra; multiple prey–predator model; soil food webs; temporal simulation.


Conflict of interest statement

The authors declare no competing interest.

Figures
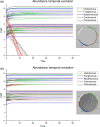
FIGURE 1
FIGURE 1
Graphic representation of the simulation results (a) without interaction (β = 0), upper panel, or (b) with interaction (β = 1), lower panel. Left, the temporal evolutions of species abundances are shown [50 time steps]. Right, the representation of the food web at the end of the simulation as interaction network of the soil invertebrates in the investigated area: Each line is an expected link between the organisms belonging to the first trophic level (primary consumers, being herbivorous, fungivorous, or bacterivorous invertebrates, or a combination of them, i.e., generalists) and the organisms belonging to the second trophic level (secondary consumers, either carnivorous or predatory omnivorous invertebrates)
FIGURE 2
FIGURE 2
Graphic representation of the simulation results in the case all herbivores (a), bacterivores (b), or fungivores (c) are removed from the ecosystem. Left, the temporal evolutions of species abundances and right, the representations of the food web at the end of these three simulations [for the upper two panels, the first 500 time steps are shown; in the lower panel, fluctuations occur after 700 time steps]
FIGURE 3
FIGURE 3
Graphic representations in the case all herbivores and fungivores (a), all herbivores and bacterivores (b), or all fungivores and bacterivores (c) are removed from the ecosystem. Left, the temporal evolution of species abundances and right, the representations of the food web at the end of the three simulations [note the different time steps on the horizontal axes]
FIGURE 4
FIGURE 4
Graphic representation in the case all omnivores (a) or carnivores (b) are removed from the ecosystem. Left, the temporal evolutions of species abundances [500 time steps] and right, the representations of the food web at the end of these two simulations
FIGURE 5
FIGURE 5
Graphic representation in the case all omnivores and carnivores are removed together from the ecosystem. Left is shown the temporal evolution of species abundances [500 time steps] and right the representation of the food web at the end

References

    1. Barnosky, A. D. , Hadly, E. A. , Bascompte, J. , Berlow, E. L. , Brown, J. H. , Fortelius, M. , … Smith, A. B. (2012). Approaching a state shift in Earth’s biosphere. Nature, 486, 52–58. 10.1038/nature11018 - DOI - PubMed
    1. Barnosky, A. D. , Matzke, N. , Tomiya, S. , Wogan, G. O. U. , Swartz, B. , Quental, T. B. , … Ferrer, E. A. (2011). Has the Earth’s sixth mass extinction already arrived? Nature, 471, 51–57. 10.1038/nature09678 - DOI - PubMed
    1. Borrvall, C. , Ebenman, B. , & Jonsson, T. (2000). Biodiversity lessens the risk of cascading extinction in model food webs. Ecology Letters, 3, 131–136. 10.1046/j.1461-0248.2000.00130.x - DOI
    1. Bourne, P. E. , Brenner, S. E. , & Eisen, M. B. (2005). PLoS Computational Biology: A new community journal. PLoS Computational Biology, 1(1), e4 10.1371/journal.pcbi.0010004 - DOI - PMC - PubMed
    1. Brose, U. , Archambault, P. , Barnes, A. D. , Bersier, L.‐F. , Boy, T. , Canning‐Clode, J. , … Iles, A. C. (2019). Predator traits determine food‐web architecture across ecosystems. Nature Ecology & Evolution, 3, 919–927. 10.1038/s41559-019-0899-x - DOI - PubMed

LinkOut - more resources