. 2020 Jun 23;10(14):7509-7524.
doi: 10.1002/ece3.6477. eCollection 2020 Jul.

Advancing biodiversity assessments with environmental DNA: Long-read technologies help reveal the drivers of Amazonian fungal diversity

Affiliations

Advancing biodiversity assessments with environmental DNA: Long-read technologies help reveal the drivers of Amazonian fungal diversity

Camila D Ritter et al. Ecol Evol. .

Abstract

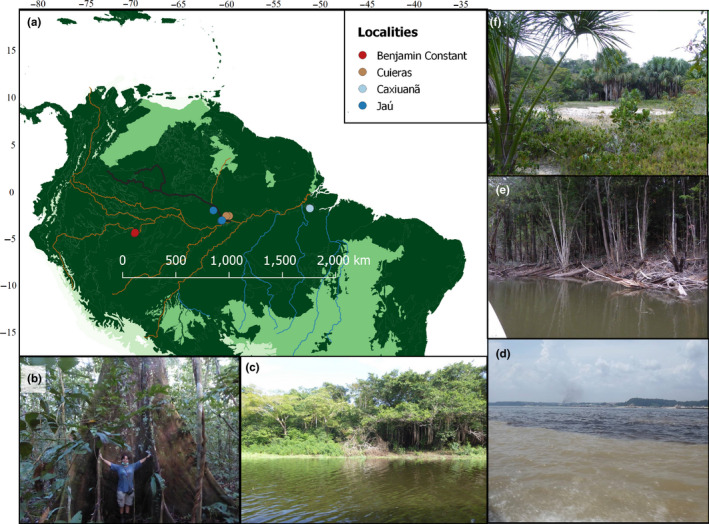
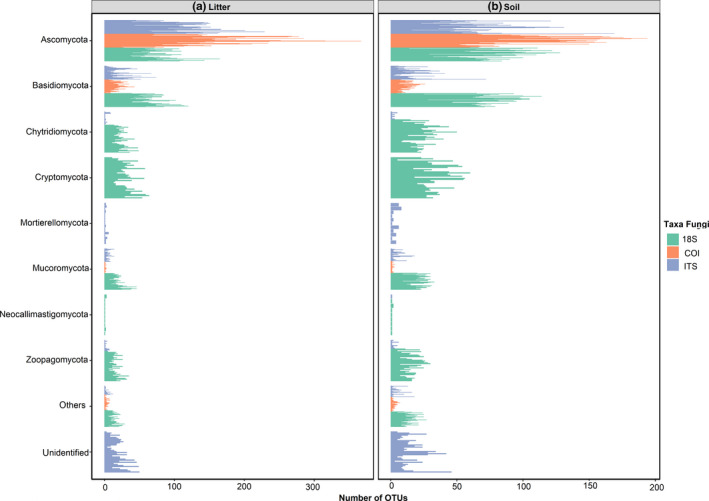
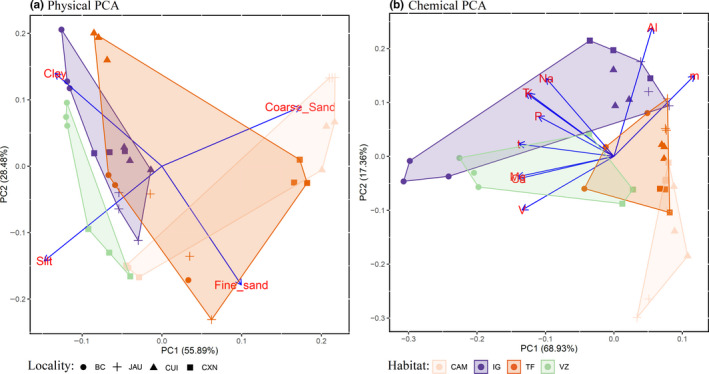
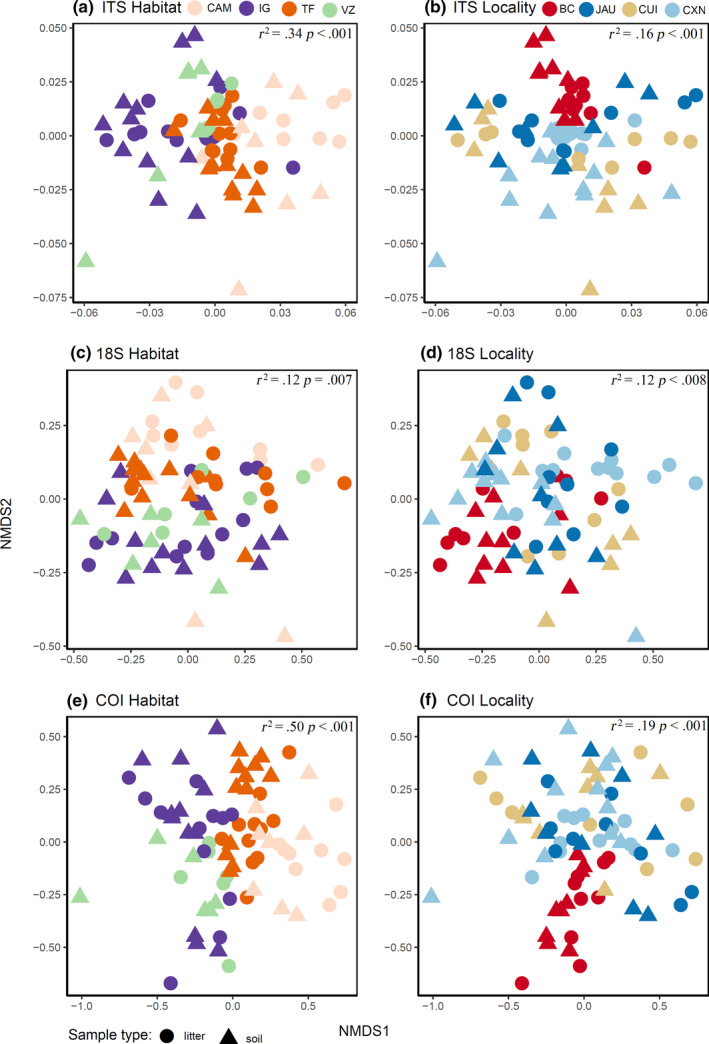
Fungi are a key component of tropical biodiversity. However, due to their inconspicuous and largely subterranean nature, they are usually neglected in biodiversity inventories. The goal of this study was to identify the key determinants of fungal richness, community composition, and turnover in tropical rainforests. We tested specifically for the effect of soil properties, habitat, and locality in Amazonia. For these analyses, we used high-throughput sequencing data of short and long reads of fungal DNA present in soil and organic litter samples, combining existing and novel genomic data. Habitat type (phytophysiognomy) emerges as the strongest factor explaining fungal community composition. Naturally open areas-campinas-are the richest habitat overall. Soil properties have different effects depending on the soil layer (litter or mineral soil) and the choice of genetic marker. We suggest that campinas could be a neglected hotspot of fungal diversity. An underlying cause for their rich diversity may be the overall low soil fertility, which increases the reliance on biotic interactions essential for nutrient absorption in these environments, notably ectomycorrhizal fungi-plant associations. Our results highlight the advantages of using both short and long DNA reads produced through high-throughput sequencing to characterize fungal diversity. While short reads can suffice for diversity and community comparison, long reads add taxonomic precision and have the potential to reveal population diversity.

Keywords: PacBio; environmental DNA; high‐throughput sequencing; metabarcoding; neotropical biodiversity; third‐generation sequencing.


Conflict of interest statement

The authors declare no conflict of interest.

Figures

FIGURE 1
FIGURE 1
Map of sampling localities and habitats. (a) Northern South America, where dark green represents forest biomes and light green open vegetation biomes, as delimited by Dinerstein et al. (2017). The rivers are colored by the type of water: Brown represents white‐water rivers, black is the Negro river, and blue represents clear water rivers. Circles represent the main localities sampled; (b) Terra‐firme forest with the lead author as size reference; (c) Várzea forest showing the white‐water river; (d) The confluence of the Amazon (white water) and Negro (black water) rivers; (e) Igapó forest showing a black water river; and (f) Campina showing the white sand soil. Map produced in Qgis (Pereira et al., 2019)
FIGURE 2
FIGURE 2
Number of OTUs by fungal phylum. Each bar is the number of OTUs in each plot in (a) litter samples and (b) soil samples. The colors represent the different molecular markers sequenced for this study. All datasets are dominated by Ascomycota, followed by Basidiomycota
FIGURE 3
FIGURE 3
Physical and chemical soil similarity of sample sites across Amazonia. The figure shows the study sites colored by habitat type on the first two axes of a principle component analysis for (a) physical properties (silt, clay, and sand categorized in fine and coarse fractions) and (b) chemical proprieties: phosphorus (P), exchangeable bases (Na, K, Ca, and Mg), exchangeable aluminum (Al), saturation index by aluminum (m), base saturation index (V), effective cation exchange capacity (t), and cation exchange capacity (T). The symbols represent the localities, in the west‐to‐east order: Benjamin Constant (BC), Jaú (JAU), Cuieras (CUI), and Caxiuanã (CXN). The blue rows show the values of each variable's loading in the two first PC axes. For the physical PCA, we found that flooded forests (igapós and várzeas) are associated more fine soil texture (silt and clay), with a wider spread of terra‐firme and campinas. For the chemical PCA, the positive end of the first PC axis, which represents low‐fertility soils, is occupied by a campinas group, followed by terra‐firmes
FIGURE 4
FIGURE 4
Community structure related to substrate type (litter and soil), locality, and habitat type. Visualization of differences in OTU composition (assessed through abundance matrices using the Jaccard dissimilarity index) using nonmetric multi‐dimensional scaling (NMDS) for (a) ITS by habitat, (b) ITS by locality, (c) 18S by habitat, (d) 18S by locality, (e) COI by habitat, and (f) COI by locality. Circles represent litter samples and triangles soil samples. Both the habitat and the locality factor were statistically significant (EnvFit test). The R 2 and p values of each test are provided inside each subfigure. The strongest and most significant separation is observed between habitat types
FIGURE 5
FIGURE 5
Venn diagrams showing the number of exclusive and shared OTUs for localities (a), habitats (b), and sample type (c) in the 18S dataset; for localities (d), habitats (e), and sample type (f) in the COI dataset; and for localities (g), habitats (h), and sample type (i) in the ITS dataset

References

    1. Abarenkov, K. , Henrik Nilsson, R. , Larsson, K. H. , Alexander, I. J. , Eberhardt, U. , Erland, S. , … Sen, R. (2010). The UNITE database for molecular identification of fungi – Recent updates and future perspectives. New Phytologist, 186, 281–285. - PubMed
    1. Adeney, J. M. , Christensen, N. L. , Vicentini, A. , & Cohn‐Haft, M. (2016). White‐sand ecosystems in Amazonia. Biotropica, 48, 7–23.
    1. Anslan, S. , Bahram, M. , Hiiesalu, I. , & Tedersoo, L. (2017). PipeCraft: Flexible open‐source toolkit for bioinformatics analysis of custom high‐throughput amplicon sequencing data. Molecular Ecology Resources, 17, e234–e240. 10.1111/1755-0998.12692 - DOI - PubMed
    1. Antonelli, A. , Zizka, A. , Carvalho, F. A. , Scharn, R. , Bacon, C. D. , Silvestro, D. , & Condamine, F. L. (2018). Amazonia is the primary source of Neotropical biodiversity. Proceedings of the National Academy of Sciences of the United States of America, 115, 6034–6039. - PMC - PubMed
    1. Arbizu, M. , & PairwiseAdonis, P. (2020). Pairwise Multilevel Comparison Using adonis. R Packag. Version 0.4.

LinkOut - more resources