. 2020 Jul 14:8:531.
doi: 10.3389/fcell.2020.00531. eCollection 2020.

Pds5A and Pds5B Display Non-redundant Functions in Mitosis and Their Loss Triggers Chk1 Activation

Affiliations

Pds5A and Pds5B Display Non-redundant Functions in Mitosis and Their Loss Triggers Chk1 Activation

Naif Al-Jomah et al. Front Cell Dev Biol. .

Abstract

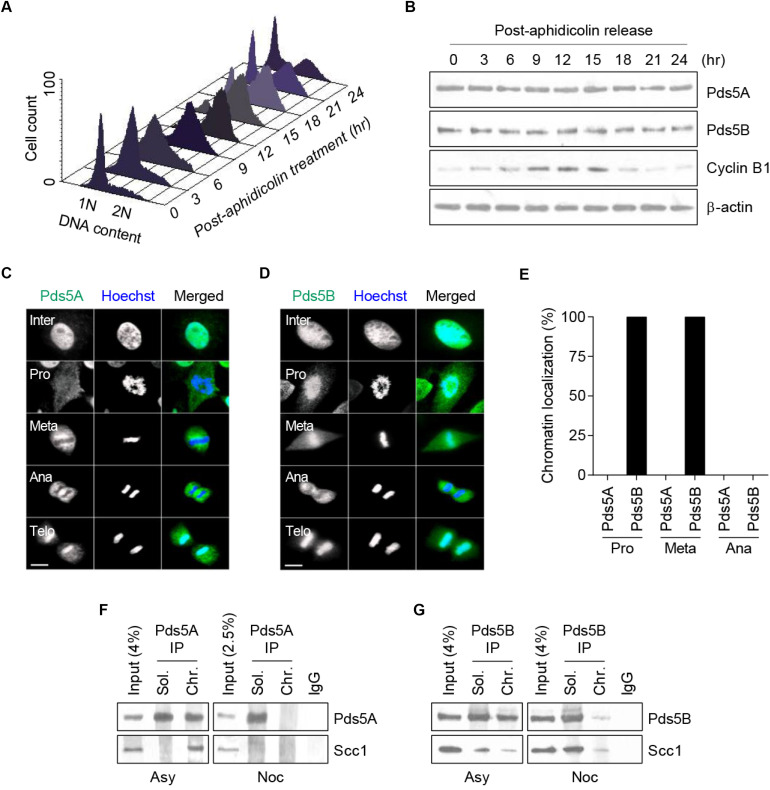
Background: Pds5 is an abundant HEAT-repeat-containing protein that binds to cohesin and mediates sister chromatid cohesion. In vertebrates, Pds5A and Pds5B are known to protect DNA replication fork, as their loss leads to DNA damage. Pds5 interacts directly with Wapl, to remove cohesin during mitosis.

Aim: To analyze the effects of the loss of Pds5 proteins-mediated DNA damage on the cell cycle checkpoints and to examine the possibility that Pds5 proteins have an overlapping function.

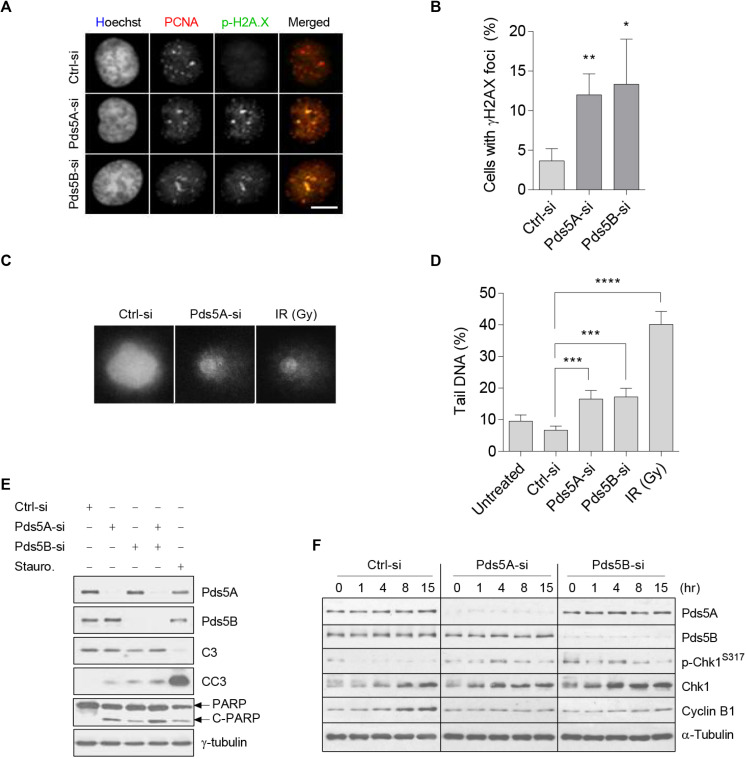
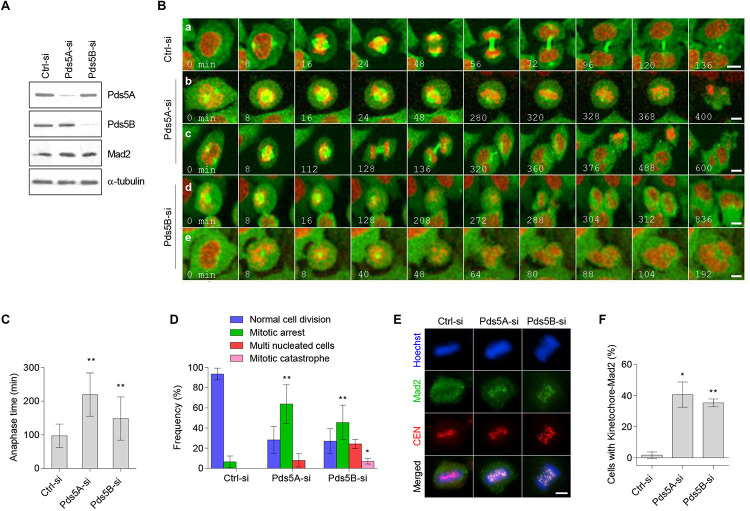
Methods: We first analyzed the cell cycle regulation of Pds5 proteins and defects in S-phase; DNA damage was confirmed after Pds5A/B knockdown. The activation of cell cycle checkpoints and apoptosis were examined by the level of p-Chk1S317, MAD2 localization, and the level of pro-apoptotic markers, respectively.

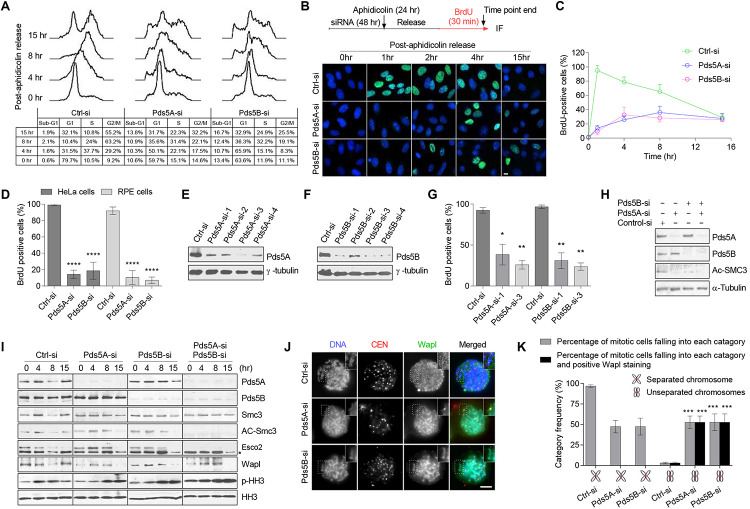
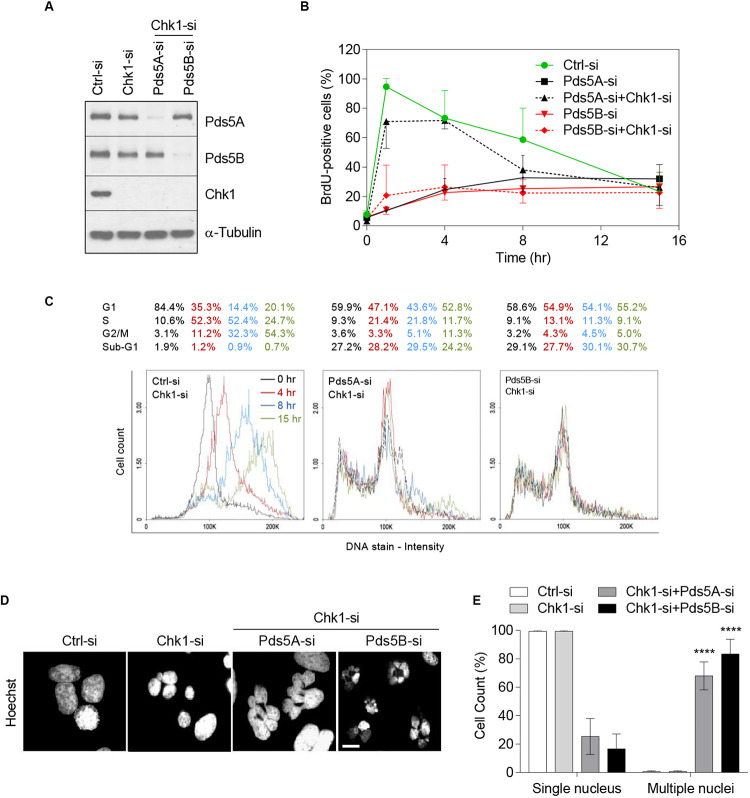
Results: Pds5 proteins dissociated from chromatin in a stepwise manner, and their loss led to activation of pro-apoptotic markers associated with the phosphorylation of Chk1S317 due to DNA damage. Depletion of either Pds5A or Pds5B alone increased Smc3 acetylation in perturbed cell cycle, while depletion of both proteins severely impaired Smc3 acetylation. Moreover, the loss of Pds5A/Pds5B activated the SAC in an ATR-Chk1-dependent manner and stabilized Wapl on chromatin. The depletion of Chk1 rescued the S-phase delay associated with Pds5 depletion and significantly increased mitotic catastrophe.

Conclusion: Pds5A and Pds5B display overlapping functions in facilitating Smc3 acetylation. Somewhat paradoxically, they also have non-redundant functions in terms of cohesin removal due to the activated surveillance mechanism that leads to phosphorylation of Chk1S317.

Keywords: ATR; Chk1; DNA damage; Pds5A; Pds5B; cohesin; mitosis; spindle assembly checkpoints.


Figures

FIGURE 1
FIGURE 1
Analysis of endogenous Pds5A and Pds5B expression and intracellular distribution during HeLa cell cycle. (A) HeLa cells were synchronized in the G1/S phase by aphidicolin block and release and were analyzed by FACS at a series of time points. (B) Total protein extracts were prepared at the indicated time points and analyzed by western blot against Pds5A, Pds5B, cyclin B1, and actin. (C,D) Immunofluorescence microscopy images showing the intracellular distribution of Pds5A and Pds5B (green) at different stages of the cell cycle. DNA was stained with Hoechst 33342 (blue). Merged images are shown (right panel). Scale bar: 8 μm. This figure is representative of three independent experiments. (E) Histogram showing the percentage of cells showing the differential disassociation of Pds5A and Pds5B during mitosis. (F,G) Soluble and chromatin fractions from asynchronous and nocodazole-arrested HeLa cells were subjected to Pds5A or Pds5B immunoprecipitation and were analyzed by western blot against Pds5A, Pds5B, and Scc1.
FIGURE 2
FIGURE 2
Pds5A and Pds5B have overlapping functions in S-phase but distinct roles in mitosis. (A) FACS analysis of Pds5-depleted HeLa cells at the indicated time points following release from G1/S-phase arrest. (B) The experimental scheme is shown (top). Immunofluorescence images of Pds5-depleted HeLa cells labeled with BrdU for 30 min before the end of the indicated time point after release from G1/S-phase arrest. DNA was stained with Hoechst 33342 (blue). Scale bar: 10 μm. (C) Graph showing quantitation of the data shown in (B). At least 100 cells were counted in randomly selected fields. Each point represents the mean ± SEM of three independent experiments. (D) Histogram showing the percentage of BrdU-positive cells. Exponentially growing HeLa and RPE cells were labeled with BrdU for 30 min after 48 h from transfection with 50 nM control-si, Pds5A-si, or Pds5B-si. At least 100 cells were counted in randomly selected fields. Data represent the mean ± SEM of three independent experiments: ****p < 0.0001. P-values were calculated using two-way ANOVA. (E,F) HeLa cells were separately transfected with individual siRNAs directed against Pds5A or Pds5B for 48 h. Total cell extracts were prepared and subjected to immunoblotting analysis using antibodies against the indicated proteins. (G) Histogram showing the percentage of BrdU-positive cells following individual siRNAs treatment. Mean values ± SD of measurements are from at least 100 cells from three independent experiments: *p < 0.05; **p < 0.01. P-values were calculated using two-way ANOVA. (H) Reduction of Ac-Smc3 was determined by immunoblotting analysis of total cell lysates prepared from HeLa cells after depletion of Pds5 proteins. (I) Immunoblotting analysis of chromatin-associated protein fractions was prepared from synchronized HeLa cells at the G1/S-phase with aphidicolin for 24 h after depletion of Pds5A, Pds5B, and both. Phospho-histone H3 (PHH3) was used as a marker for mitosis. Asterisk indicates a nonspecific band. (J) Representative immunofluorescence microscopy images showing the distribution of Wapl in HeLa cells arrested at mitosis with 10 μM Taxol after depletion of Pds5A or Pds5B by siRNA; enlarged images are shown in the insets. Scale bar: 8 μm. (K) Histogram indicating the frequency of Wapl localization along unresolved chromosome arms after depletion of Pds5A or Pds5B. Mean values ± SD of measurements from at least 100 cells from three independent experiments: ***p < 0.001. P values were calculated using two-way ANOVA.
FIGURE 3
FIGURE 3
Loss of Pds5A and Pds5B-induced DNA damage, Chk1 phosphorylation, and apoptosis. (A) Immunofluorescence images of Pds5-depleted cells showing the phosphorylation and foci formation of histone H2AX (green) that co-localizes with PCNA (red). DNA was stained with Hoechst 33342 (blue). Merged images are shown on the right. Scale bar: 8 μm. (B) Histogram indicating the percentage of cells with phospho-histone H2AX foci, with the mean ± SEM of at least 100 cells from three independent experiments shown: **p < 0.01; *p < 0.05. P-values were calculated using a two-tailed Students t-test. (C) Comet images of propidium iodide (1 mg/ml)-labeled HeLa cells following a 48 h treatment with 50 nM of either control-si or Pds5A-si. Similar results were obtained with cells depleted of the Pds5B protein. Cells were mixed with low melting point agarose prior to electrophoresis in ice-cold alkali buffer at 30 V, 300 mA for 20 min. Control cells were also X-ray-irradiated (10 Gy). Scale bar: 10 μm. (D) Histogram showing quantitation of data in (C). The DNA damage is expressed as the percentage of DNA in the comet tails. The mean ± SEM of at least 100 cells scored in randomly selected fields from three independent experiments are shown: **p < 0.01; ***p < 0.001; ****p < 0.0001. P values were calculated using a two-tailed Student’s t-test. (E) Western blot analysis of Pds5-depleted cell lysates with antibodies against Pds5A, Pds5B, caspase-3, cleaved caspase-3, PARP, cleaved PARP, and γ-tubulin. Parallel cells were treated with 1 μM of staurosporine for 6 h to induce apoptosis. (F) Western blot detection of p-Chk1S317 in response to DNA stress. Total protein extracts were prepared from synchronized control cells and Pds5A- or Pds5B-depleted cells at the G1/S phase and released for the indicated time points.
FIGURE 4
FIGURE 4
Time-lapse confocal microscopy of Pds5A- and Pds5B-depleted cells. HeLa cells stably expressing mCherry-histone H2B and α-tubulin-EGFP were transfected with the control, Pds5A-si, or Pds5B-si. After 48 h, cells were subjected to immunoblotting analysis with the indicated antibodies (A), or they were analyzed by time lapse recording and imaged every 8 min to monitor their progression through mitosis (B). (B) Selected images depicted from prophase; time is shown in min: (a) control-si; (b) prolonged metaphase arrest; (c,d) defective anaphase and generation of cells with multiple nuclei; (e) mitotic catastrophe. (C) Histogram representing the anaphase time in Pds5A- and Pds5B-depleted cells in comparison with the control. Mean values ± SD are shown: **p < 0.01. P-values were calculated using one-way ANOVA. (D) Quantification of the cell cycle defects seen in (B). Mean values ± SD of counts from four independent experiments are shown: **p < 0.01; *p < 0.05. P-values were calculated using two-way ANOVA. (E) Immunofluorescence microscopy images showing the co-localization of Mad2 with kinetochore at the metaphase in HeLa cells depleted of Pds5A and Pds5B. Scale bar: 8 μm. (F) Histogram showing the percentage of the cells indicating co-localization of Mad2 with kinetochore at metaphase in HeLa cells depleted of Pds5A and Pds5B, with mean values ± SD from three independent experiments shown: **p < 0.01; *p < 0.05. P-values were calculated using the Student’s t-test.
FIGURE 5
FIGURE 5
Chk1 depletion rescues the delay in DNA replication caused by the loss of Pds5 proteins and increases mitotic catastrophe. HeLa cells were treated with siRNA targeting Chk1 alone or both Chk1 and Pds5A or Pds5B, and were either subjected to immunoblotting analysis for Pds5A, Pds5B, and Chk1 (A), or were synchronized at the G1/S phase and then collected at the indicated time points for BrdU quantification (B). (C) FACS analysis to monitor S-phase progression in synchronized HeLa cells depleted of Chk1 alone or both Chk1 and Pds5A or Pds5B. (D) Immunofluorescence staining of cells undergoing mitotic catastrophe after co-transfection with Chk1 and Pds5A-si or Pds5B-si. Scale bar: 10 μm. (E) Histogram showing the percentages of mitotic catastrophe seen in (D). Mean values ± SD of the measurements from at least 100 cells from three independent experiments are shown: ****p < 0.0001. P-values were calculated using two-way ANOVA.

References

    1. Bodnar A. G., Ouellette M., Frolkis M., Holt S. E., Chiu C. P., Morin G. B., et al. (1998). Extension of life-span by introduction of telomerase into normal human cells. Science 279 349–352. 10.1126/science.279.5349.349 - DOI - PubMed
    1. Boulton S. J. (2006). Cellular functions of the BRCA tumour-suppressor proteins. Biochem. Soc. Trans. 34 633–645. 10.1042/bst0340633 - DOI - PubMed
    1. Brough R., Bajrami I., Vatcheva R., Natrajan R., Reis-Filho J. S., Lord C. J., et al. (2012). APRIN is a cell cycle specific BRCA2-interacting protein required for genome integrity and a predictor of outcome after chemotherapy in breast cancer. EMBO J. 31 1160–1176. 10.1038/emboj.2011.490 - DOI - PMC - PubMed
    1. Carrera S., Cuadrado-Castano S., Samuel J., Jones G. D. D., Villar E., Lee S. W., et al. (2013). Stra6, a retinoic acid-responsive gene, participates in p53-induced apoptosis after DNA damage. Cell Death Differ. 20 910–919. 10.1038/cdd.2013.14 - DOI - PMC - PubMed
    1. Carretero M., Ruiz-Torres M., Rodriguez-Corsino M., Barthelemy I., Losada A. (2013). Pds5B is required for cohesion establishment and Aurora B accumulation at centromeres. EMBO J. 32 2938–2949. 10.1038/emboj.2013.230 - DOI - PMC - PubMed