. 2020 Aug 29;29(15):2551-2567.
doi: 10.1093/hmg/ddaa139.

Patterns of CAG repeat instability in the central nervous system and periphery in Huntington's disease and in spinocerebellar ataxia type 1

Affiliations

Patterns of CAG repeat instability in the central nervous system and periphery in Huntington's disease and in spinocerebellar ataxia type 1

Ricardo Mouro Pinto et al. Hum Mol Genet. .

Abstract

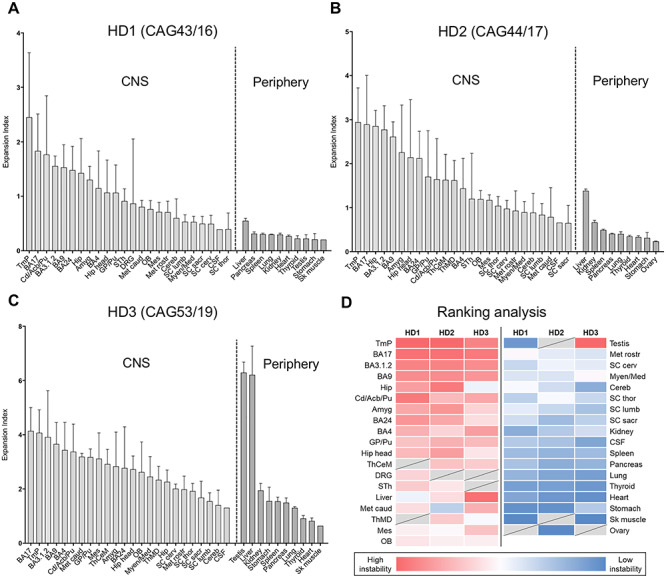
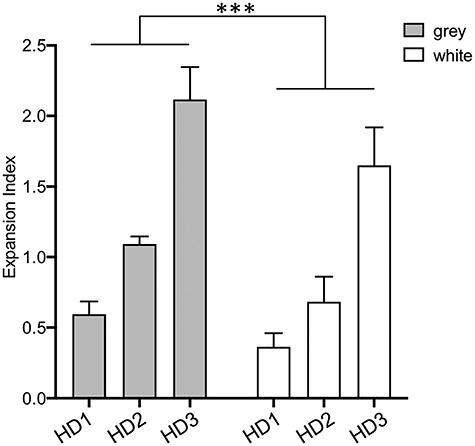
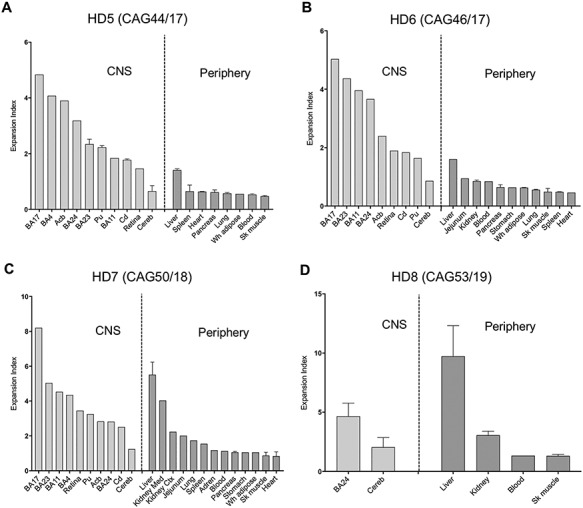
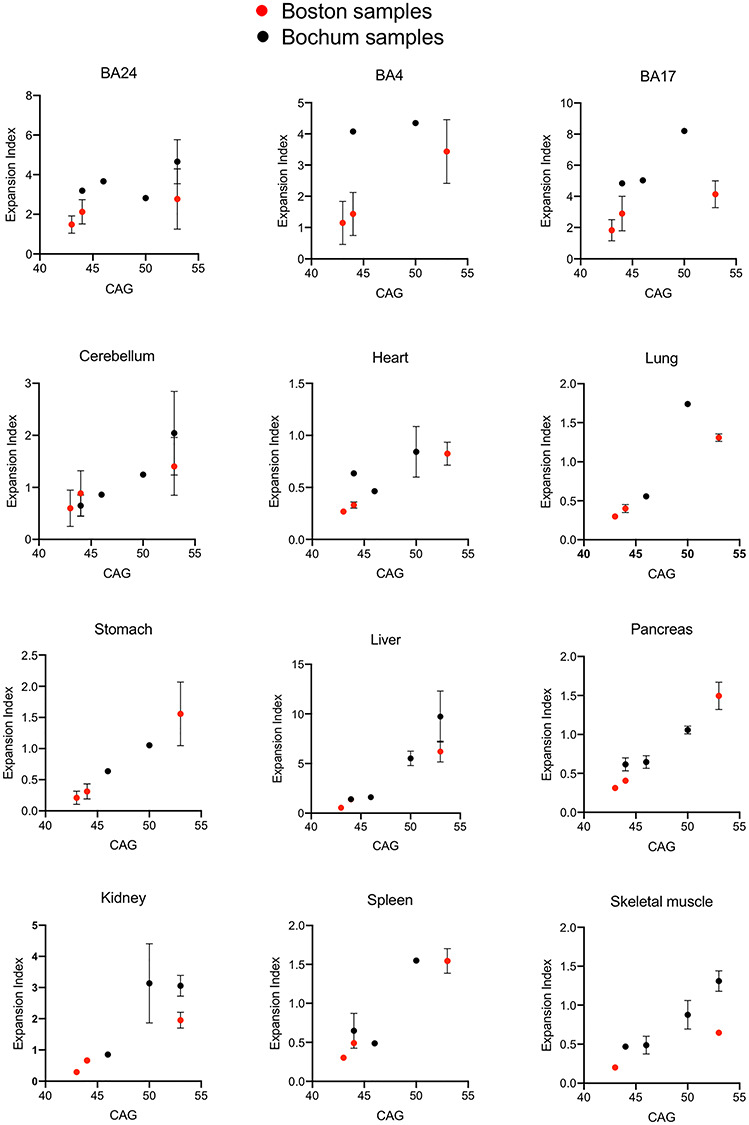
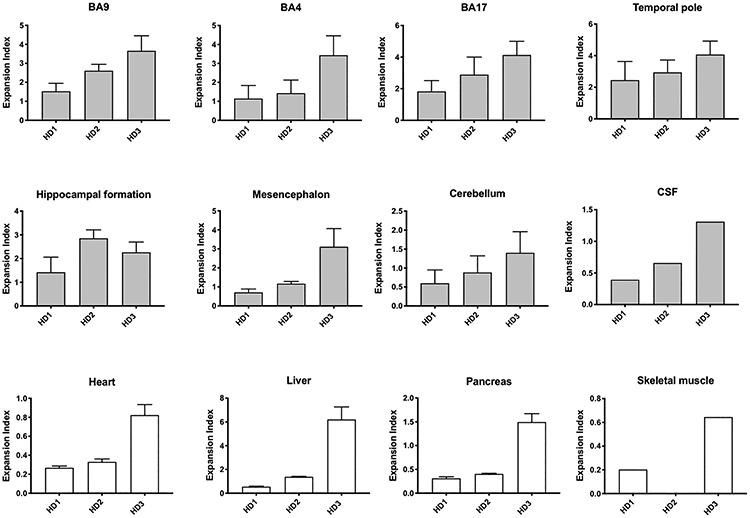
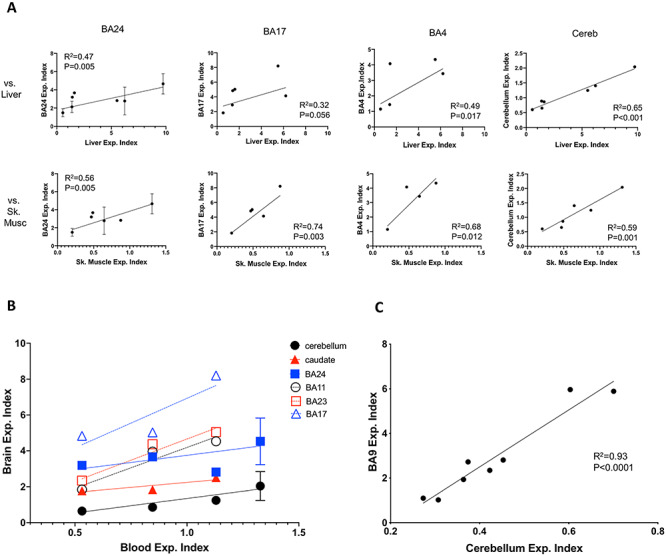
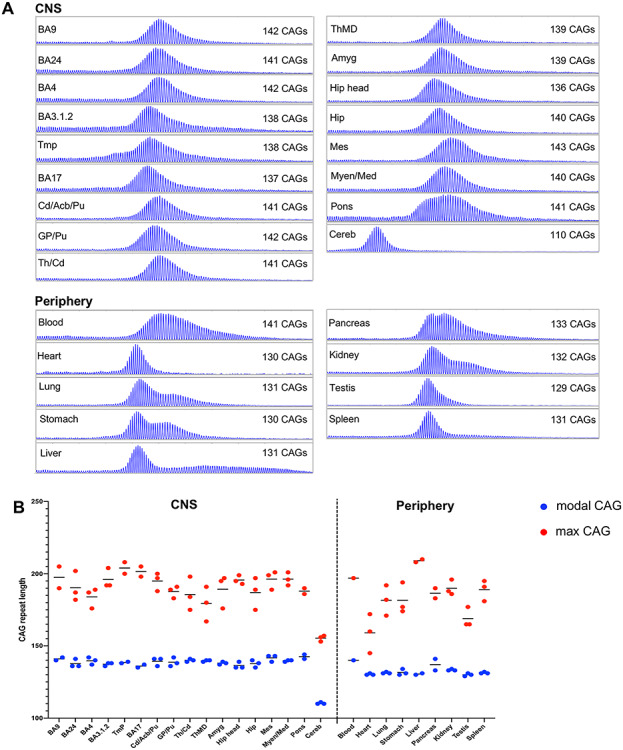
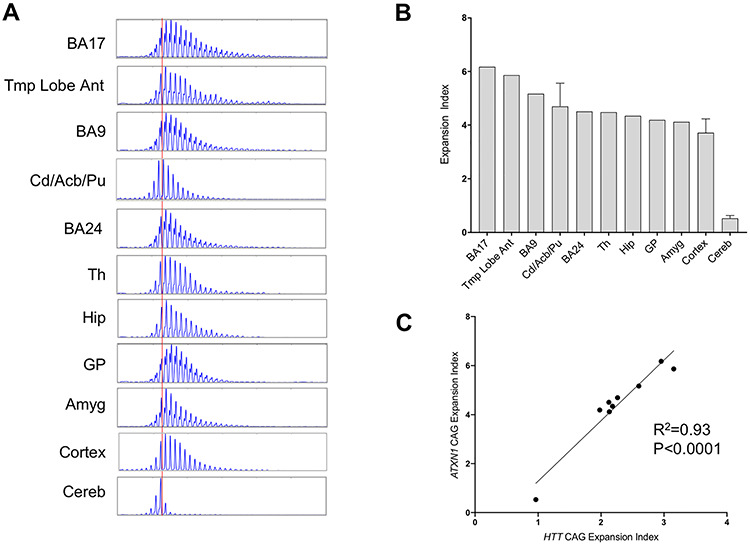
The expanded HTT CAG repeat causing Huntington's disease (HD) exhibits somatic expansion proposed to drive the rate of disease onset by eliciting a pathological process that ultimately claims vulnerable cells. To gain insight into somatic expansion in humans, we performed comprehensive quantitative analyses of CAG expansion in ~50 central nervous system (CNS) and peripheral postmortem tissues from seven adult-onset and one juvenile-onset HD individual. We also assessed ATXN1 CAG repeat expansion in brain regions of an individual with a neurologically and pathologically distinct repeat expansion disorder, spinocerebellar ataxia type 1 (SCA1). Our findings reveal similar profiles of tissue instability in all HD individuals, which, notably, were also apparent in the SCA1 individual. CAG expansion was observed in all tissues, but to different degrees, with multiple cortical regions and neostriatum tending to have the greatest instability in the CNS, and liver in the periphery. These patterns indicate different propensities for CAG expansion contributed by disease locus-independent trans-factors and demonstrate that expansion per se is not sufficient to cause cell type or disease-specific pathology. Rather, pathology may reflect distinct toxic processes triggered by different repeat lengths across cell types and diseases. We also find that the HTT CAG length-dependent expansion propensity of an individual is reflected in all tissues and in cerebrospinal fluid. Our data indicate that peripheral cells may be a useful source to measure CAG expansion in biomarker assays for therapeutic efforts, prompting efforts to dissect underlying mechanisms of expansion that may differ between the brain and periphery.


Figures

Figure 1
Figure 1
Quantitative analyses of somatic CAG expansion in adult-onset HD. (A–D) Expansion indices were quantified from GeneMapper peak height data of HTT CAG PCR products from individuals HD1, HD2 and HD3, analyzed in Boston, USA. Bars show mean expansion indices for each tissue, and error bars show standard deviation between tissue sub-pieces. For each individual, data are plotted in order of mean tissue expansion index, separately for the CNS and periphery. (D) Mean expansion indices were ranked for each individual and ranks displayed as heat map. Tissues are displayed in order of mean rank. Dark red = most expanded; white = median; dark blue = least expanded; gray = tissue not available. OB, olfactory bulb; BA9, prefrontal cortex; BA24, anterior cingulate/midcingulate cortex; BA4, primary motor cortex; BA3.1.2, primary somatosensory cortex; Tmp, temporal pole; BA17, primary visual cortex; Cd/Acb/Pu, caudate/accumbens/putamen; GP/Pu, globus pallidus/putamen; ThCeM, centromedial thalamic nucleus; ThMD, dorsomedial thalamic nucleus; STh, subthalamic nucleus; Amyg, amygdala; Hip head, hippocampal formation (head); Hip, hippocampal formation; Mes, mesencephalon; Met rostr, metencephalon rostral; Met caud, metencephalon caudal; Myen/Med, myelencephalon/medulla; Cereb, cerebellum; SC cerv, spinal cord cervical; SC thor, spinal cord thoracic; SC lumb, spinal cord lumbar; SC sacr, spinal cord sacral; DRG, dorsal root ganglion; CSF, cerebrospinal fluid; Sk muscle, psoas skeletal muscle. Numbers of samples for each tissue are shown in Supplementary Material, Table S1.
Figure 2
Figure 2
Comparison of spinal cord gray and white matter. Expansion indices were determined in spinal cord gray and white matter. Bars show the mean values across cervical, thoracic, lumbar and sacral regions of gray and white matter for each individual. Error bars represent standard deviation. Two-way ANOVA accounting for repeated measures across the four spinal cord regions from each individual: difference between gray and white matter P < 0.001 (***); difference between individuals P < 0.0001; difference between spinal cord subregion P = 0.42.
Figure 3
Figure 3
Quantitative somatic CAG expansion analyses of a replicate set of adult-onset HD tissues. (A-D) Expansion indices were quantified from GeneMapper peak height data of HTT CAG PCR products from individuals HD5, HD6, HD7 and HD8, analyzed in Bochum, Germany. Bars show mean expansion indices for each tissue, and error bars show standard deviation between tissue sub-pieces, other than HD5 blood where there are two technical PCR replicates of the same DNA sample. For each individual, data are plotted in order of mean tissue expansion index, separately for the brain and periphery. BA11, straight gyrus; BA24, anterior cingulate/midcingulate cortex; BA23, postcingulate cortex; BA4, primary motor cortex; BA3.1.2, primary somatosensory cortex; BA17, primary visual cortex; Cd, caudate; Acb, accumbens; Pu, putamen; Cereb, cerebellum; Kidney Med, kidney medulla; Kidney Ctx, kidney cortex; Sk muscle, sartorius or temporal skeletal muscle; Adren, adrenal gland; Wh adipose, white adipose tissue. Numbers of samples for each tissue are shown in Supplementary Material, Table S1.
Figure 4
Figure 4
CAG length correlation across multiple tissues. Expansion indices were plotted as a function of CAG length for tissues shared between the Boston and Bochum studies in all seven adult-onset HD individuals (HD1–3, HD5–8). Points show the mean expansion index values and error bars show standard deviation.
Figure 5
Figure 5
Inter-individual differences in somatic CAG expansion are largely reflected across multiple brain and peripheral tissues. Expansion indices were compared between individuals HD1, HD2 and HD3 in a number of brain and peripheral tissues, as well as post-mortem CSF. Bars show mean ± SD across the tissue sub-pieces. Skeletal muscle was not available from HD2.
Figure 6
Figure 6
Correlations between expansion indices in different tissues. (A) Correlation between expansion indices in liver (top panels) or skeletal muscle (lower panels) and those in BA24, BA17, BA4 and cerebellum across individuals HD1–3 and HD5–8. N = 4–7 depending on the tissue comparison (see Supplementary Material, Table S1). (B) Comparison of Expansion indices in brain regions and in blood from individuals HD5–8. For replicate measurements, mean ± SD is plotted. Sample number is too low (N = 4 or N = 3 depending on the brain region) for meaningful statistical analyses, however, results of linear regressions of brain region versus blood expansion indices, meant to indicate trends are as follows: cerebellum R2 = 0.72, P = 0.0086; caudate R2 = 0.80, P = 0.11; BA24 R2 = 0.22, P = 0.35; BA11 R2 = 0.92, P = 0.18, BA23 R2 = 0.95, P = 0.026; BA17 R2 = 0.77, P = 0.32. Trend lines are shown on the graphs. (C) Correlation between expansion indices in cortex (BA9) and cerebellum from an additional eight individuals (CAG 40–48).
Figure 7
Figure 7
CAG expansion in a case of juvenile-onset HD. (A) GeneMapper profiles of expanded allele HTT PCR products from brain regions and peripheral tissues. The size of the modal allele for each trace is indicated. (B) Modal CAG repeat and maximum CAG repeat detectable (1% relative peak height threshold) are plotted for all tissue sub-piece replicates. Short horizontal lines show mean of tissue replicates. BA9, prefrontal cortex; BA24, anterior cingulate/midcingulate cortex; BA4, primary motor cortex; BA3.1.2, primary somatosensory cortex; Tmp, temporal pole; BA17, primary visual cortex; Cd/Acb/Pu, caudate/accumbens/putamen; GP/Pu, globus pallidus/putamen; Th/Cd, thalamus/caudate; ThMD, dorsomedial thalamic nucleus; Amyg, amygdala; Hip head, hippocampal formation (head); Hip, hippocampal formation; Mes, mesencephalon; Myen/Med, myelencephalon/medulla; Cereb, cerebellum.
Figure 8
Figure 8
ATXN1 CAG expansion in brain tissues and correlation with HTT CAG expansion. (A) GeneMapper traces of ATXN1 CAG PCR products. The red vertical line shows the modal allele in cerebellum (CAG46). (B) Expansion indices calculated from GeneMapper peak height data of expanded allele ATXN1 CAG repeats. Three tissue pieces were analyzed for caudate/accumbens/putamen, cortex and cerebellum and bars show mean ± SD. BA9, prefrontal cortex; BA24, anterior cingulate/midcingulate cortex; Tmp Lobe Ant, anterior temporal lobe; BA17, primary visual cortex; Cd/Acb/Pu, caudate/accumbens/putamen; Th, thalamus; Hip: hippocampal formation; GP, globus pallidus; Amyg, amygdala; Cereb, cerebellum. (C) Correlation between mean ATXN1 and mean HTT CAG expansion indices (individuals HD1, HD2, HD3) for the shared tissues. Shared tissues used in the correlation are temporal pole (HD)/anterior temporal lobe (SCA1), BA17, caudate/accumbens/putamen, BA9, BA24, hippocampal formation, amygdala, globus pallidus/putamen (HD)/globus pallidus (SCA1) and cerebellum.

References

    1. Vonsattel J.P., Myers R.H., Stevens T.J., Ferrante R.J., Bird E.D. and Richardson E.P. (1985) Neuropathological classification of Huntington's disease. J. Neuropathol. Exp. Neurol., 44, 559–577. - PubMed
    1. Nance M.A. and Myers R.H. (2001) Juvenile onset Huntington's disease-clinical and research perspectives. Ment. Retard. Dev. Disabil. Res. Rev., 7, 153–157. - PubMed
    1. Fusilli C., Migliore S., Mazza T., Consoli F., De Luca A., Barbagallo G., Ciammola A., Gatto E.M., Cesarini M., Etcheverry J.L. et al. (2018) Biological and clinical manifestations of juvenile Huntington's disease: a retrospective analysis. Lancet Neurol., 17, 986–993. - PubMed
    1. Cronin T., Rosser A. and Massey T. (2019) Clinical presentation and features of juvenile-onset Huntington’s disease: a systematic review. J. Huntington’s Dis., 8, 171–179. - PubMed
    1. Quarrell O., O'Donovan K.L., Bandmann O. and Strong M. (2012) The prevalence of juvenile Huntington's disease: a review of the literature and meta-analysis. PLoS Curr., 4, e4f8606b8742ef8603. - PMC - PubMed

Publication types

MeSH terms

Substances