

Neuropilin-1 expression in GnRH neurons regulates prepubertal weight gain and sexual attraction
- PMID: 32761635
- PMCID: PMC7527814
- DOI: 10.15252/embj.2020104633
Neuropilin-1 expression in GnRH neurons regulates prepubertal weight gain and sexual attraction
Abstract
Hypothalamic neurons expressing gonadotropin-releasing hormone (GnRH), the "master molecule" regulating reproduction and fertility, migrate from their birthplace in the nose to their destination using a system of guidance cues, which include the semaphorins and their receptors, the neuropilins and plexins, among others. Here, we show that selectively deleting neuropilin-1 in new GnRH neurons enhances their survival and migration, resulting in excess neurons in the hypothalamus and in their unusual accumulation in the accessory olfactory bulb, as well as an acceleration of mature patterns of activity. In female mice, these alterations result in early prepubertal weight gain, premature attraction to male odors, and precocious puberty. Our findings suggest that rather than being influenced by peripheral energy state, GnRH neurons themselves, through neuropilin-semaphorin signaling, might engineer the timing of puberty by regulating peripheral adiposity and behavioral switches, thus acting as a bridge between the reproductive and metabolic axes.
Keywords: chemotropic factors; energy homeostasis; hypothalamus; puberty onset; sexual behavior.
© 2020 The Authors.
Conflict of interest statement
The authors declare that they have no conflict of interest.
Figures
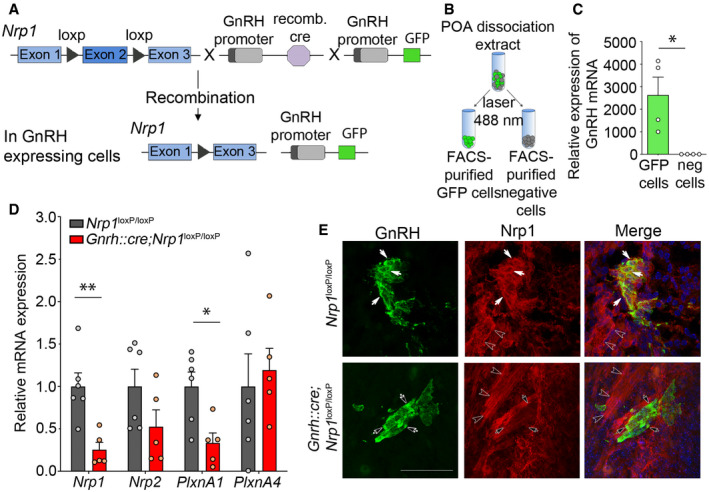
Genetic strategy to selectively knock out Nrp1 in GnRH‐expressing cells, using Nrp1 loxP/loxP mice crossed with Gnrh::cre mice. These mice were also crossed with Gnrh::gfp mice expressing green fluorescent protein under the control of the GnRH promoter in order to generate triple transgenic mice.
Isolation of GFP‐positive cells by FACS: schematic diagram showing the selection of the GFP‐positive population (green).
Relative mRNA expression from real‐time PCR analysis of the GnRH transcript in GFP‐positive cells, in comparison with GFP‐negative cells. The GnRH transcript appears to be selectively expressed in GFP‐positive cells. Mann–Whitney U‐test, n = 4 mice from 2 litters.
Relative mRNA expression from real‐time PCR analysis of neuropilin‐1 (Nrp1), Nrp2, plexin‐A1 (PlxnA1), and PlxnA4 transcripts in FACS‐isolated GFP‐positive GnRH neurons from control (Nrp1 loxP/loxP; gray) and mutant (Gnrh::cre; Nrp1 loxP/loxP; red) P0 mice. Unpaired t‐test, n = 5–6 mice per group from 3 litters.
Representative immunofluorescence images showing GnRH neurons migrating along Nrp1‐immunoreactive vomeronasal/terminal nerve fibers (empty arrowheads) at the nose–brain junction in sagittal slices from E14.5 control and mutant embryos. GnRH neurons (green) themselves express Nrp1 (red, white arrows) in control Nrp1 loxP/loxP mice, whereas Nrp1 is undetectable in GnRH neurons from mutant Gnrh::cre; Nrp1 loxP/loxP littermates (black arrows). Scale bar: 50 μm.
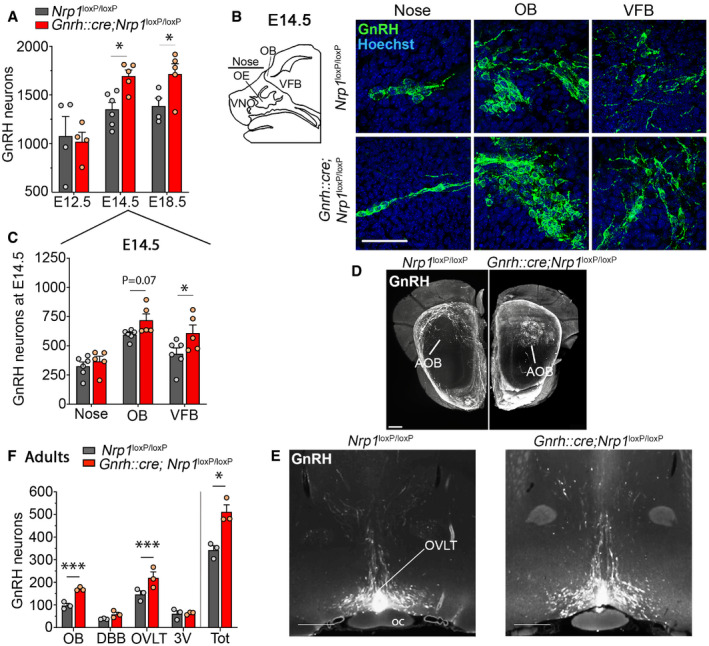
Quantification of total number of GnRH neurons during embryogenesis, at E12.5, E14.5, and E18.5. More GnRH neurons were found in E14.5 and E18.5 mutant embryos. Two‐way ANOVA, Fisher's LSD multiple‐comparison test, n = 4–6 mouse embryos from at least 3 litters.
Schematic representation of the areas containing GnRH migrating cells during embryogenesis at E14.5 and representative immunofluorescence showing migrating GnRH neurons at the level of the nose, the olfactory bulb (OB), and the ventral forebrain (VFB) in control and mutant embryos. Scale bar: 50 μm. VNO, vomeronasal organ; OE, olfactory epithelium; OB, olfactory bulbs; VFB, ventral forebrain.
Quantitative analysis showing distribution of GnRH neurons in the nose, OB, and VFB of mutant and control embryos. Two‐way ANOVA, Fisher's LSD multiple‐comparison test, n = 5 and 6 mouse embryos for mutants and controls, respectively, from at least 3 litters.
Representative image of cleared brains and immunolabeling for GnRH at the level of the olfactory bulbs, in a control (left panel) and a mutant (right panel) postnatal brain. Knockout animals show an accumulation of GnRH neurons in the accessory olfactory bulb (circle formed by the GnRH labeling, right panel). AOB, accessory olfactory bulb. Scale bar: 300 μm.
Representative image of cleared brains and immunolabeling for GnRH at the level of the organum vasculosum of the lamina terminalis (OVLT) in the median preoptic area, from a control (left) and a mutant (right) female postnatal brain. Scale bar: 500 μm. Oc, optic chiasma.
Quantitative analysis of the distribution of GnRH neurons in cleared brains of mutant and control littermates. OB, olfactory bulb; DBB, diagonal band of Broca; 3V, periventricular region of the preoptic area; Tot, total. Two‐way ANOVA, Fisher's LSD multiple‐comparison test, n = 3 adult mice from 3 litters.
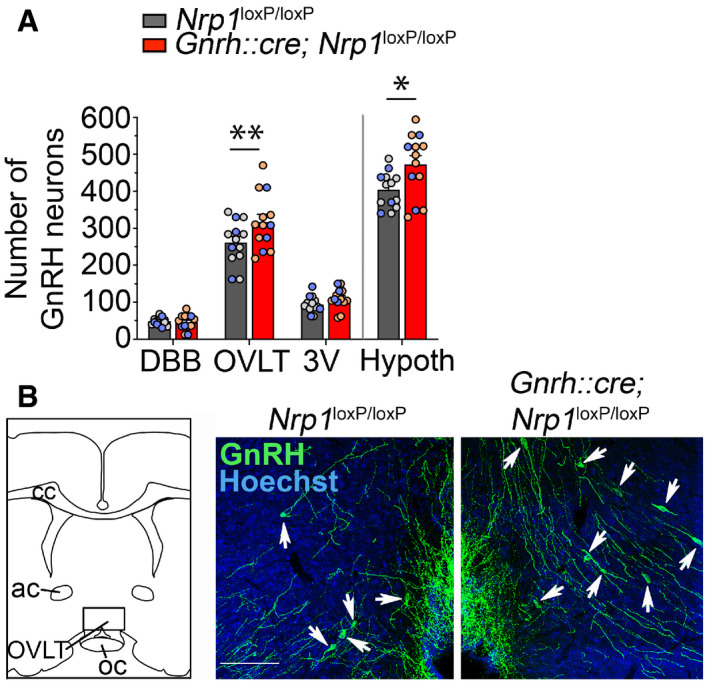
Total number of GnRH neurons in the forebrain and the hypothalamus (Hypoth) and their regional distribution (DBB: diagonal band of Broca; OVLT: organum vasculosum of the lamina terminalis; 3V: periventricular area of the median preoptic) in Nrp1 loxP/loxP and Gnrh::cre; Nrp1 loxP/loxP littermates using conventional immunofluorescence. Individual males and females used for this analysis are represented by blue and gray/light‐red dots, respectively. Two‐way ANOVA, Fisher's LSD multiple‐comparison test, n = 13 (nine females and four males).
Representative immunohistofluorescence for GnRH (green) and Hoechst staining (blue) of sections showing the OVLT region (area framed in the schematic) from control (left) and mutant (right) adult mice. More GnRH cells are observed in OVLT sections of mutant mice (white arrow). Ac, anterior commissure; cc, corpus callosum; Scale bar: 100 μm.
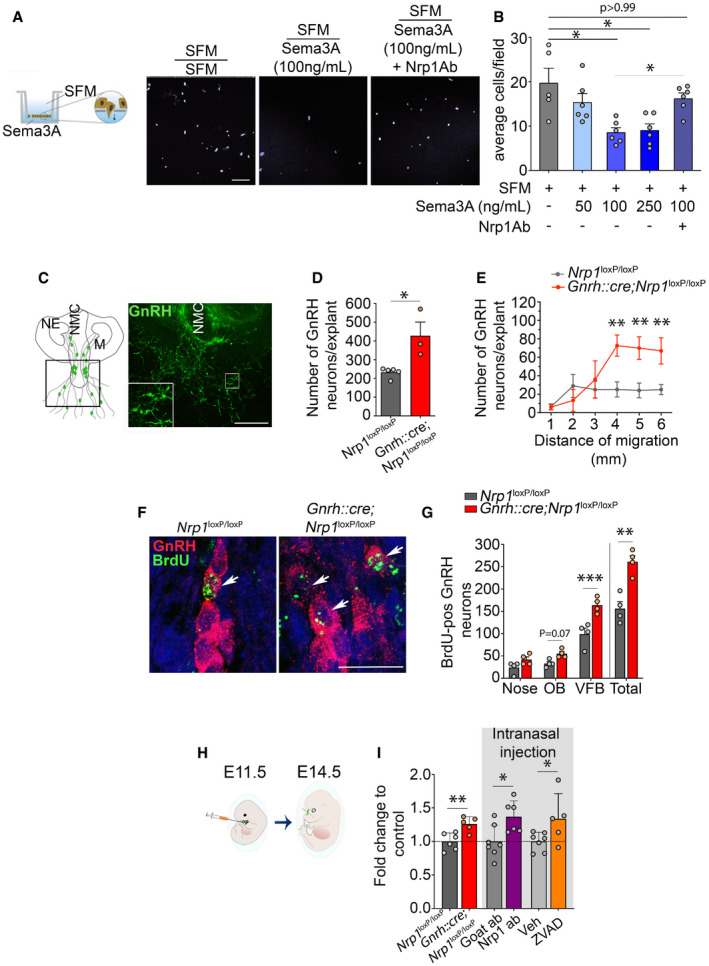
Schematic representation of the Transwell assay used to assess the effect of Sema3A, which was placed in the lower chamber, on GN11 cell migration and representative microphotograph of cell nuclei stained with Hoechst (gray) in the lower part of the Transwell membrane after 12 h incubation in SFM (left panel), SFM with 100 ng/ml Sema3A (middle panel), and SFM with 100 ng/ml Sema3A + 1 μg Nrp1Ab (right panel). Scale bar: 100 μm.
Quantitative analyses of the mean number of GN11 cells that migrated from the upper chamber (SFM) through the perforated membrane in the presence or absence of the indicated doses of Sema3A and Nrp1Ab in the lower chamber. Kruskal–Wallis test, n = 5–6 wells in two independent experiments.
Schematic illustration and representative photomicrograph of an organotypic culture of a nasal explant from E11.5 mouse embryos after 8 days in vitro. NE, nasal epithelium; NMC, nasal midline cartilage. Scale bar 500 μm (150 μm in inset).
Total number of GnRH neurons that migrated out of nasal explants isolated from control and mutant embryos, quantified after 8 days in culture. Mann–Whitney U‐test, n = 3–5 embryos from at least 3 litters.
Distance travelled by GnRH neurons from the olfactory epithelia; cells were quantified within a radius of 1–6 mm. Two‐way ANOVA, Fisher's LSD multiple‐comparison test, n = 3–5 explants.
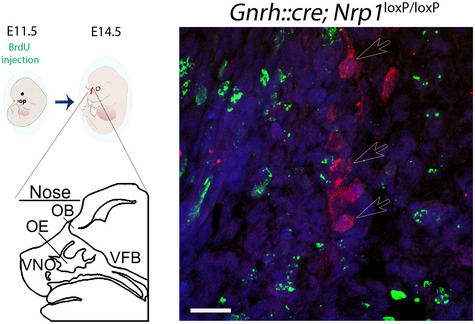
Representative immunofluorescence for GnRH (red)‐ and BrdU (green)‐positive cells in control and mutant E14.5 embryos arising from progenitors born between E9.5 and E10.5. BrdU‐positive GnRH neurons (white arrowheads) were more abundant in mutant than in control embryos. Scale bar: 20 μm.
Number of BrdU‐positive GnRH neurons in the nose, olfactory bulb (OB), and ventral forebrain (VFB) at E14.5 and total number of cells in control and mutant embryos. Double‐labeled cells were more numerous in the mutant VFB. Two‐way ANOVA, Fisher's LSD multiple‐comparison test, n = 4 embryos from 2 litters.
Schematic diagram of intra‐embryonic nasal injection in wild‐type E11.5 embryos and collection of embryos at E14.5.
Number of GnRH neurons in E14.5 embryos injected with neutralizing antibodies to neuropilin‐1 (Nrp1Ab) compared to an isotype goat antibody, or the antiapoptotic compound ZVAD compared to its vehicle, together with fold change in GnRH neuron number as well as mutant and control embryos at the same embryonic age. Note that the data are represented as fold change, as raw values are not comparable with transgenic animals that did not undergo surgery. Unpaired t‐test, n = 5–7 embryos from at least 2 litters.
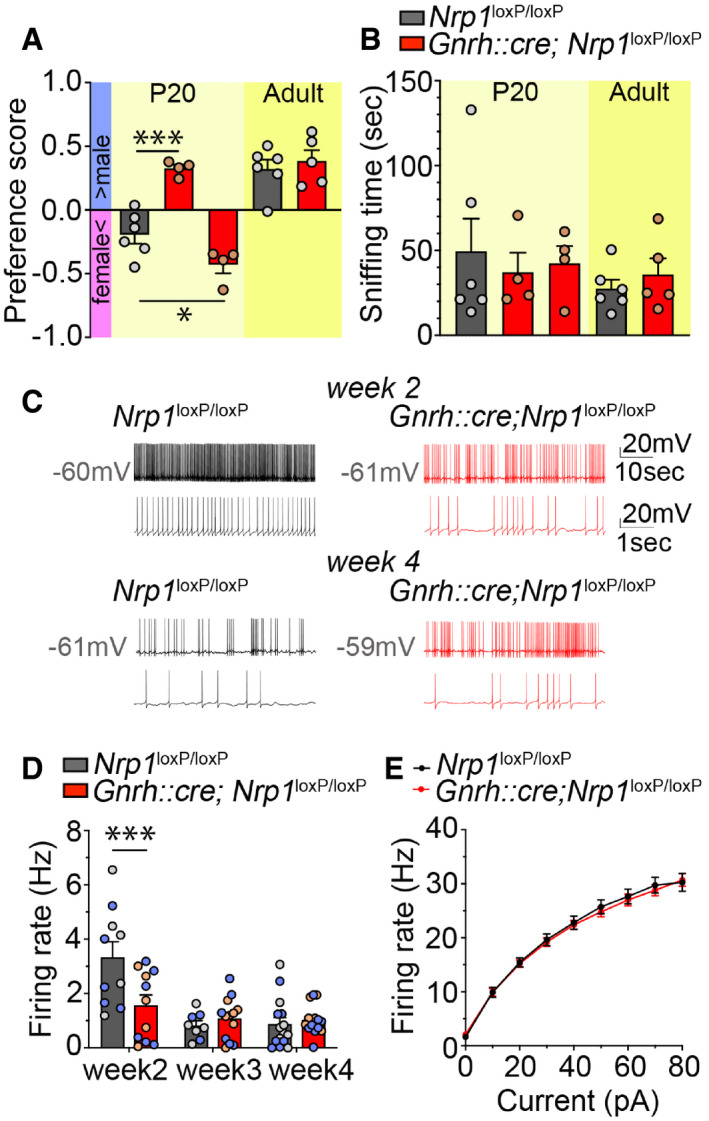
Olfactory sex preference test in P20 (left panel) and adult (right panel) control and mutant female mice. Half of the mutant females at P20 showed a preference for males, similar to adults of both genotypes, whereas the other half showed an even more pronounced preference for females than their control littermates at P20. One‐way ANOVA, Fisher's LSD multiple‐comparison test for P20 mice and unpaired t‐test for adult mice; n = 4–6 from at least 3 litters.
Time spent sniffing after the introduction of both male and female odors into the cage of control and mutant littermates. One‐way ANOVA, Fisher's LSD multiple‐comparison test for P20 mice and unpaired t‐test for adult mice; n = 4–6 from at least 3 litters.
Representative traces of spontaneous firing in GnRH neurons from control (left, black) and mutant (right, red) animals at Week 2 (upper panels) and Week 4 (lower panels); lower traces show an enlargement of the upper trace.
Average spontaneous firing frequency in GnRH neurons from control and mutant mice at Weeks 2, 3, and 4. Individual males and females used for this analysis are represented by blue and gray/light‐red dots, respectively. Two‐way ANOVA, Fisher's LSD multiple‐comparison test, n = 8–14 neurons from at least three animals from different litters. Note that individual neurons from male (n = 3–8) and female mice (n = 5–8) used for this analysis are represented by blue and gray dots, respectively.
Quantification of evoked firing in GnRH neurons from control and mutant mice in response to current steps. Two‐way repeated‐measures ANOVA, n = 10–11 neurons from at least three mice from different litters.
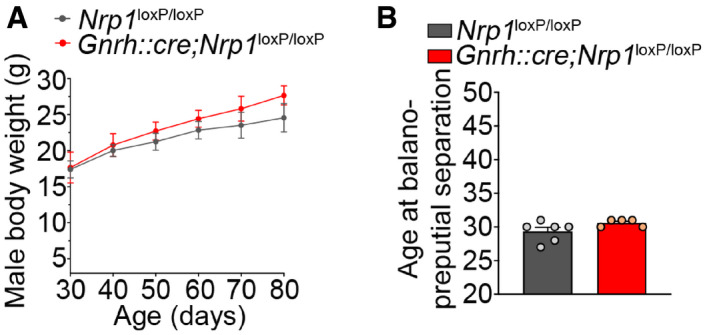
Evolution of body weight in control and mutant male littermates from 30 to 80 days of age. Two‐way ANOVA, n = 3–5 mice.
Age at balanopreputial separation in males. Mann–Whitney U‐test, n = 5–6 mice.
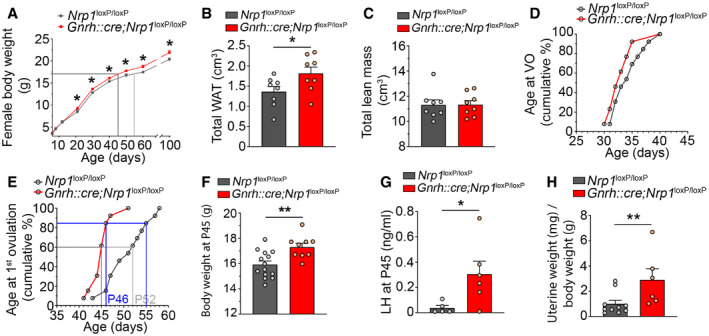
Evolution of body weight in control and mutant female littermates from 6 to 100 days of age. Mutant females show a significantly higher body weight from P21. The gray lines mark body weight at puberty onset. Two‐way ANOVA, Fisher's LSD multiple‐comparison test, n = 7–17 mice from at least 4 litters.
Fat mass or volume of white adipose tissue (WAT). Adult mutant females showed higher WAT volumes. Unpaired t‐test, n = 8 mice.
Volume of lean tissue. Mann–Whitney U‐test, n = 8 mice.
Cumulative percentage of the age at vaginal opening, n = 13 mice.
Cumulative percentage of animals undergoing first ovulation as assessed by the occurrence of first estrus at different ages, n = 13 mice.
Bar graph showing body weight at P45, which is the mean age at puberty in mutants. Unpaired t‐test, n = 9–14 mice.
Plasma LH levels at P45 in control and mutant mice. Mann–Whitney U‐test, n = 5–6 mice.
Mean uterine weight normalized to body weight (mg/g BW). Unpaired t‐test, n = 6–10 mice.
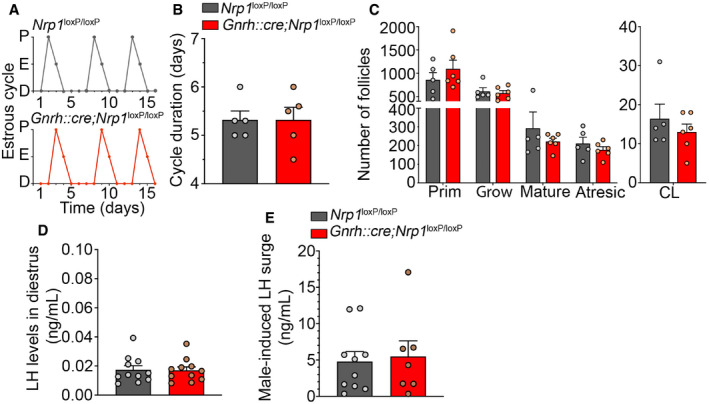
Representative estrous cycles from an Nrp1 loxP/loxP control female (top) and a Gnrh::cre;Nrp1 loxP/loxP mutant female (bottom). D = diestrus, E = estrus, P = proestrus.
Estrous cycle duration. Unpaired t‐test, n = 5.
Number of follicles in both ovaries in control and mutant females. Prim, primordial; Grow, growing; CL, corpora lutea. Two‐way ANOVA, n = 5–6.
Nadir LH levels in diestrus. Mann–Whitney U‐test, n = 11.
Surge levels of LH induced by male odors. Unpaired t‐test, n = 7–10.
References
-
- Ahmed ML, Ong KK, Morrell DJ, Cox L, Drayer N, Perry L, Preece MA, Dunger DB (1999) Longitudinal study of leptin concentrations during puberty: sex differences and relationship to changes in body composition. J Clin Endocrinol Metab 84: 899–905 - PubMed
-
- Bagnard D, Vaillant C, Khuth ST, Dufay N, Lohrum M, Puschel AW, Belin MF, Bolz J, Thomasset N (2001) Semaphorin 3A‐vascular endothelial growth factor‐165 balance mediates migration and apoptosis of neural progenitor cells by the recruitment of shared receptor. J Neurosci 21: 3332–3341 - PMC - PubMed
Publication types
MeSH terms
Substances
Grants and funding
LinkOut - more resources
Full Text Sources
Other Literature Sources
Molecular Biology Databases
