Review
. 2020 Aug;13(8):1792-1808.
doi: 10.1016/j.jcmg.2020.05.017. Epub 2020 Jun 24.

Heart and Lung Multimodality Imaging in COVID-19

Affiliations
Review

Heart and Lung Multimodality Imaging in COVID-19

Eustachio Agricola et al. JACC Cardiovasc Imaging. 2020 Aug.

Abstract

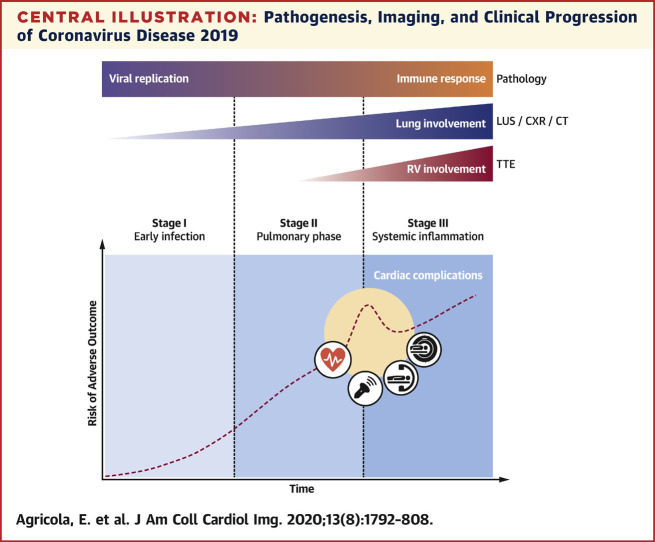
The severe acute respiratory syndrome-coronavirus-2 outbreak has rapidly reached pandemic proportions and has become a major threat to global health. Although the predominant clinical feature of coronavirus disease-2019 (COVID-19) is an acute respiratory syndrome of varying severity, ranging from mild symptomatic interstitial pneumonia to acute respiratory distress syndrome, the cardiovascular system can be involved in several ways. As many as 40% of patients hospitalized with COVID-19 have histories of cardiovascular disease, and current estimates report a proportion of myocardial injury in patients with COVID-19 of up to 12%. Multiple pathways have been suggested to explain this finding and the related clinical scenarios, encompassing local and systemic inflammatory responses and oxygen supply-demand imbalance. From a clinical point of view, cardiac involvement during COVID-19 may present a wide spectrum of severity, ranging from subclinical myocardial injury to well-defined clinical entities (myocarditis, myocardial infarction, pulmonary embolism, and heart failure), whose incidence and prognostic implications are currently largely unknown because of a significant lack of imaging data. Integrated heart and lung multimodality imaging plays a central role in different clinical settings and is essential in the diagnosis, risk stratification, and management of patients with COVID-19. The aims of this review are to summarize imaging-oriented pathophysiological mechanisms of lung and cardiac involvement in COVID-19 and to provide a guide for integrated imaging assessment in these patients.

Keywords: COVID-19; SARS-CoV-2; cardiac magnetic resonance; chest x-ray; computed tomography; coronavirus; echocardiography; lung ultrasound; multimodality imaging.


Figures

None
Graphical abstract
Central Illustration
Pathogenesis, Imaging, and Clinical Progression of Coronavirus Disease 2019 Viral replication and host immune response synergistically determine coronavirus disease 2019 pathogenesis. As the disease progresses through its 3 stages, different chest imaging modalities (lung ultrasound, chest radiography, and computed tomography) demonstrate worsening lung involvement. In case of severe pneumonia, transthoracic echocardiography can identify increasing pulmonary hypertension and right ventricular impairment. Cardiovascular complications related to viral infection or to systemic inflammation can occur at different stages of the disease, increasing the risk for adverse outcome, and require specific multimodality imaging assessment. CT = computed tomography; CXR = chest radiography; LUS = lung ultrasound; RV = right ventricular; TTE = transthoracic echocardiography.
Figure 1
Figure 1
Chest Radiographic Features of COVID-19 Pneumonia (A) A 67-year-old-man presenting with sore throat: blurred peripheral ground-glass opacities (GGOs), mainly in the left medium to lower lung, with diffuse, blurred interstitial thickening. (B) A 59-year-old-man presenting with fever (39.5°C), cough, and diarrhea: diffuse, bilateral peripheral GGOs, consolidation areas mainly in the left lower lung and in the medium right lung. (C) A 43-year-old woman presenting with fever (40.5°C), cough, dyspnea, and severe hypoxia: bilateral consolidation areas occupying almost all lung parenchyma, with gross GGOs. No pleural effusion was noted in any case.
Figure 2
Figure 2
Computed Tomographic Features and Staging of COVID-19 Pneumonia The early stage (A) of typical COVID-2019 pneumonia is characterized by small subpleural ground-glass opacities (box), which then rapidly increase in number and develop into crazy paving pattern during the progressive stage (B). In the peak stage (C), dense consolidation becomes the most frequent finding. During the absorption stage (D), when the disease has a favorable course, consolidation areas are gradually absorbed, with residual subpleural fibrotic parenchymal bands (arrows).
Figure 3
Figure 3
Lung Ultrasound Features and Severity Grading of COVID-19 Pneumonia Different patterns of lung involvement and corresponding lung ultrasound (LUS) severity score. (A) Normal lung: horizontal A-lines (arrows) arising from the pleural line (arrowhead) at regular intervals. (B) Moderate loss of aeration: multiple cometlike B-lines (arrows) arising from focally thickened pleural line (arrowheads). (C) Severe loss of aeration: multiple coalescent B-lines responsible for a white lung appearance (square sign) along with pleural line thickening (arrowheads); subpleural consolidation (asterisk) visible as a focal hypoechoic area. (D) Complete loss of aeration: pleural line thickening (arrowhead) and extensive lung consolidation visible as a large hypoechoic area (asterisks) with associated air bronchogram (arrow).
Figure 4
Figure 4
Multimodality Imaging of Pulmonary Embolism Complicating COVID-19 Pneumonia A 61-year-old woman with reverse-transcriptase polymerase chain reaction swab results positive for severe acute respiratory syndrome coronavirus-2 presenting with sudden severe dyspnea associated with significant d-dimer increase. (A) Lung parenchyma windowing demonstrates bilateral, subpleural ground-glass opacities and consolidation areas (box), typical for coronavirus disease 2019 pneumonia. (B) Computed tomographic pulmonary angiography shows gross filling defect (arrows) in right pulmonary artery lobar branch for right upper lobe. (C, D) Transthoracic echocardiography shows right ventricular dilatation and septal shifting, indirect signs of severe pulmonary hypertension.
Figure 5
Figure 5
Multimodality Imaging of Myocardial Infarction With Nonobstructive Coronary Arteries Complicating COVID-19 Pneumonia A 58-year-old woman with reverse-transcriptase polymerase chain reaction swab results positive for severe acute respiratory syndrome-coronavirus-2 presenting after 1 week of fever (38.5°C), cough, diarrhea with recent onset of typical chest pain, elevated cardiac markers (high-sensitivity troponin T 222 ng/l), ST-segment depression in the inferior and lateral leads on electrocardiography, and inferior septal hypokinesia on transthoracic echocardiography. Triple rule-out computed tomography shows peripheral lung opacities (A, B) characterized by crazy paving pattern involving both the inferior lobes, with posterior distribution, suggestive for coronavirus disease 2019 interstitial pneumonia (boxes), and demonstrates absence of pulmonary embolism (C) or coronary disease (D). Cardiac magnetic resonance shows slight diffuse myocardial hyperintensity on T2 short-tau inversion recovery image (E), consistent with a slight increase of T2 relaxation time on T2 mapping: mean value of 55 ms (normal range ≤50 ms) with a peak of 61 ms in the inferior septum (G); inversion recovery images do not show significant late gadolinium enhancement foci. LAD = left anterior descending coronary artery; LCX = left circumflex coronary artery; RCA = right coronary artery.
Figure 6
Figure 6
Type 1 Acute Myocardial Infarction Complicating COVID-19 Pneumonia A 63-year-old woman with severe COVID-19 pneumonia requiring mechanical ventilation (A) presenting hypotension, with electrocardiogram (B) showing inferior ST-segment elevation acute myocardial infarction (high-sensitivity troponin T 579 ng/l, N-terminal pro–brain natriuretic peptide 8,441 pg/ml): invasive coronary angiography (C, D) demonstrates obstructive atherosclerotic disease of the right coronary artery (arrowheads) with haziness, hinting at thrombosis of ruptured plaque (asterisk) with distal embolization to both posterior descending artery (red arrow) and posterolateral branch (white arrow).
Figure 7
Figure 7
Integrated Multimodality Imaging Pathways in Clinical Practice Specific multimodality imaging pathways can be implemented in different clinical settings for diagnosis, risk stratification, management, disease progression monitoring, and detection of eventual cardiovascular complications. COVID-19 = coronavirus disease-2019; CMR = cardiac magnetic resonance; CT = computed tomography; CXR = chest radiography; ECMO = extracorporeal membrane oxygenation; FoCUS = focused cardiac ultrasound; ICA = invasive coronary angiography; ICU = intensive care unit; LUS = lung ultrasound; PCR = polymerase chain reaction; SARS-CoV-2 = severe acute respiratory syndrome-coronavirus-2; TEE = transesophageal echocardiography; TTE = transthoracic echocardiography.

References

    1. Guan W., Ni Z., Hu Y. Clinical characteristics of coronavirus disease 2019 in China. N Engl J Med. 2020;80:656–665. - PMC - PubMed
    1. Wang D., Hu B., Hu C. Clinical characteristics of 138 hospitalized patients with 2019 novel coronavirus-infected pneumonia in Wuhan, China. JAMA. 2020;323:1061. - PMC - PubMed
    1. Guo T., Fan Y., Chen M. Cardiovascular implications of fatal outcomes of patients with coronavirus disease 2019 (COVID-19) JAMA Cardiol. 2020 Mar 27 [E-pub ahead of print] - PMC - PubMed
    1. Bonow R.O., Fonarow G.C., O’Gara P.T., Yancy C.W. Association of coronavirus disease 2019 (COVID-19) with myocardial injury and mortality. JAMA Cardiol. 2020 Mar 27 [E-pub ahead of print] - PubMed
    1. Shi Y., Wang Y., Shao C. COVID-19 infection: the perspectives on immune responses. Cell Death Differ. 2020;27:1451–1454. - PMC - PubMed

MeSH terms