. 2020 Sep 3;182(5):1341-1359.e19.
doi: 10.1016/j.cell.2020.07.005. Epub 2020 Aug 6.

Coordinated Cellular Neighborhoods Orchestrate Antitumoral Immunity at the Colorectal Cancer Invasive Front

Affiliations

Coordinated Cellular Neighborhoods Orchestrate Antitumoral Immunity at the Colorectal Cancer Invasive Front

Christian M Schürch et al. Cell. .

Erratum in

Abstract

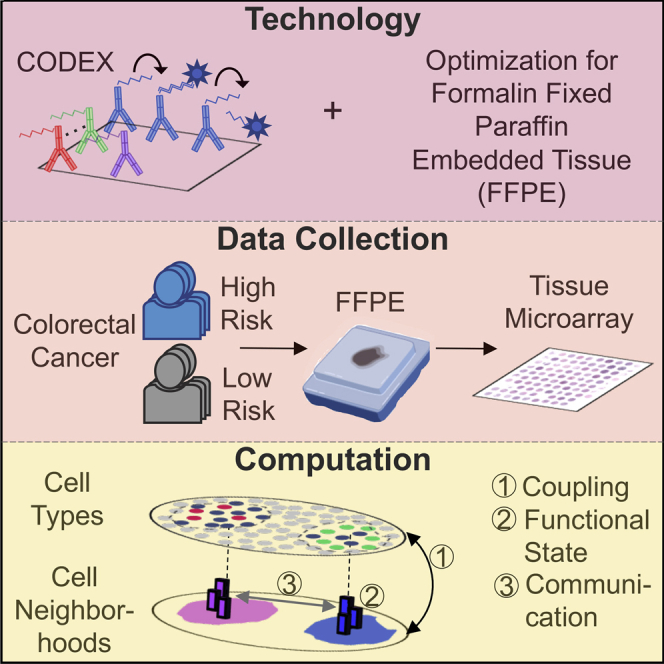
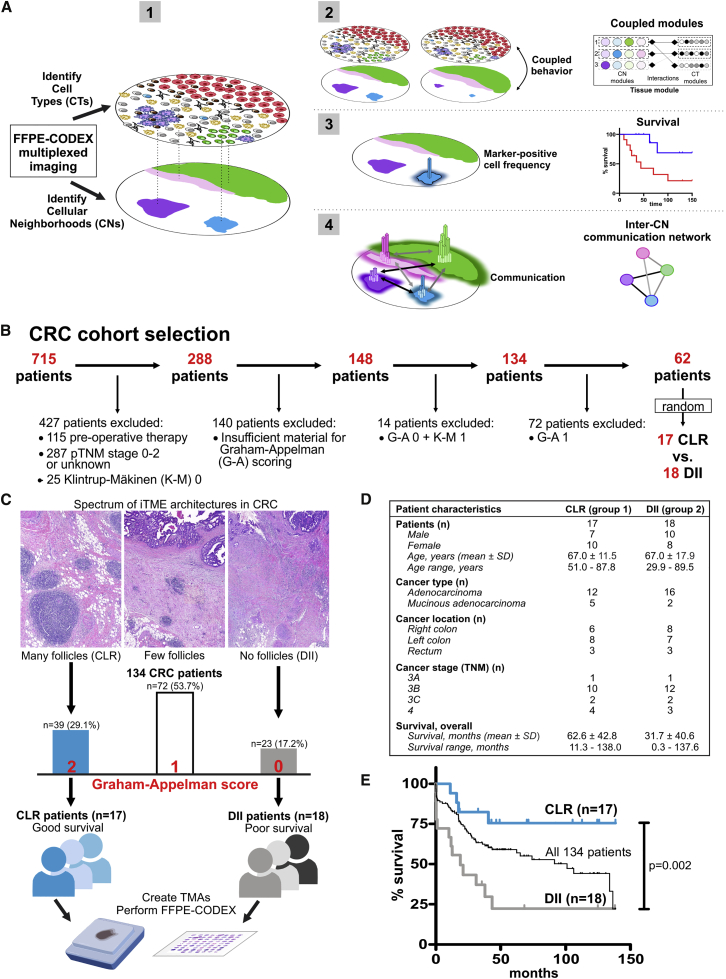
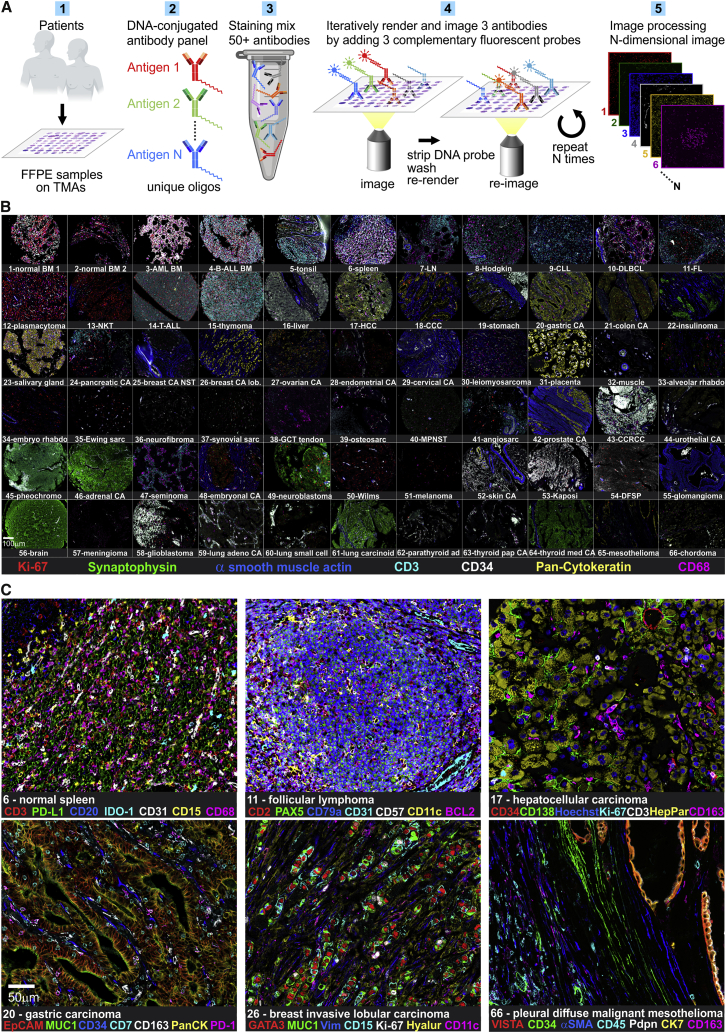
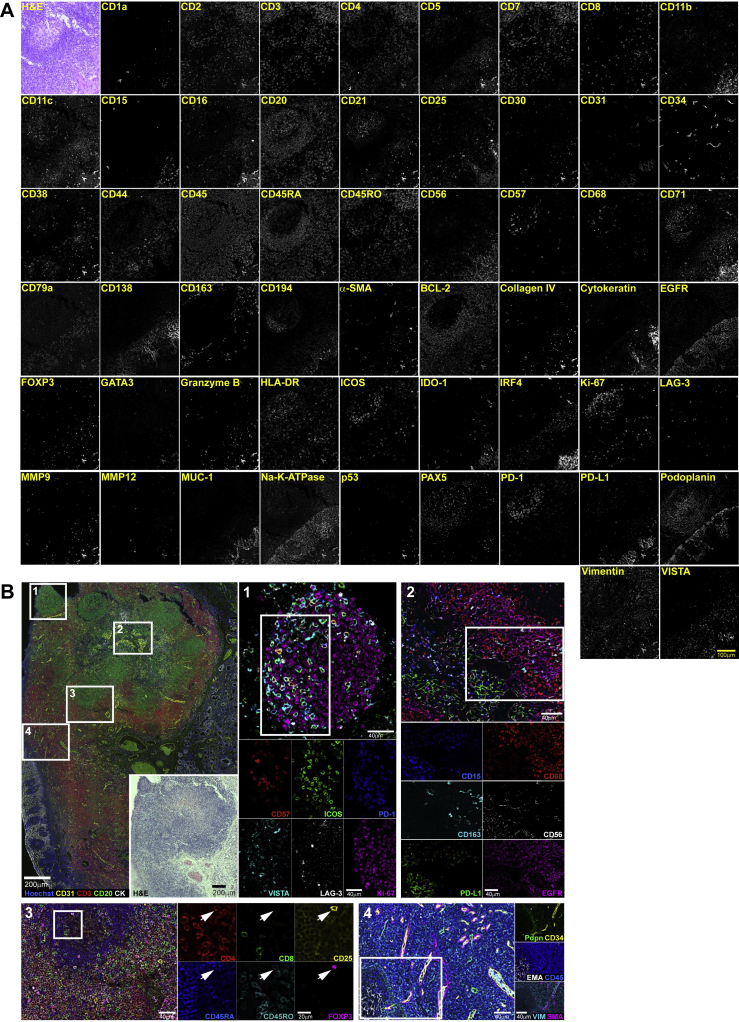
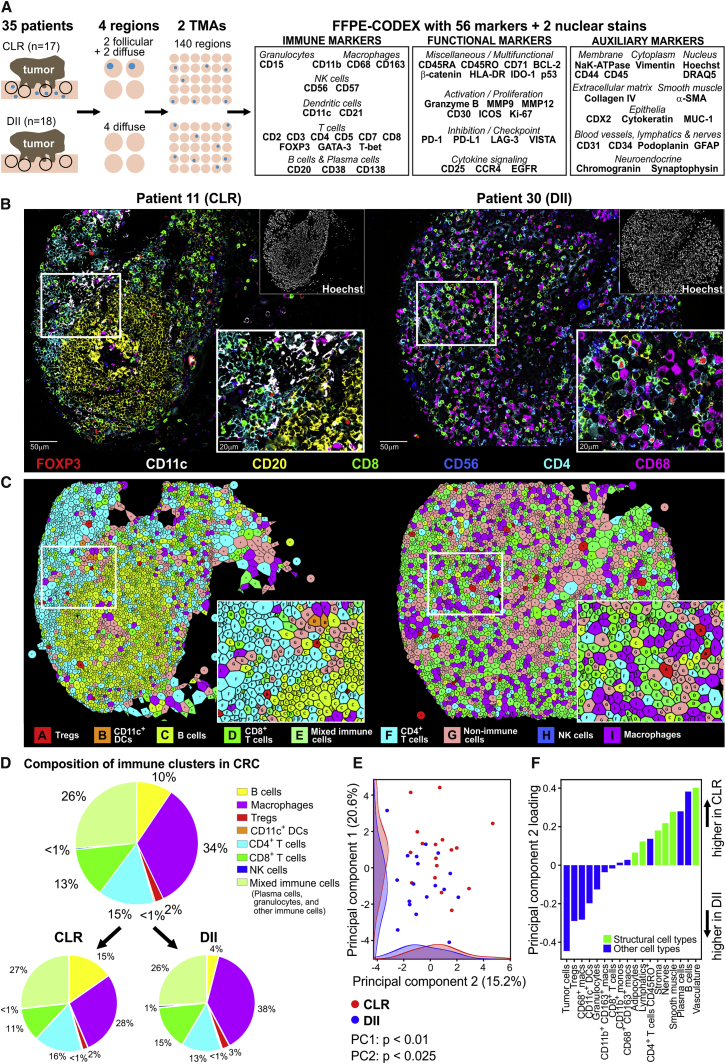
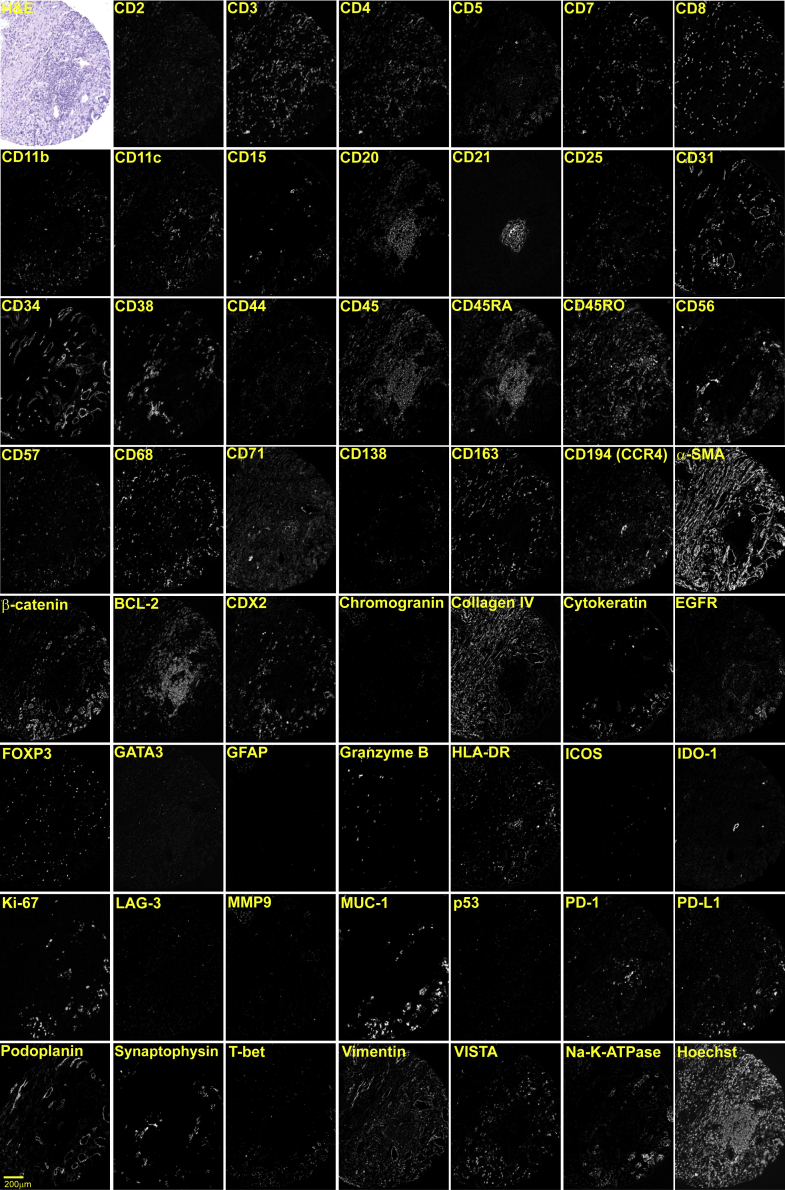
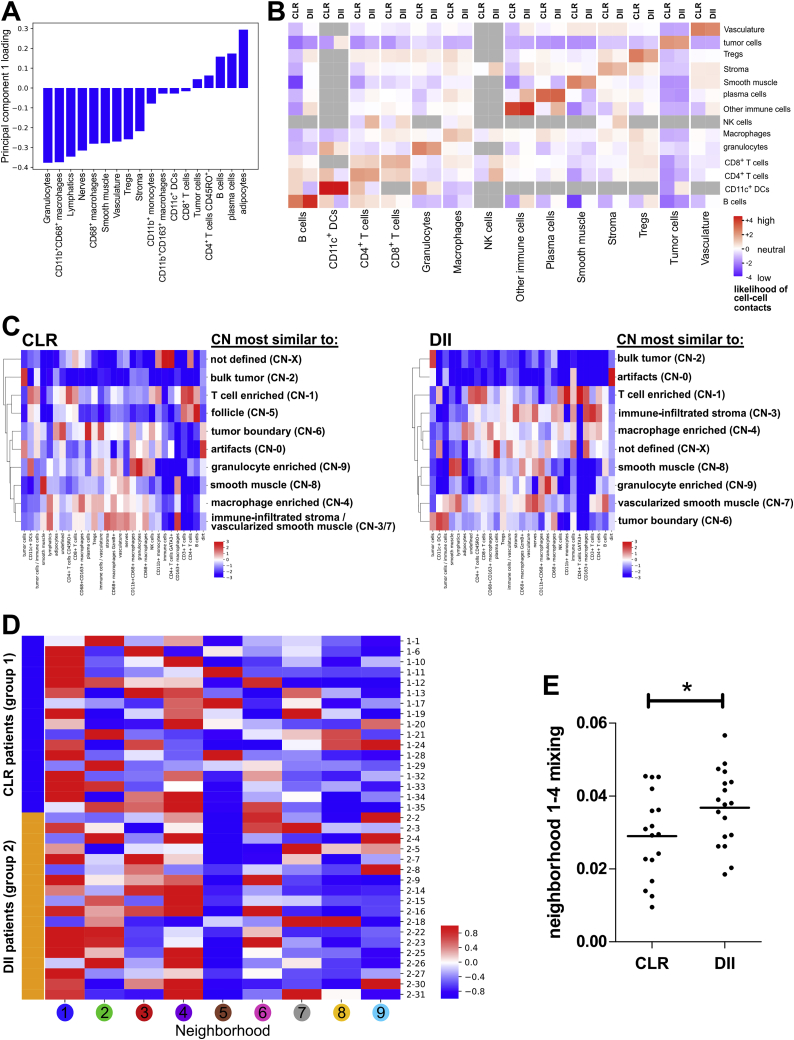
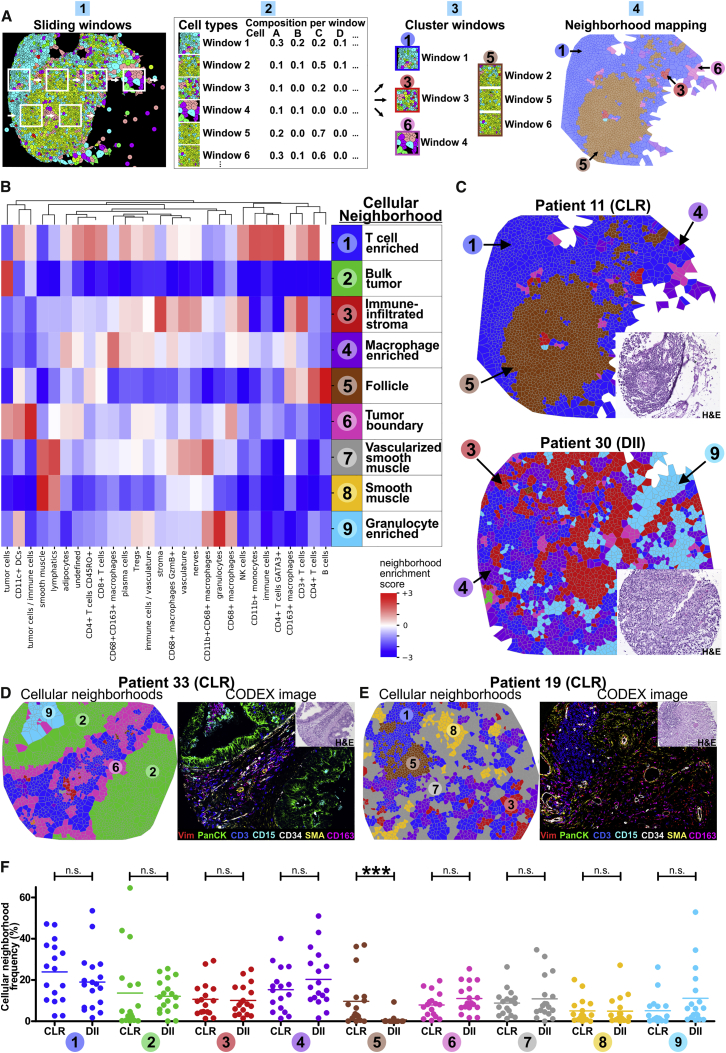
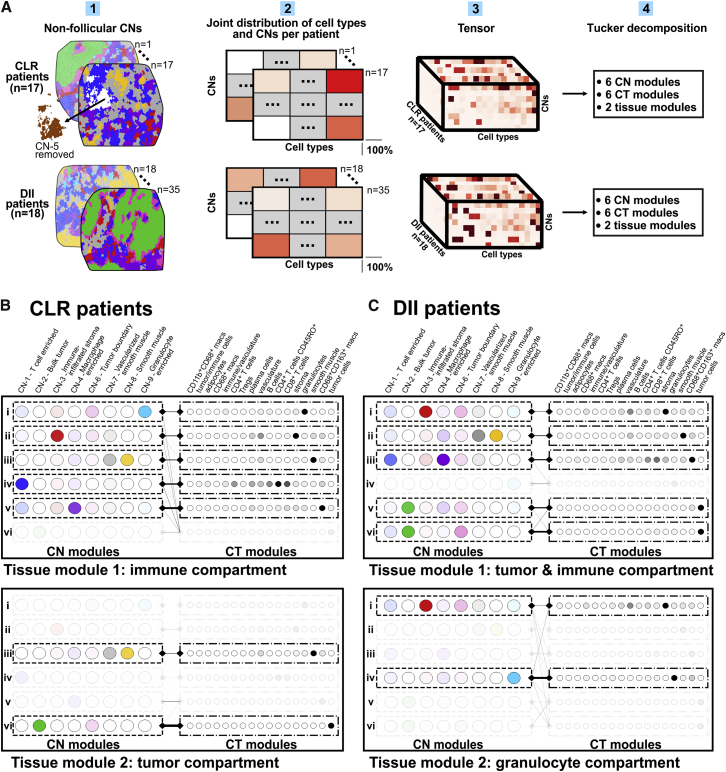
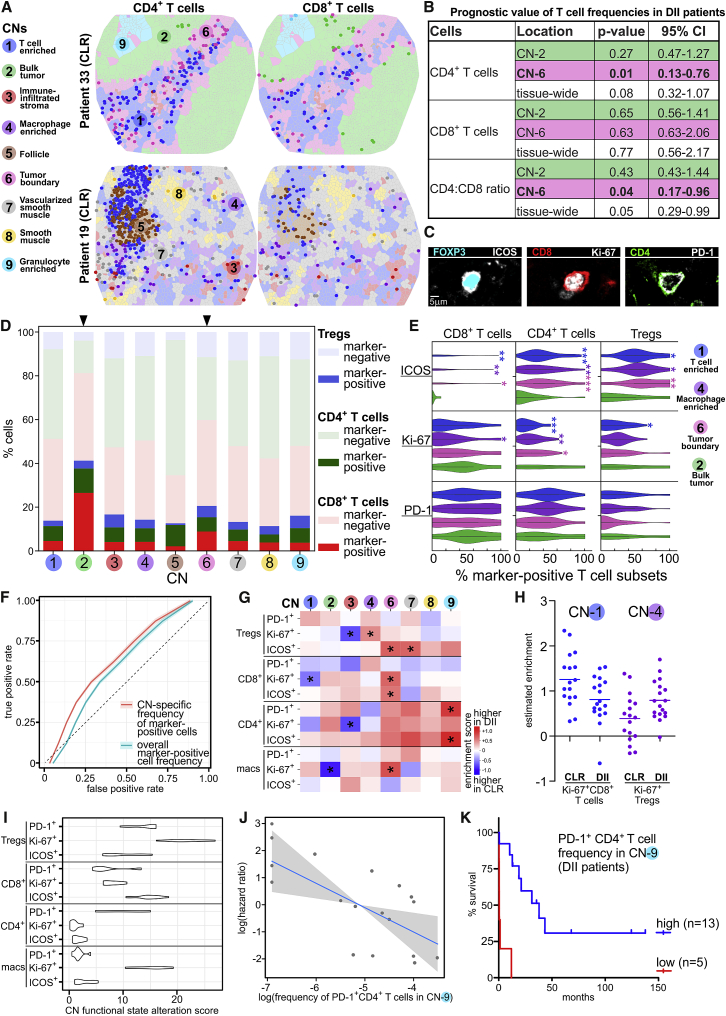
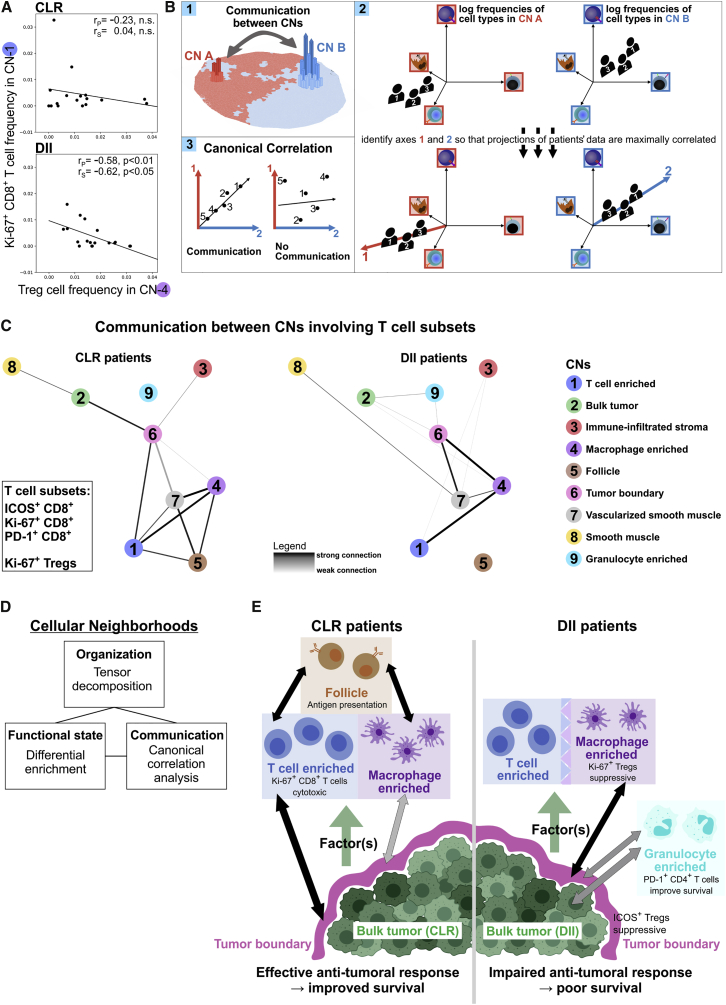
Antitumoral immunity requires organized, spatially nuanced interactions between components of the immune tumor microenvironment (iTME). Understanding this coordinated behavior in effective versus ineffective tumor control will advance immunotherapies. We re-engineered co-detection by indexing (CODEX) for paraffin-embedded tissue microarrays, enabling simultaneous profiling of 140 tissue regions from 35 advanced-stage colorectal cancer (CRC) patients with 56 protein markers. We identified nine conserved, distinct cellular neighborhoods (CNs)-a collection of components characteristic of the CRC iTME. Enrichment of PD-1+CD4+ T cells only within a granulocyte CN positively correlated with survival in a high-risk patient subset. Coupling of tumor and immune CNs, fragmentation of T cell and macrophage CNs, and disruption of inter-CN communication was associated with inferior outcomes. This study provides a framework for interrogating how complex biological processes, such as antitumoral immunity, occur through concerted actions of cells and spatial domains.

Keywords: CODEX; FFPE; antitumoral immunity; cellular neighborhoods; colorectal cancer; immune checkpoints; immune tumor microenvironment; multiplexed imaging; tertiary lymphoid structures; tissue architecture.


Conflict of interest statement

Declaration of Interests G.P.N. has received research grants from Pfizer, Vaxart, Celgene, and Juno Therapeutics during the course of this work. G.P.N., Y.G., and N.S. have equity in and are scientific advisory board members of Akoya Biosciences. C.M.S. is a scientific advisor to Enable Medicine. Akoya Biosciences makes reagents and instruments that are dependent on licenses from Stanford University. Stanford University has been granted US patent 9909167, which covers some aspects of the technology described in this paper.

Figures

None
Graphical abstract
Figure 1
Figure 1
CRC Study Cohort (A) Conceptual framework. (B) Exclusion criteria: pre-operative therapy, pathological tumor, nodes, metastasis (pTNM) score 0–2 or unknown, absent immune infiltration (Klintrup-Mäkinen [K-M] score 0), insufficient material for Graham-Appelman (G-A) scoring, a combination of low immune infiltration (K-M 1) and absent follicles (G-A 0) or few follicles (G-A 1). (C) Spectrum of iTME architectures in 134 advanced-stage CRC patients. (D) Characteristics of patients in the CRC study cohort. (E) Kaplan-Meier survival curve of the CRC study cohort (p determined with a log-rank test). See also Table S1A and STAR Methods.
Figure 2
Figure 2
CODEX Workflow and Antibody Validation (A) CODEX workflow. (B) Seven-color overview of multi-tumor TMA, imaged using a 56-marker CODEX panel. (C) Higher-magnification seven-color images of select tissue cores. See also Figures S1 and S2, Data S1 and S2A, and Tables S1B–S1E.
Figure S1
Figure S1
Validation and Titration of the CODEX Antibody Panel, Related to Figure 2, Table S1, and STAR Methods FFPE tonsil tissue was stained with a cocktail of 55 different DNA-conjugated antibodies, and a multi-cycle experiment was performed followed by H&E staining. (A) Images of a single tissue region at the interface of a follicle (top left in each image) and epithelium (bottom right in each image) are depicted in false gray color for each antibody; H&E staining is also shown. Scale bar, 100 μm. (B) Top left panel: Overview of the tonsil section in a five-color overlay image with Hoechst (blue; nuclei), CD31 (yellow; vasculature), CD3 (red; T cells), CD20 (green; B cells), and pan-cytokeratin (CK, white; epithelium). Inset: H&E staining. Scale bars, 200 μm. Regions 1-4 are indicated by white rectangles. Region 1: Six-color overlay and single-marker images of a follicle with CD57 (red), ICOS (also known as CD278, green), PD-1 (also known as CD279, blue), VISTA (cyan), LAG-3 (also known as CD223, white), and Ki-67 (magenta). Scale bars, 40 μm. Region 2: Six-color overlay and single-marker images of an inflamed epithelial-lymphoid parenchyma interface with CD15 (blue), CD68 (red), CD163 (cyan), CD56 (white), PD-L1 (also known as CD274, green), and EGFR (magenta). Scale bars, 40 μm. Region 3: Six-color overlay and single-marker images of a follicle with CD4 (red), CD8 (green), CD25 (yellow), CD45RA (blue), CD45RO (cyan), and FOXP3 (magenta). A CD4+CD25hiFOXP3+CD45RO+ regulatory T cell is indicated by the white arrow. Scale bars, 40 μm and 20 μm, respectively. Region 4: Six-color and two-color overlay images of an epithelial region with Pdpn (green), CD34 (yellow), EMA (also known as MUC-1, white), CD45 (blue), vimentin (cyan), and SMA (magenta). Scale bars, 40 μm. Brightness and contrast adjusted.
Figure S2
Figure S2
Signal and Tissue Integrity and Autofluorescence during the CODEX Multi-Cycle Experiment, Related to Figure 2, Table S1, and STAR Methods (A) FFPE tonsil tissue was stained with a cocktail of nine different DNA-conjugated antibodies. Antibodies were repeatedly rendered visible using complementary fluorescent oligonucleotides in 33 cycles with blank cycles to measure autofluorescence (no fluorescent oligonucleotides added) at the beginning (cycle 1), after each round of nine antibody rendering (cycles 11 and 21), and at the end (cycles 31, 32 and 33). The microscope light exposure times were kept constant for each antibody in each cycle. Hoechst nuclear stain was used as a reference marker. (B) Example images of nuclear marker Ki-67-Alexa488 and membrane markers CD20-ATTO550 and CD3-Alexa647 in cycles 4, and 20 are shown. Images are representative of cycles and nuclear and membrane markers that are not shown. Scale bar, 20 μm. Brightness and contrast adjusted. (C) Comparison of fluorescence intensity profiles from cycles 4 and 20, as measured by ImageJ software on the yellow lines in panel B. (D-I) Cells were segmented using the CODEX toolkit and clustered using X-shift (VorteX). (D) Mean marker expression for CD45 (ATTO550), CD20 (ATTO550), and CD3 (Alexa647) on lymphocytes (combined CD20+ cells and CD3+ cells). (E) Mean marker expression for Na-K-ATPase (Alexa488) and pan-cytokeratin (ATTO550) on epithelial cells (pan-cytokeratin+ cells). (F) Mean marker expression for Ki-67 (Alexa488) and CD45 (ATTO550) on proliferating cells (Ki-67+ cells). (G) Mean marker expression for HLA-DR (Alexa488) and CD45 (ATTO550) on antigen-presenting cells (HLA-DR+ cells). For lymphocytes, epithelial cells, and proliferating cells, 1500 cells were sampled; for antigen presenting cells, > 250 cells were sampled. (H) Mean autofluorescence levels on all cells combined measured in each channel in blank cycles 1, 11, 21 and 31 (no fluorescent DNA probes added). (I) Mean expression of the nuclear marker Hoechst per cell in cycle 20 versus cycle 1. (J) Representative image of H&E staining performed after the last blank cycle 33.
Figure 3
Figure 3
Spatial Composition of Immune Infiltrates in CRC (A) Schematic of CRC TMA assembly. Blue dots represent follicles/TLSs. (B) Representative TMA cores for CLR and DII patients depicted as seven-color images. (C) Voronoi diagrams of clustered CTs, merged to reduce complexity. (D) The eight immune clusters (n = 132,437 cells) and their frequencies in all CRC patients (top) and separated into CLR (n = 57,894 cells) and DII patients (n = 74,543 cells) (bottom). (E) PCA of CT abundances in CLR versus DII patients. (F) CT loadings in principal component 2. See also Figure S3, Figure S4A, and S4B, Data S2B, S2C, and S3–S6, and Table S1F.
Figure S3
Figure S3
CRC CODEX Antibody Panel, Related to Figure 3, Table S1, and STAR Methods Each marker of the CRC CODEX panel is depicted individually for one representative TMA spot (spot 36 of TMA 1; patient 18). CD30 and MMP12 were not detectable in any of the spots in either TMA, and are therefore not depicted. H&E and Hoechst stainings are shown for morphological reference. Scale bar, 200 μm. Brightness and contrast adjusted.
Figure S4
Figure S4
Pairwise Cell-Cell Contacts and CNs in Both Patient Groups, Related to Figure 4 (A) PCA correlating combinations of cell-type abundances in CLR versus DII patients. Cell-type loading in principal component 1 is shown. (B) Heatmap of likelihood ratios of direct cell-cell contacts for 14 selected clusters is shown for clusters with at least 100 unique interacting cells. Gray boxes indicate less than 100 unique interacting cells; these data were omitted. Pooled data from all TMA cores are shown. (C) Both CLR and DII patient groups were clustered separately. CNs were annotated manually. CN-0 corresponds to the imaging artifacts cluster; this cluster was omitted from the analysis shown in Figure 4B. Neighborhoods that did not have matching counterparts in the analysis of the combined groups are labeled “not defined.” (D) Frequencies of each CN from Figure 4B in each patient are shown. Frequencies are z scored by column to highlight major differences between CLR patients (blue) and DII patients (orange). (E) The contacts between CN 1 (T cell-enriched) and CN 4 (macrophage-enriched) were computed (see Methods) and are displayed as “CN mixing” by patient group. For each patient, the mean mixing score of four TMA cores is shown (p < 0.05, Student’s t test).
Figure 4
Figure 4
Characteristic CNs of the CRC iTME (A) Schematic of CN identification. (B) Identification of 9 distinct CNs based on the 28 original CTs and their respective frequencies (enrichment score) within each CN (pooled data from both patient groups). (C) Representative Voronoi diagrams of CNs for CLR and DII patients. Insets, H&E images. (D and E) Representative Voronoi diagrams of CNs were selected to show the nine different CNs (left panels) and corresponding seven-color images (right panels) in patient 33 (D) and 19 (E). Insets, H&E images. (F) Frequencies of CNs in CLR versus DII patients. Each point represents the mean CN frequency from four TMA cores per patient, and horizontal lines represent the means across patients (∗∗∗p < 0.001, Student’s t test). See also Figures S4C and S4D and Data S2D–S2G.
Figure 5
Figure 5
Tensor Decomposition Suggests Differences in Organization of the iTME (A) Schematic of the tensor decomposition analysis. (B) Decomposition results for CLR patients. Tissue modules (interacting pairs of CN modules and CT modules) correspond to an “immune compartment” (top) and a “tumor compartment” (bottom). (C) Decomposition results for DII patients. Tissue modules correspond to an “immune and tumor compartment” (top) and a “granulocyte compartment” (bottom). See also Figure S6C and Data S7.
Figure 6
Figure 6
CN Functional States Are Indicators of Antitumoral Immunity (A) Example Voronoi diagrams of TMA spots, colored by CN, with CD4+ (left) and CD8+ T cells (right) overlaid in each CN as points of the corresponding CN color. (B) Table of Cox proportional hazards regression results for T cell frequencies in the indicated CNs. Each CN-specific frequency was tested individually in a distinct model (DII patients: n = 18, 13 deaths). (C) Example staining for ICOS, Ki-67, and PD-1 on different T cell subsets. (D) Relative proportions of CD4+ (FOXP3) T cells, CD8+ T cells, and Treg cells positive for at least one of the functional markers (ICOS, Ki-67, and PD-1) in each CN. Pooled data from all patients are shown (cell numbers: CN-1, 17,822; CN-2, 735; CN-3, 4,031; CN-4, 11,753; CN-5, 4,695; CN-6, 2,681; CN-7, 4,504; CN-8, 1,368; CN-9, 2,884). (E) Violin plots of CN-specific CT frequencies of marker-positive CD4+ T cells, CD8+ T cells, and Treg cells in CN-1, CN-2, CN-4, and CN-6. Asterisks indicate significant differences in the CN-specific CT frequency below compared with the frequency in CN-2 (bulk tumor), tested across patients (p < 0.05, ∗∗p < 0.01, ∗∗∗p < 0.001, Student’s t test). (F) Receiver operating characteristic curves comparing the performance of L1-regularized logistic regression classifiers (CN-specific CT frequency versus overall frequency of marker-positive cells) over repeated holdout samples to classify patients by group. (G) Heatmap of estimated differential enrichment coefficients (p < 0.05, not adjusted for multiple tests). A positive coefficient (red) indicates that the corresponding CT is more enriched in DII patients in the given CN. (H) Estimated enrichment of Ki-67+ CD8+ T cells in CN-1 and Ki-67+ Treg cells in CN-4 for each patient. Horizontal lines represent the means across patients. (I) Estimated CN functional state alteration score for each CT. Variation corresponds to the distribution of the score across 10 resampling iterations. (J) Partial residual plot of the log frequency of PD-1+CD4+ T cells in CN-9 versus the estimated log hazard ratio with respect to overall survival in DII patients (p = 0.006; n = 18, 13 deaths; Cox proportional hazards regression). A pseudocount of 0.001 was added to the frequency for all patients when logarithms were computed. (K) Kaplan-Meier curves for overall survival in DII patients corresponding to the best splitting of DII patients into two groups along the CN-9-specific frequency of PD-1+CD4+ T cells. See also Figure S5, Figure S6A, and S6B, and STAR Methods.
Figure S5
Figure S5
Gating Strategy for Analysis of Checkpoint Molecule Expression on T Cells and Macrophage Populations, Related to Figure 6 (A) Representative dot plots from CellEngine are shown for each marker and population. (B) Heatmap of marker-positive cell populations per patient. (C) Frequencies of marker-positive cell populations per patient. Data are mean values from four biological replicates (TMA cores) per patient (p < 0.05, ∗∗p < 0.01, Student’s t test).
Figure S6
Figure S6
Heatmap of Estimated Differential Enrichment Coefficients, Feature Importance for the Classification Model, and Elbow Points for Tucker Tensor Decomposition, Related to Figure 6 and STAR Methods (A) Heatmap of estimated differential enrichment coefficients for cell types not shown in Figure 6G. Asterisks indicate CNs and cell types with a regression p value < 0.05 (not adjusted for multiple tests). A positive coefficient (red) indicates that the corresponding cell type is more enriched in DII patients than in CLR patients in the given CN. (B) Feature importance for classification model. Bar plot of absolute coefficient z-scores for CN-specific cell type frequencies, estimated from a model classifying patient groups using iterative resampling, as described in Figure 6F. The five CN-specific cell type frequencies with a coefficient importance of 0.3 or higher (left to red dotted line) were considered for assessment with respect to survival in DII patients. (C) Elbow points for Tucker tensor decomposition. Tensor decomposition loss for choices of rank in patient space, CN space, and cell-type space used for selection of decomposition rank in each patient group. Blue lines, one tissue module; red lines, two tissue modules. The elbow point was found at 6 CN modules and cell type modules (red line).
Figure 7
Figure 7
Altered Inter-CN Communication Favors Immunosuppression in DII Patients (A) Correlation of the frequency of Ki-67+CD8+ T cells in CN-1 (T cell enriched) and the frequency of Tregs in CN-4 (macrophage enriched) in each patient group. Spearman rank and Pearson correlation coefficients and p values are shown. (B) Schematic of the canonical correlation analysis (CCA). (C) The canonical correlation with respect to the frequencies of ICOS+, Ki-67+, and PD-1+ CD8+ T cells as well as Ki-67+ Treg cells in each pair of CNs was compared with a permuted null distribution within each patient group. Pairs of CNs whose observed canonical correlation with respect to these CTs was higher than 90% of permutations were connected by edges and visualized as a graph. (D) Conceptual framework for describing CRC iTME spatial behavior. (E) Model of differences in the iTME between CLR and DII patients with respect to CN organization (Figure 5), cellular function (Figure 6), and inter-CN communication (Figures 7A–7C).

References

    1. Agasti S.S., Wang Y., Schueder F., Sukumar A., Jungmann R., Yin P. DNA-barcoded labeling probes for highly multiplexed Exchange-PAINT imaging. Chem. Sci. (Camb.) 2017;8:3080–3091. - PMC - PubMed
    1. Ali H.R., Jackson H.W., Zanotelli V.R.T., Danenberg E., Fischer J.R., Bardwell H., Provenzano E., Ali H.R., Al Sa’d M., Alon S. Imaging mass cytometry and multiplatform genomics define the phenogenomic landscape of breast cancer. Nat. Cancer. 2020;1:163–175. - PubMed
    1. Angelo M., Bendall S.C., Finck R., Hale M.B., Hitzman C., Borowsky A.D., Levenson R.M., Lowe J.B., Liu S.D., Zhao S. Multiplexed ion beam imaging of human breast tumors. Nat. Med. 2014;20:436–442. - PMC - PubMed
    1. Arnol D., Schapiro D., Bodenmiller B., Saez-Rodriguez J., Stegle O. Modeling Cell-Cell Interactions from Spatial Molecular Data with Spatial Variance Component Analysis. Cell Rep. 2019;29:202–211.e6. - PMC - PubMed
    1. Binnewies M., Roberts E.W., Kersten K., Chan V., Fearon D.F., Merad M., Coussens L.M., Gabrilovich D.I., Ostrand-Rosenberg S., Hedrick C.C. Understanding the tumor immune microenvironment (TIME) for effective therapy. Nat. Med. 2018;24:541–550. - PMC - PubMed

Publication types