. 2020 Sep 1;32(3):391-403.e6.
doi: 10.1016/j.cmet.2020.07.009. Epub 2020 Aug 6.

Induction of a Timed Metabolic Collapse to Overcome Cancer Chemoresistance

Affiliations

Induction of a Timed Metabolic Collapse to Overcome Cancer Chemoresistance

Nick van Gastel et al. Cell Metab. .

Abstract

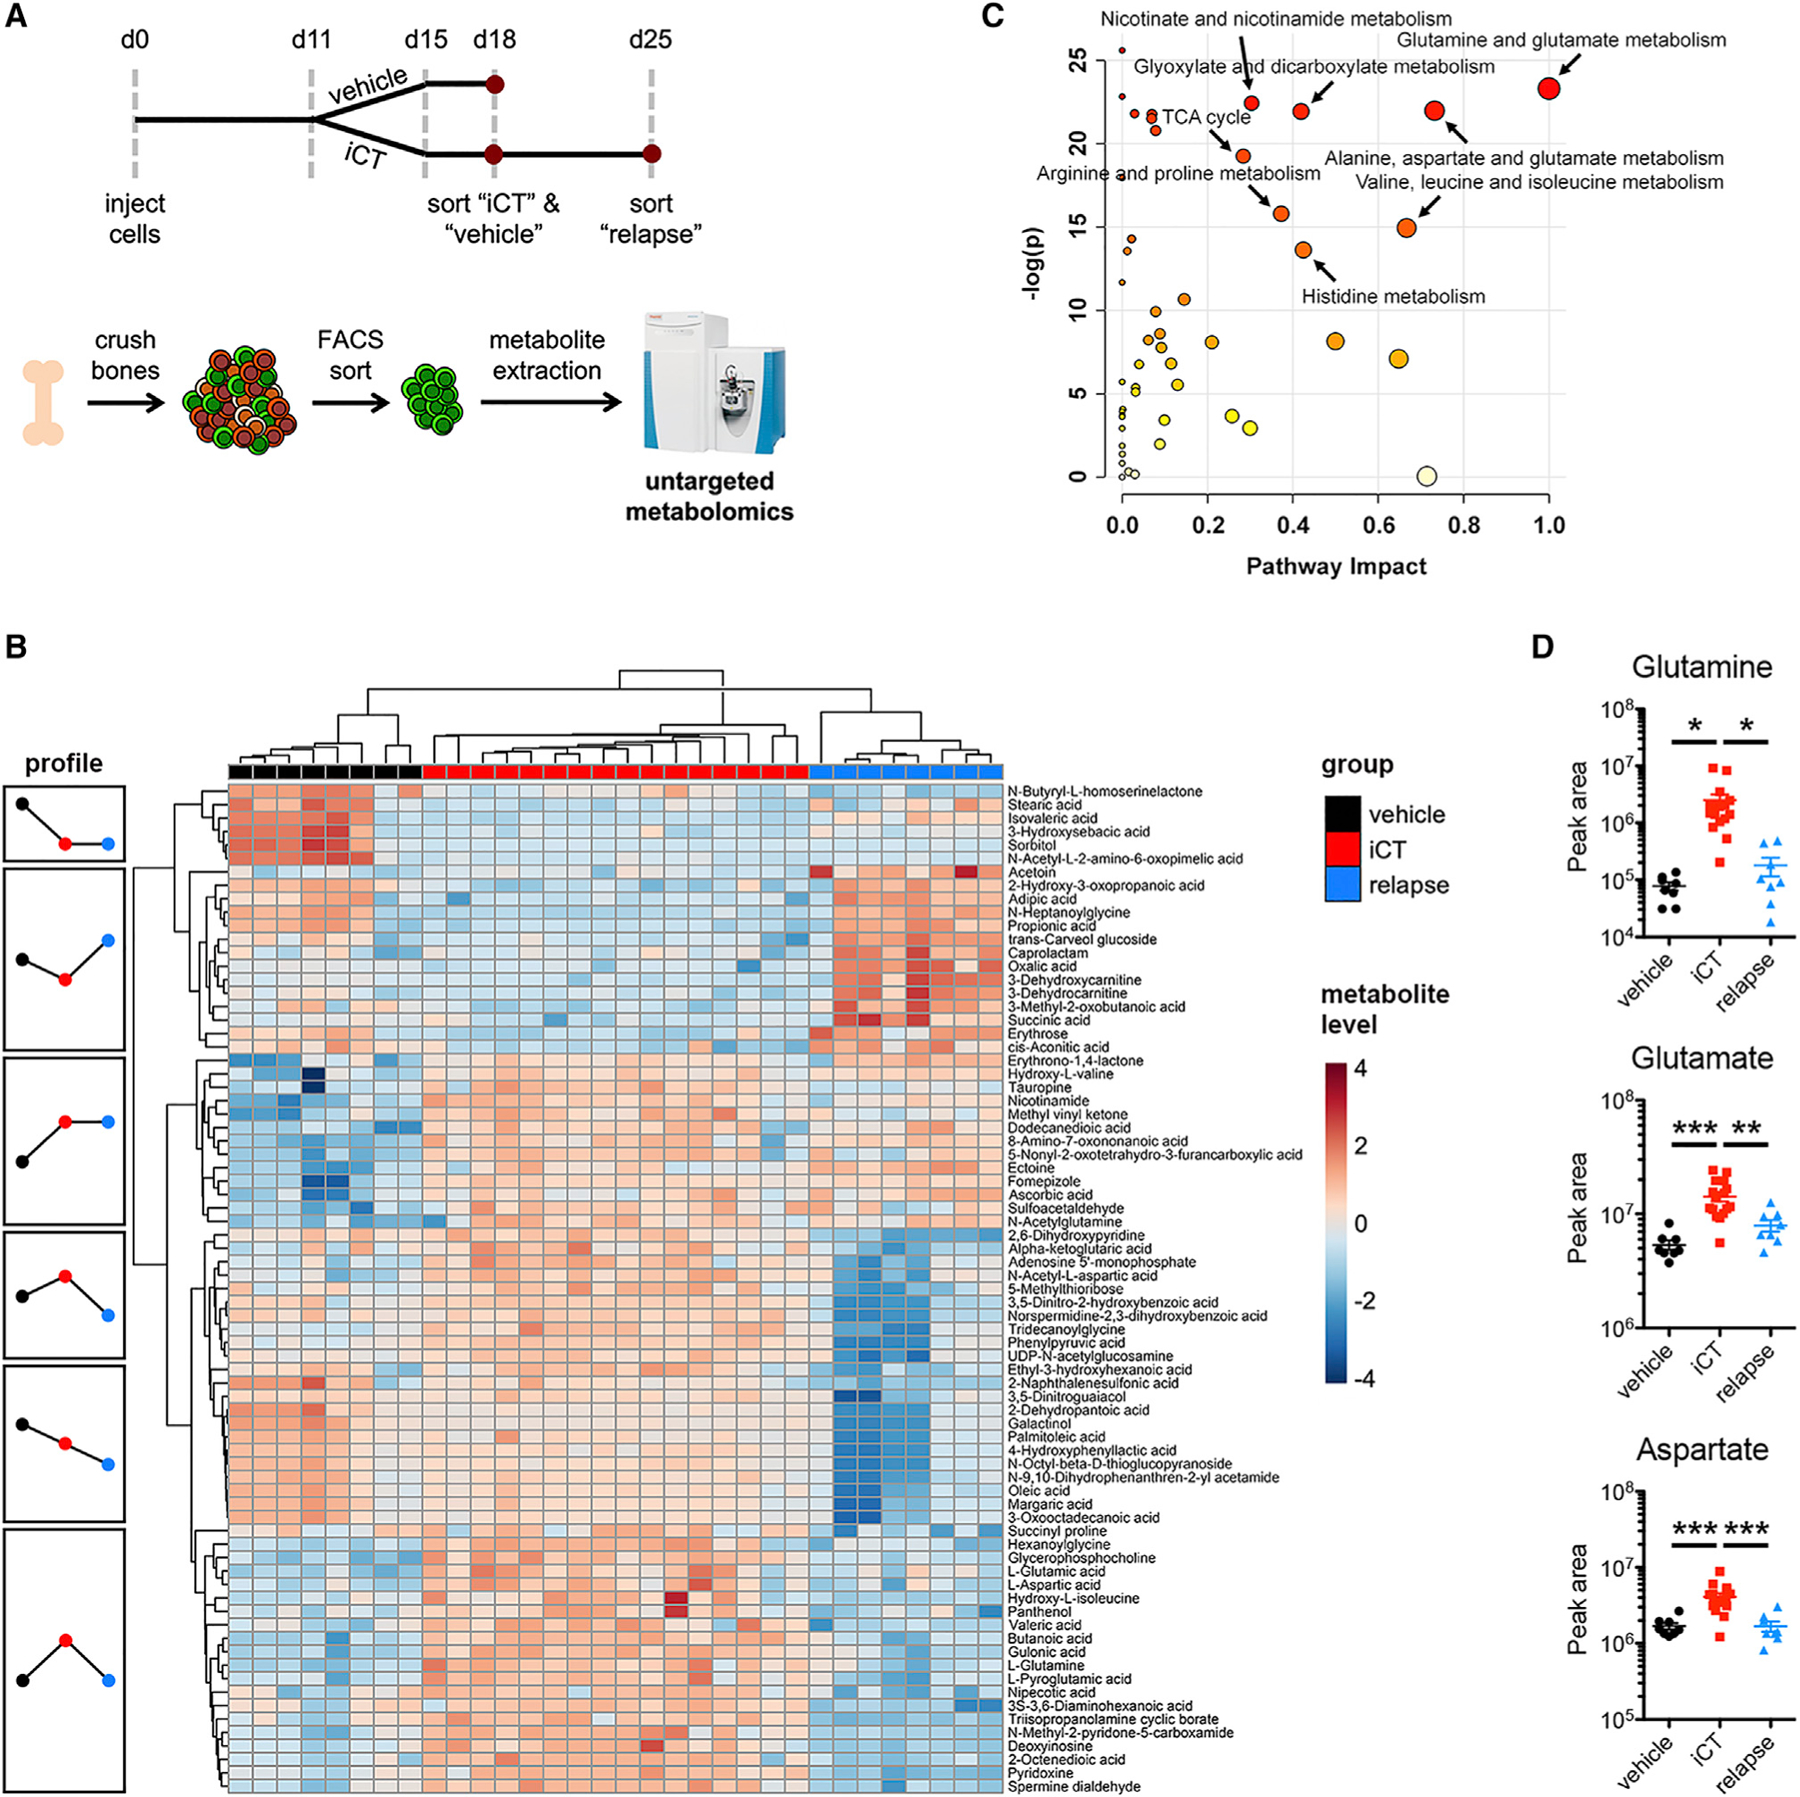
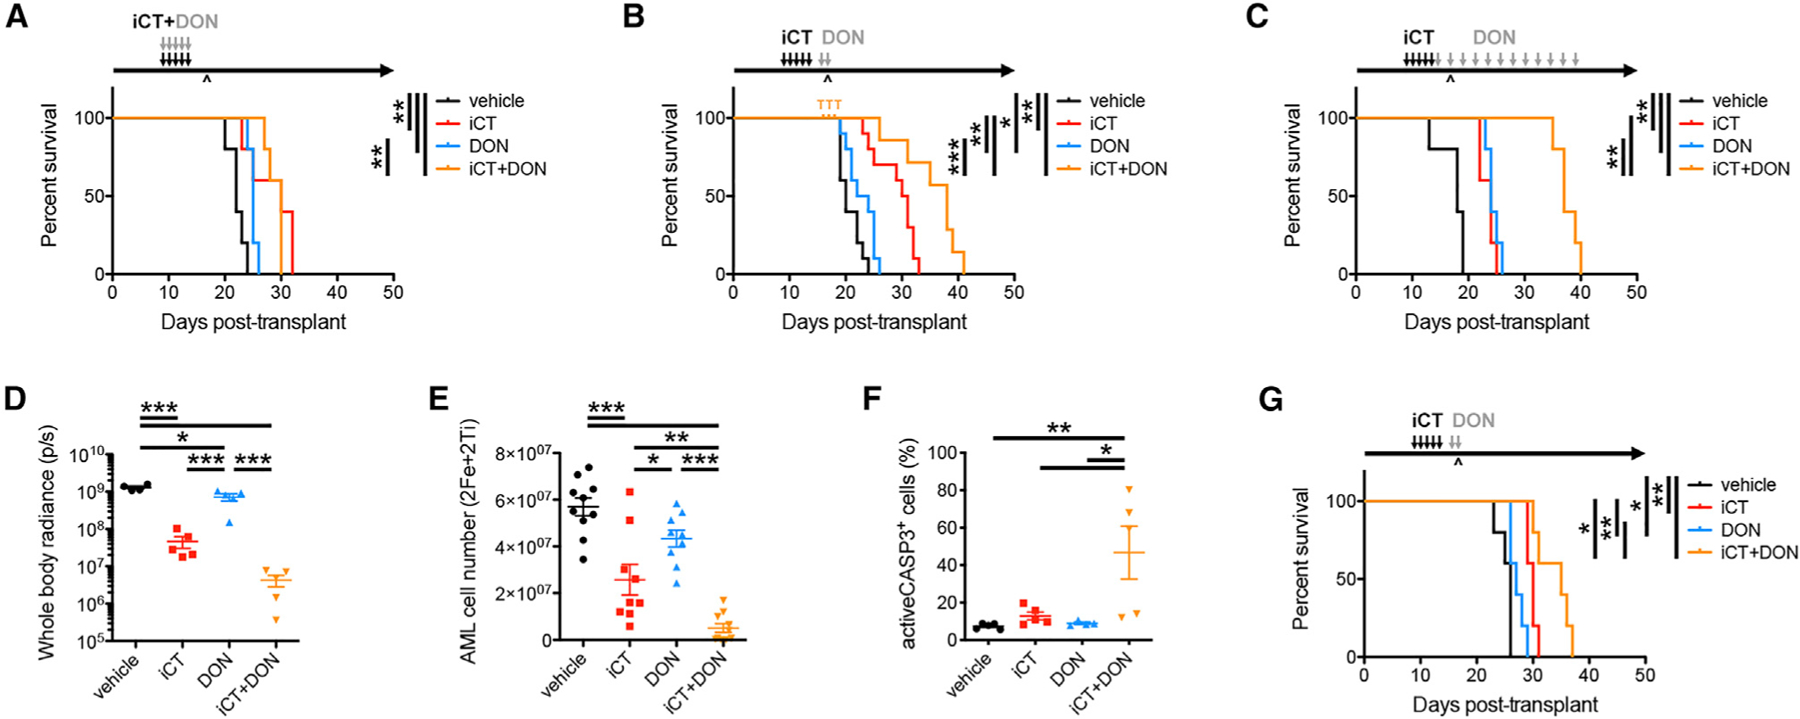
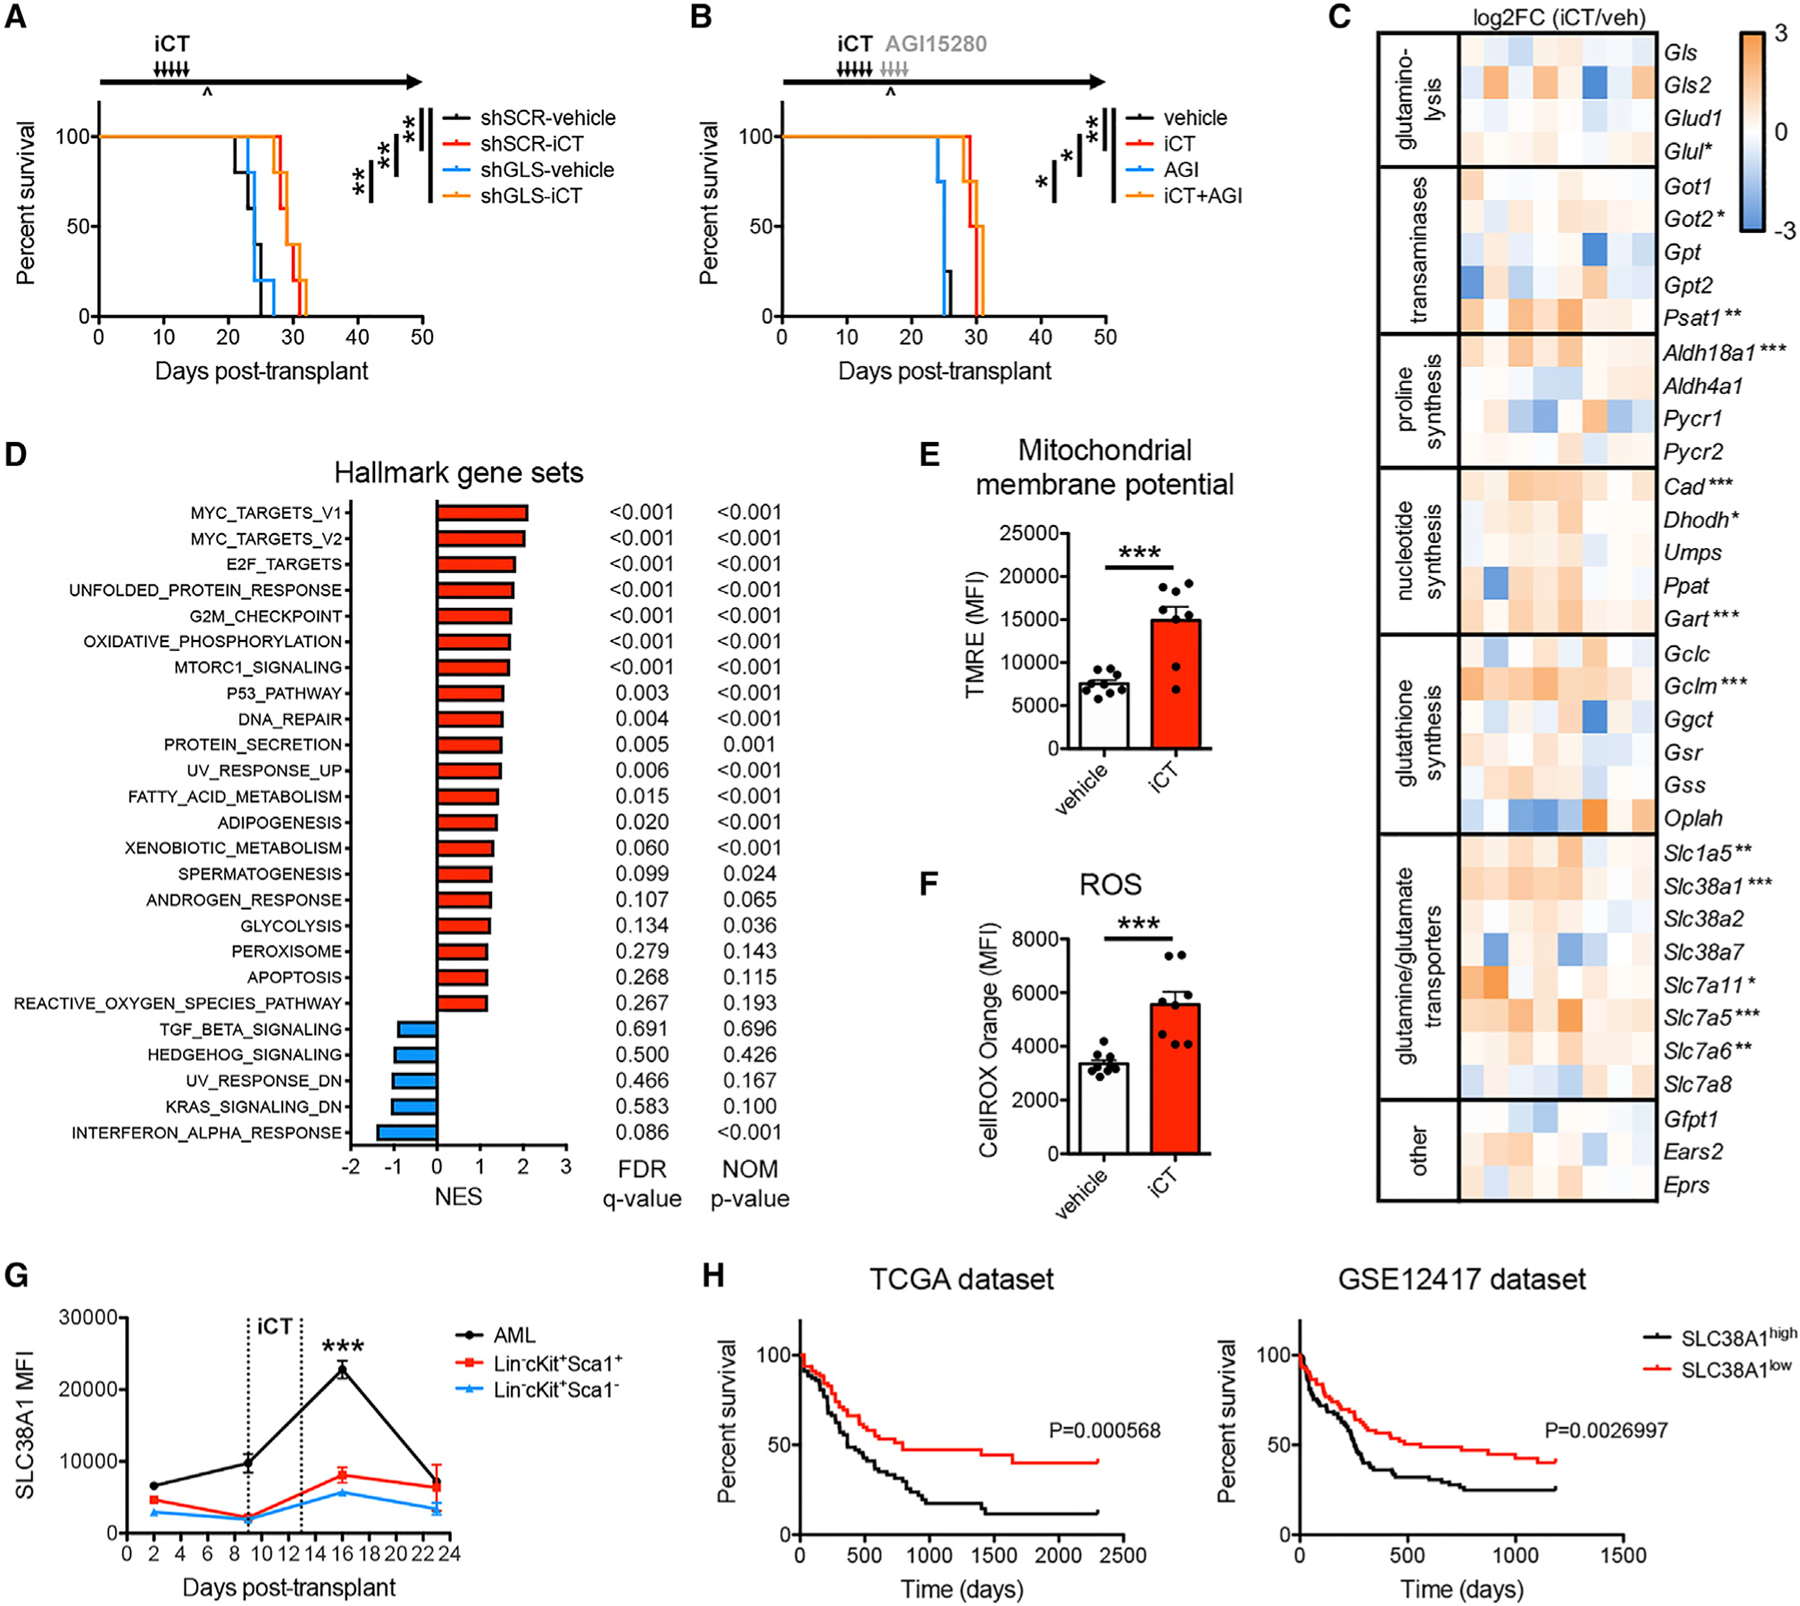
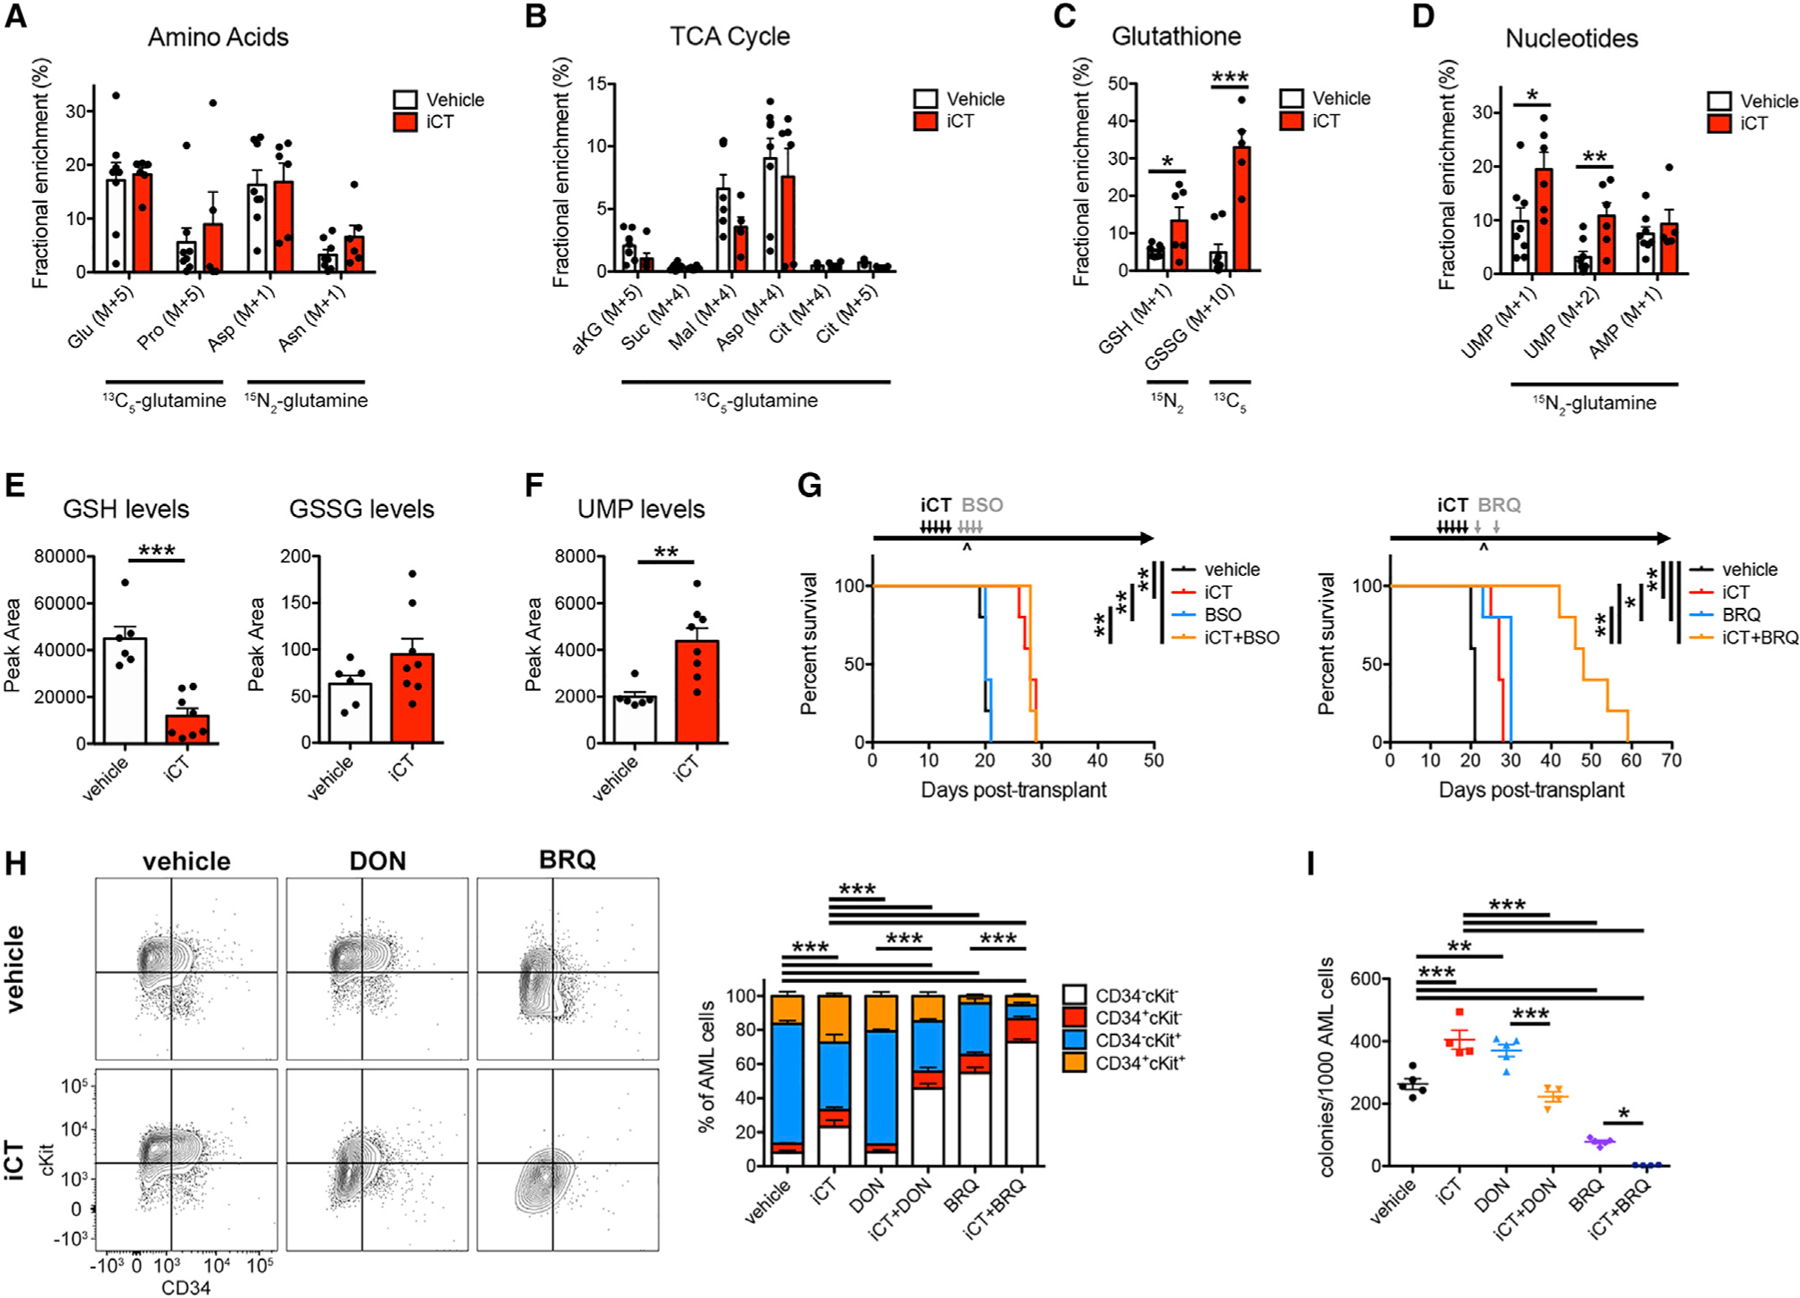
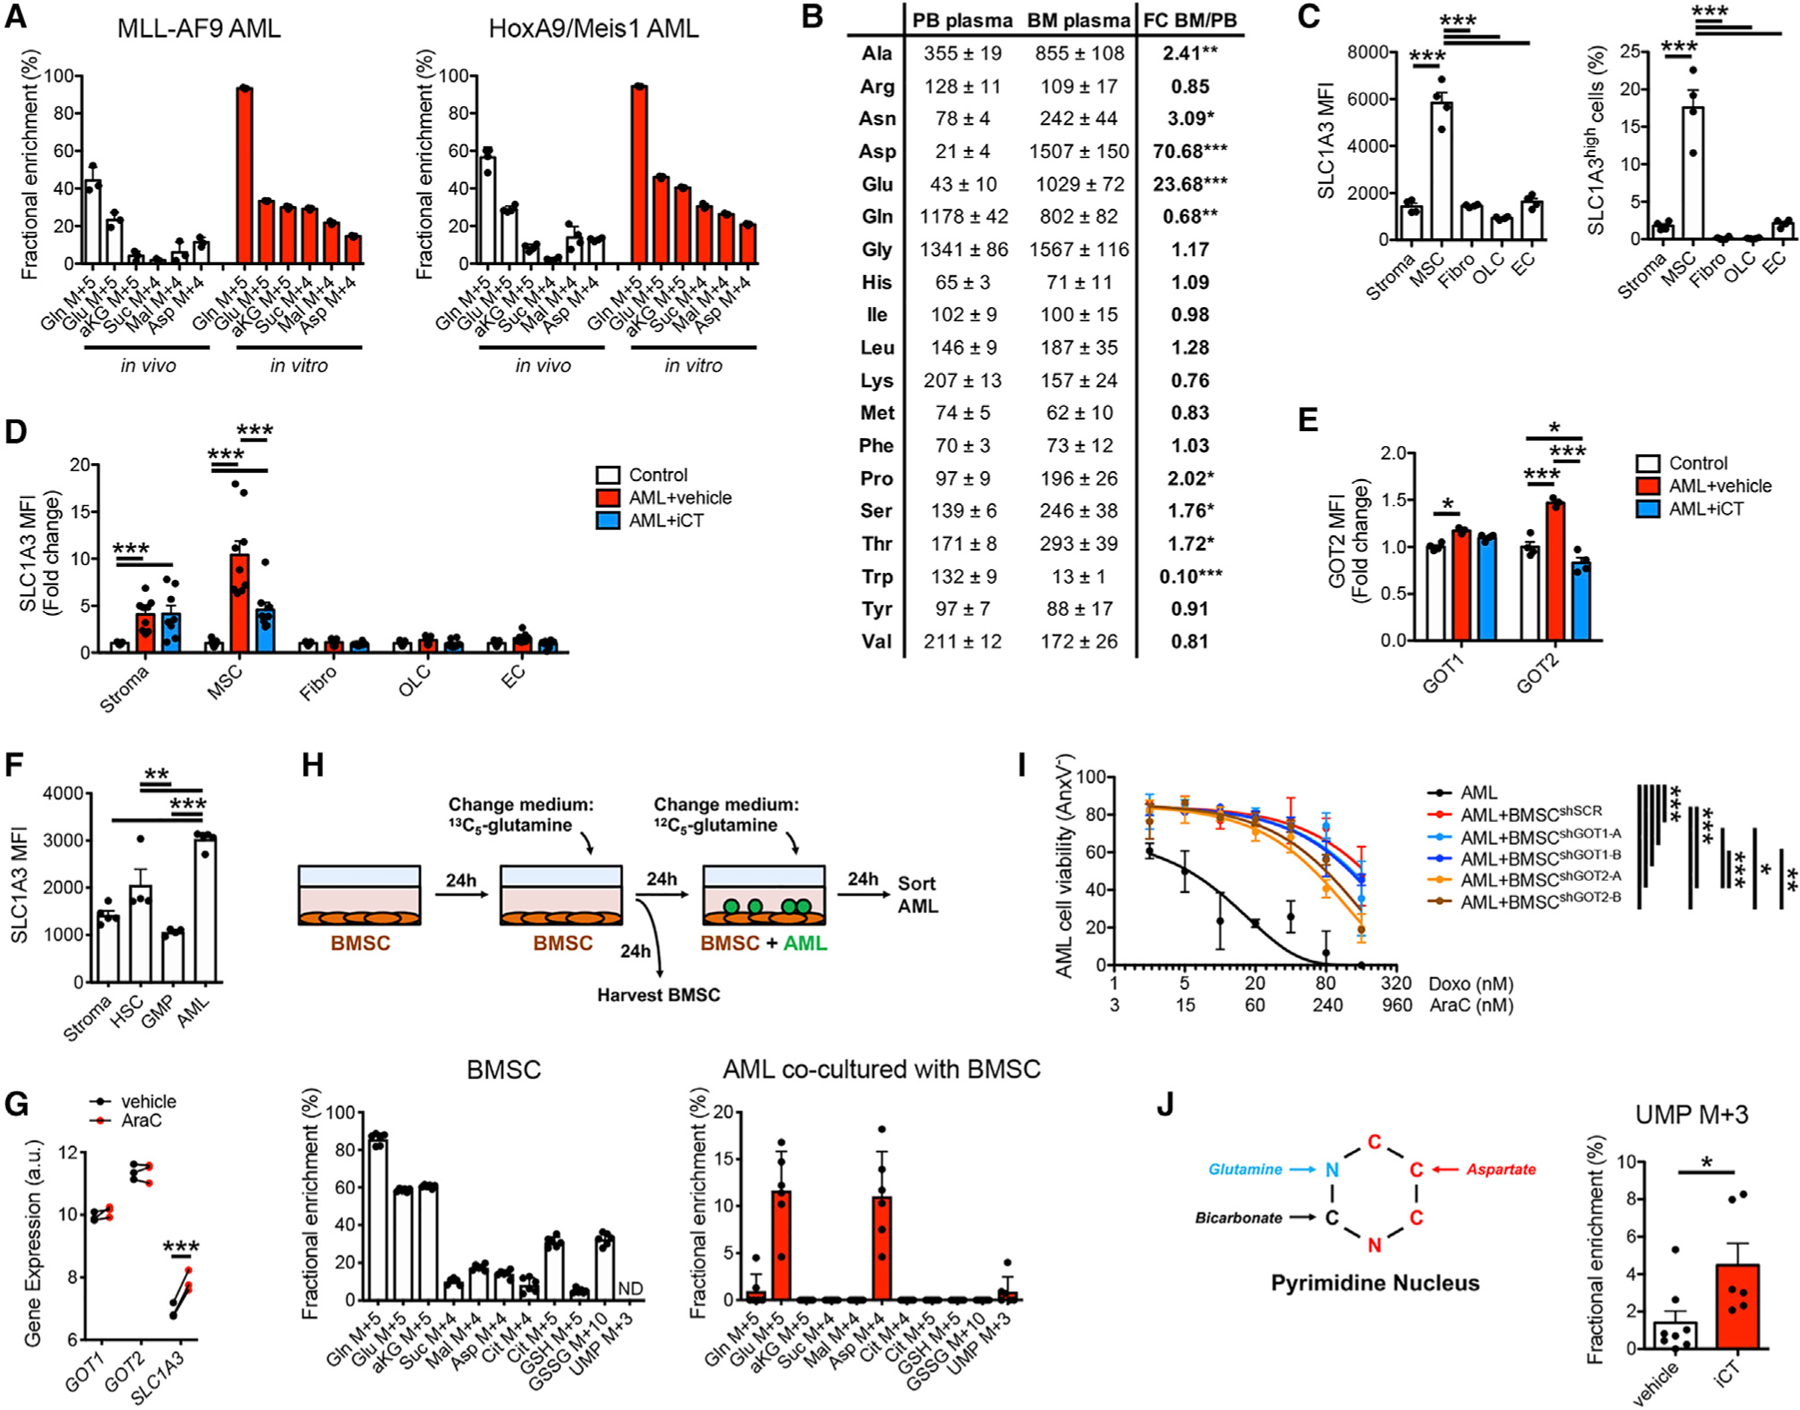
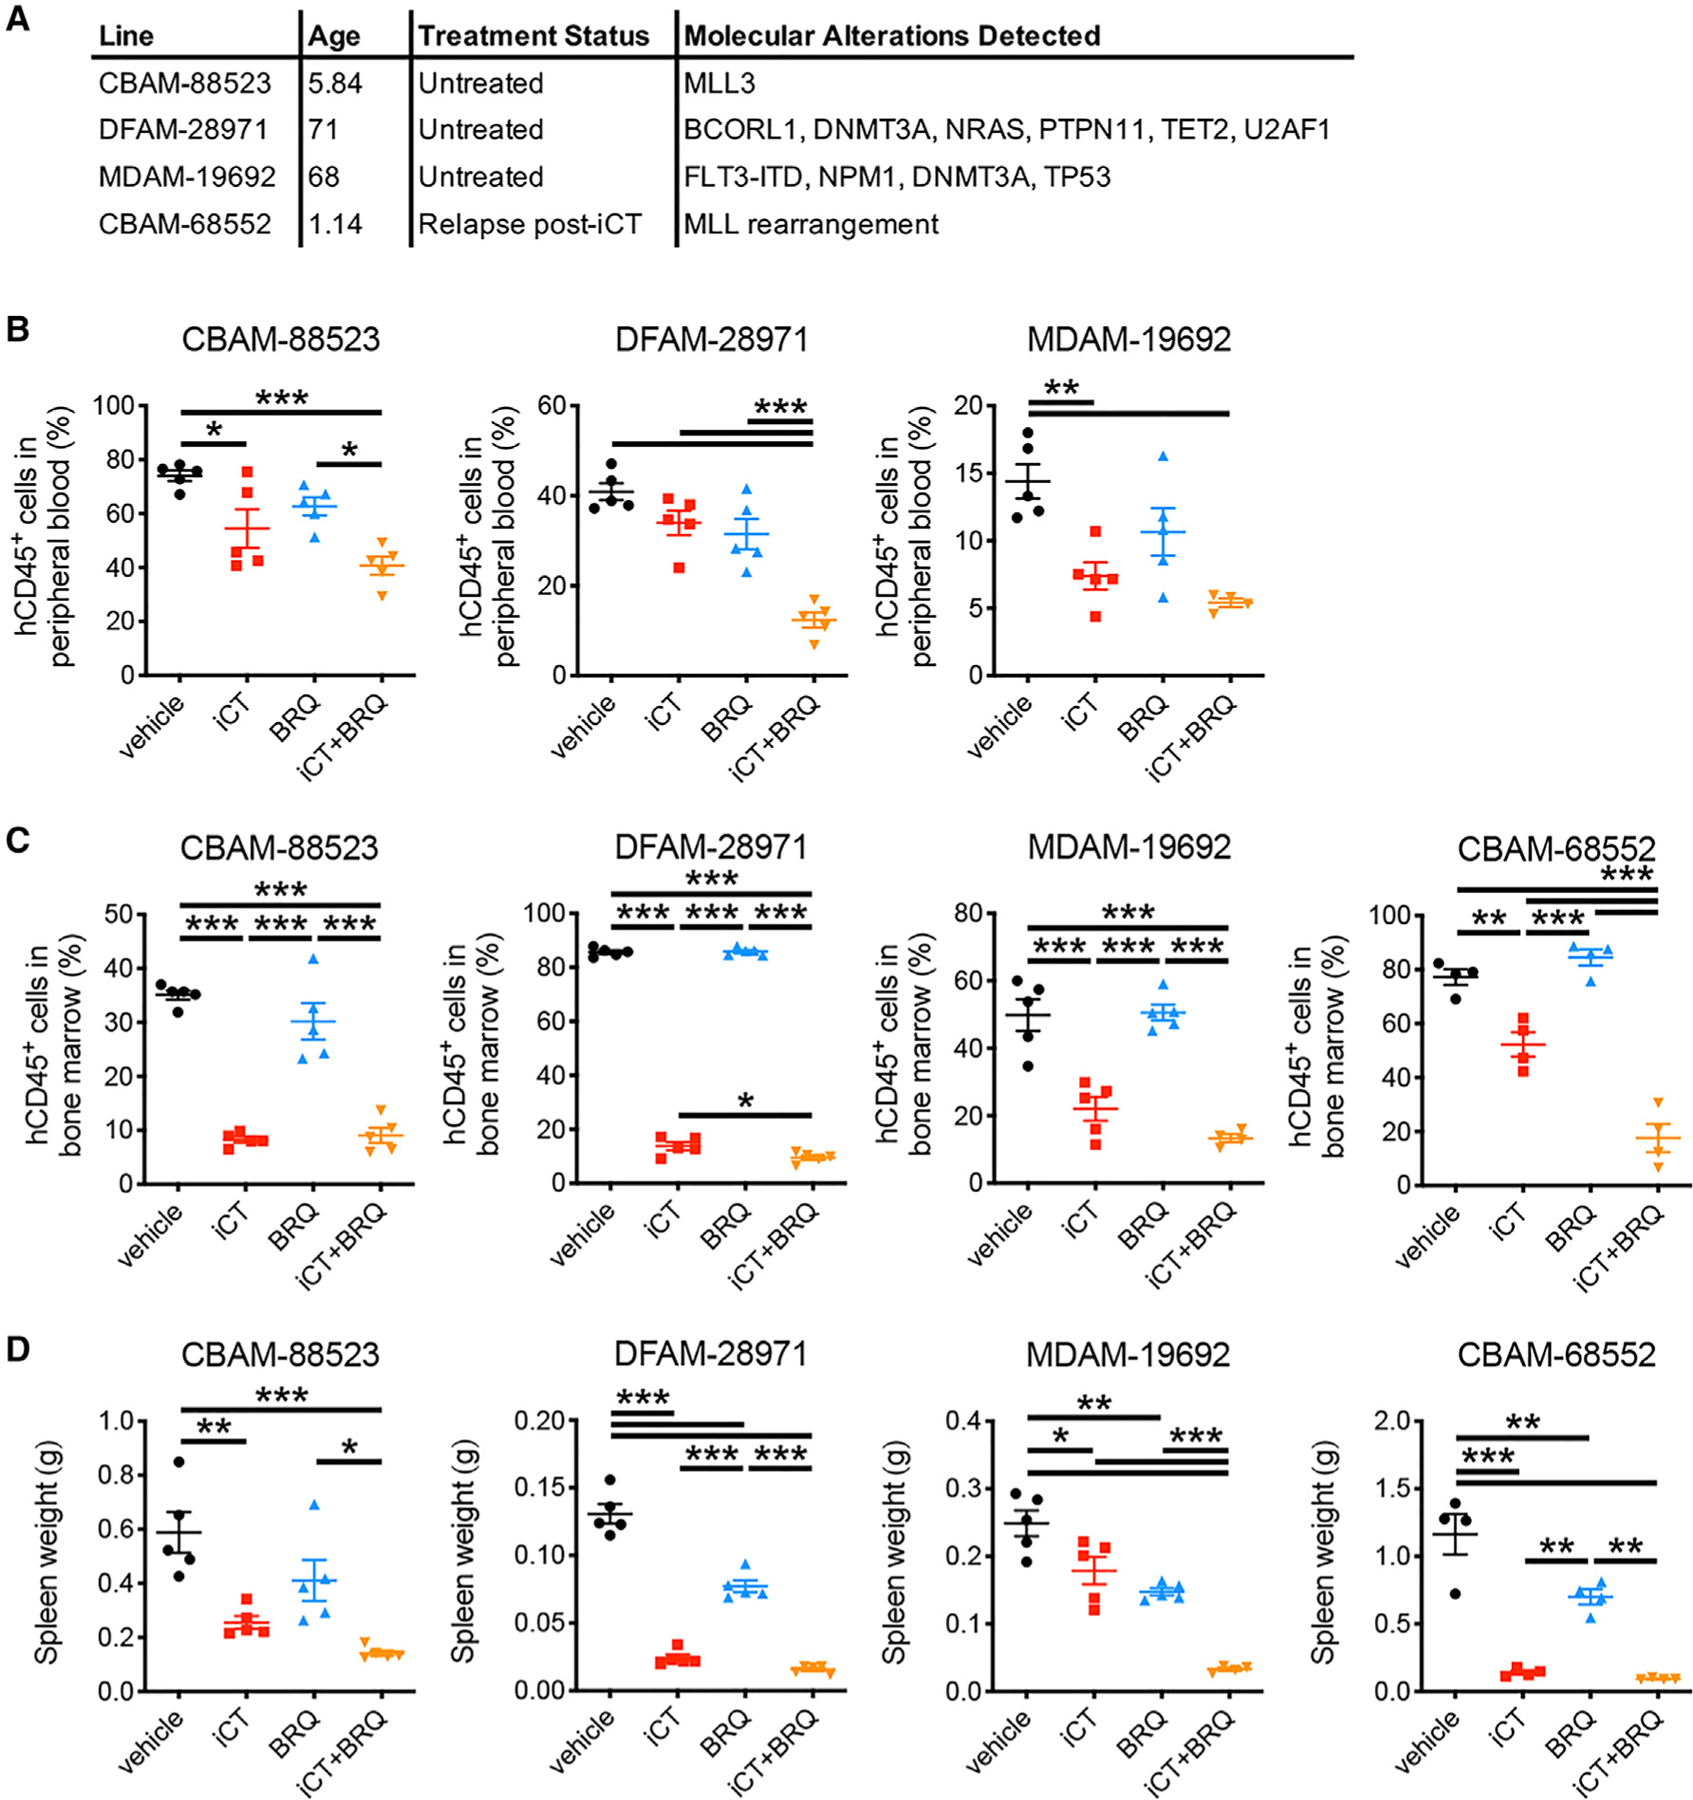
Cancer relapse begins when malignant cells pass through the extreme metabolic bottleneck of stress from chemotherapy and the byproducts of the massive cell death in the surrounding region. In acute myeloid leukemia, complete remissions are common, but few are cured. We tracked leukemia cells in vivo, defined the moment of maximal response following chemotherapy, captured persisting cells, and conducted unbiased metabolomics, revealing a metabolite profile distinct from the pre-chemo growth or post-chemo relapse phase. Persisting cells used glutamine in a distinctive manner, preferentially fueling pyrimidine and glutathione generation, but not the mitochondrial tricarboxylic acid cycle. Notably, malignant cell pyrimidine synthesis also required aspartate provided by specific bone marrow stromal cells. Blunting glutamine metabolism or pyrimidine synthesis selected against residual leukemia-initiating cells and improved survival in leukemia mouse models and patient-derived xenografts. We propose that timed cell-intrinsic or niche-focused metabolic disruption can exploit a transient vulnerability and induce metabolic collapse in cancer cells to overcome chemoresistance.

Keywords: acute myeloid leukemia; aspartate; bone marrow niche; cell metabolism; chemotherapy; glutamine; mouse models; patient-derived xenografts; pyrimidine synthesis; tumor microenvironment.


Conflict of interest statement

Declaration of Interests D.B.S. is co-founder and owns equity in Clear Creek Bio. P.P.H. is a consultant for Auron Therapeutics. M.G.V.H. is a consultant and SAB member for Agios Pharmaceuticals, Aeglea Biotherapeutics, iTeos Therapeutics, and Auron Therapeutics. D.T.S. is a director and equity holder of Agios Pharmaceuticals, Magenta Therapeutics, Editas Medicines, Clear Creek Bio, and LifeVaultBio; he is a founder of Fate Therapeutics and Magenta Therapeutics and a consultant to FOG Pharma, VcanBio, and Flagship Pioneering. N.v.G., A. Schajnovitz, T.O., and D.T.S. are inventors on patents related to this work.

Figures

Figure 1.
Figure 1.. AML Cells Exhibit Transient Metabolic Changes in Response to Chemotherapy
(A) Schematic overview of the experimental design. iCT, induction chemotherapy (5 days of cytarabine 100 mg/kg + 3 days of doxorubicin 3 mg/kg i.p.). (B) Heatmap of the metabolic profile of MLL-AF9 AML cells obtained from mice with vehicle treatment, at 3 days after iCT (iCT group; representing the moment of maximal response) or at 10 days after iCT (relapse). (C) Metabolic Pathway Enrichment Analysis using putatively identified metabolites of the iCT versus vehicle and relapse groups. Pathway impact is a measure for the percentage of metabolites that were measured in a given pathway, as well as their relative importance in that pathway. (D) Levels of glutamine, glutamate, and aspartate in vehicle, iCT, or relapse MLL-AF9 AML cells as measured by untargeted metabolomics. Data are represented as mean ± standard error of the mean (SEM). *p < 0.05, **p < 0.01, ***p < 0.001. See also Figure S1.
Figure 2.
Figure 2.. Timed Inhibition of Glutamine Metabolism Overcomes Chemoresistance in AML
(A–C) Survival curves of MLL-AF9 AML-bearing mice treated with iCT and/or 6-diazo-5-oxo-L-norleucine (DON; 0.3 mg/kg i.p.) concomitantly (A, n = 5 mice per group) or sequentially (B and C). For sequential treatments, mice were either treated with 2 doses of DON at the moment of maximal response (B, n = 10 mice per group) or continuously with DON every other day following iCT (C, n = 5 mice per group). T, death due to drug toxicity; ^, moment of maximal response. (D and E) Disease burden of MLL-AF9 AML-bearing mice treated sequentially with iCT and/or DON (regimen as in B), determined 1 day after the last dose of DON through bioluminescence imaging (D) or flow cytometry (E). (F) Percentage of apoptotic cells in MLL-AF9 AML cells obtained from mice treated sequentially with iCT and/or DON (regimen as in B), determined 1 day after the last dose of DON. (G) Survival curves of HoxA9/Meis1 AML-bearing mice treated sequentially with iCT and/or 2 doses of DON (0.3 mg/kg i.p.) specifically targeting the moment of maximal response (n = 5 mice per group). Data are represented as mean ± SEM. *p < 0.05, **p < 0.01, ***p < 0.001. See also Figure S2.
Figure 3.
Figure 3.. Residual AML Cells Do Not Depend on Glutaminase
(A) Survival curve of mice engrafted with MLL-AF9 AML cells transduced with scrambled short hairpin RNA (shSCR) or shRNA targeting glutaminase (shGLS), treated with iCT or vehicle (n = 5 mice per group). (B) Survival curves of MLL-AF9 AML-bearing mice treated sequentially with iCT and/or 4 days of AGI15280 (150 mg/kg twice daily, p.o.) targeting the moment of maximal response (n = 4 mice per group). ^, moment of maximal response. (C) Heatmap of RNA sequencing data of genes related to glutamine metabolism in MLL-AF9 AML cells obtained from mice treated with vehicle or iCT, at the moment of maximal response. (D) Gene set enrichment analysis in iCT- versus vehicle-treated MLL-AF9 AML cells obtained at the moment of maximal response. NES, normalized enrichment score; FDR, false discovery rate; NOM, nominal. (E and F) Mitochondrial membrane potential measured by tetramethylrhodamine ethyl ester (TMRE) staining (E), and levels of ROS measured by CellROX Orange staining (F) in MLL-AF9 AML cells obtained from mice treated with vehicle or iCT, at the moment of maximal response. (G) Flow cytometric analysis of SLC38A1 protein levels on MLL-AF9 AML cells and on LincKit+Sca1+ and LincKit+Sca1 normal hematopoietic stem and progenitor cells, at different times during the course of iCT treatment. (H) Survival curves of AML patients grouped according to the expression of SLC38A1 above or below the median. Data were obtained from the TCGA dataset or the GSE12417 dataset. Data are represented as mean ± SEM. *p < 0.05, **p < 0.01, ***p < 0.001. See also Figure S3.
Figure 4.
Figure 4.. Glutamine Metabolism Drives AML Chemoresistance by Fueling Pyrimidine Synthesis
(A–D) Contribution of glutamine carbon and nitrogen to amino acids (A), the TCA cycle (B), glutathione (C), and nucleotides (D) in MLL-AF9 AML cells obtained from vehicle- and iCT-treated mice at the moment of maximal response. Glu, glutamate; Pro, proline; Asp, aspartate; Asn, asparagine; Akg, alpha-ketoglutarate; Suc, succinate; Mal, malate; Cit, citrate; GSH, reduced glutathione; GSSG, oxidized glutathione; UMP, uridine 5′-monophosphate; AMP, adenosine 5′-mono-phosphate. (E and F) Levels of GSH and GSSG (E) or UMP (F) in MLL-AF9 AML cells obtained from vehicle- and iCT-treated mice at the moment of maximal response. (G) Survival curves of MLL-AF9 AML-bearing mice treated sequentially with iCT and/or L-buthionine-sulfoximine (BSO, 2.23 mg/kg twice daily, i.p. + 4.45 mg/ml in drinking water; n = 5 mice per group; left) or Brequinar (BRQ, 50 mg/kg, i.p.; n = 5 mice per group; right). ^, moment of maximal response. (H and I) Flow cytometric analysis of CD34 and cKit levels (H) and colony-forming capacity (I) in AML cells obtained from mice sequentially treated with iCT and/or DON (regimen as in Figure 2B) or BRQ (regimen as in G), determined 4 days after the last dose of iCT. Data are represented as mean ± SEM. *p < 0.05, **p < 0.01, ***p < 0.001. See also Figure S4.
Figure 5.
Figure 5.. Bone Marrow Stromal Cell-Derived Aspartate Supports Pyrimidine Synthesis in AML Cells
(A) Labeling of glutamine metabolism and TCA cycle metabolites in MLL-AF9 and HoxA9/Meis1 AML cells by 13C5-glutamine in vivo and in vitro (10 min labeling). (B) LC-MS-based quantification of amino acid levels in PB and BM plasma of control mice. FC, fold change. (C) Flow cytometric analysis of SLC1A3 protein levels on BMSC subpopulations in control mice. Stroma, total stromal cells (CD45Ter119); MSC, mesenchymal stromal cells (CD45Ter119CD31LepR+), Fibro: fibroblasts (CD45Ter119CD31LepR Sca1+CD90+), OLC, osteolineage cells: (CD45Ter119CD31LepRSca1CD90lowCD105+); EC, endothelial cells (CD45Ter119CD31+CD105+); MFI, mean fluorescence intensity. (D) Flow cytometric analysis of SLC1A3 protein levels on BMSC subpopulations obtained from vehicle- or iCT-treated MLL-AF9 AML-bearing mice at the moment of maximal response, compared with control mice. (E) Flow cytometric analysis of intracellular GOT1 or GOT2 protein levels in MSCs obtained from vehicle- or iCT-treated MLL-AF9 AML-bearing mice at the moment of maximal response, compared with control mice. (F) Flow cytometric analysis of SLC1A3 protein levels on stromal cells (CD45Ter119), hematopoietic stem cells (HSCs; LincKit+Sca1+CD48CD150+), granulocyte-monocyte progenitor cells (GMP; Lin-cKit+Sca1CD34+CD16/32+), and MLL-AF9 AML cells. (G) Expression of GOT1, GOT2, and SLC1A3 by human AML PDX cells isolated from mice treated with cytarabine or vehicle. Data obtained from Farge et al. (2017) (GSE97631). (H) 13C5-glutamine tracing in co-cultures of BMSC and MLL-AF9 AML cells. (I) Viability of MLL-AF9 AML cells in monoculture or co-culture with BMSCs transduced with shSCR, shGOT1, or shGOT2, in response to different doses of cytarabine (AraC) and doxorubicin (Doxo). (J) Labeling of UMP by 13C5-glutamine in MLL-AF9 AML cells obtained from vehicle- or iCT-treated mice at the moment of maximal response. Data are represented as mean ± SEM. *p < 0.05, **p < 0.01, ***p < 0.001. See also Figure S5.
Figure 6.
Figure 6.. Human Chemoresistant AML Cells Are Sensitive to Single-Dose, Timed Inhibition of Pyrimidine Synthesis
(A) Characteristics of the PDX lines. (B–D) Percentage of human cells in the peripheral blood (B), bone marrow (C), or spleen weights (D) of PDX-engrafted mice treated sequentially with iCT (5 days of cytarabine 50 mg/kg + 3 days of doxorubicin 1.5 mg/kg i.v.) and/or Brequinar (BRQ, 25 mg/kg i.p.; given at day 2 after iCT), determined at day 4 after iCT. n = 4–5 mice per group. Data are represented as mean ± SEM. *p < 0.05, **p < 0.01, ***p < 0.001.

Comment in

References

    1. Bajzikova M, Kovarova J, Coelho AR, Boukalova S, Oh S, Rohlenova K, Svec D, Hubackova S, Endaya B, Judasova K, et al. (2019). Reactivation of dihydroorotate dehydrogenase-driven pyrimidine biosynthesis restores tumor growth of respiration-deficient cancer cells. Cell Metab 29, 399–416.e10. - PMC - PubMed
    1. Baryawno N, Przybylski D, Kowalczyk MS, Kfoury Y, Severe N, Gustafsson K, Kokkaliaris KD, Mercier F, Tabaka M, Hofree M, et al. (2019). A cellular taxonomy of the bone marrow stroma in homeostasis and leukemia. Cell 177, 1915–1932.e16. - PMC - PubMed
    1. Behrmann L, Wellbrock J, and Fiedler W (2018). Acute myeloid leukemia and the bone marrow niche- take a closer look. Front. Oncol 8, 444. - PMC - PubMed
    1. Bond MR, and Hanover JA (2015). A little sugar goes a long way: the cell biology of O-GlcNAc. J. Cell Biol 208, 869–880. - PMC - PubMed
    1. Boukalova S, Hubackova S, Milosevic M, Ezrova Z, Neuzil J, and Rohlena J (2020). Dihydroorotate dehydrogenase in oxidative phosphorylation and cancer. Biochim. Biophys. Acta Mol. Basis Dis. 1866, 165759. - PubMed

Publication types

Substances