. 2020 Oct 20;95(16):e2259-e2270.
doi: 10.1212/WNL.0000000000010612. Epub 2020 Aug 6.

Association of epileptiform abnormalities and seizures in Alzheimer disease

Affiliations

Association of epileptiform abnormalities and seizures in Alzheimer disease

Alice D Lam et al. Neurology. .

Abstract

Objective: To examine the relationship between scalp EEG biomarkers of hyperexcitability in Alzheimer disease (AD) and to determine how these electric biomarkers relate to the clinical expression of seizures in AD.

Methods: In this cross-sectional study, we performed 24-hour ambulatory scalp EEGs on 43 cognitively normal elderly healthy controls (HC), 41 participants with early-stage AD with no history or risk factors for epilepsy (AD-NoEp), and 15 participants with early-stage AD with late-onset epilepsy related to AD (AD-Ep). Two epileptologists blinded to diagnosis visually reviewed all EEGs and annotated all potential epileptiform abnormalities. A panel of 9 epileptologists blinded to diagnosis was then surveyed to generate a consensus interpretation of epileptiform abnormalities in each EEG.

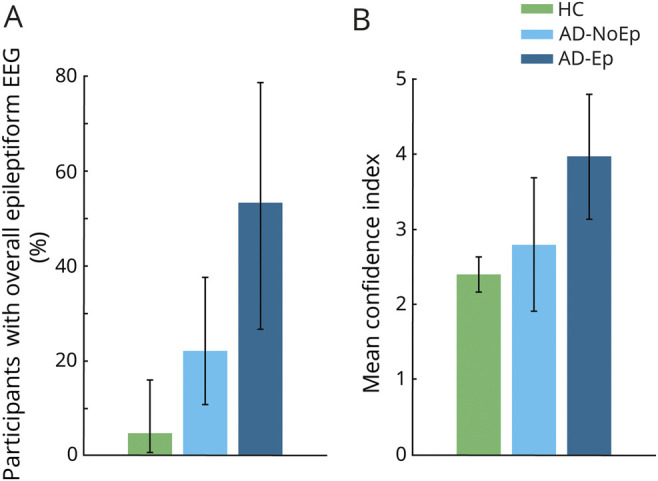
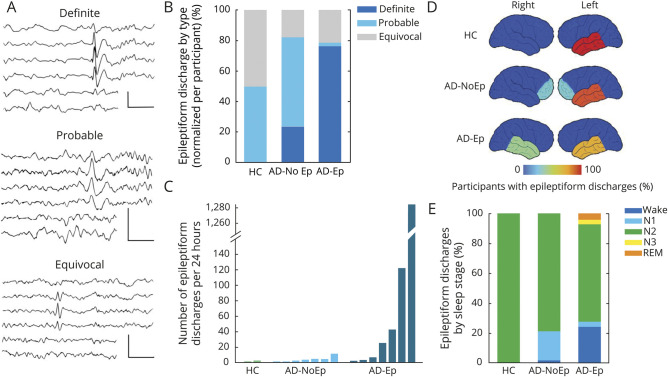
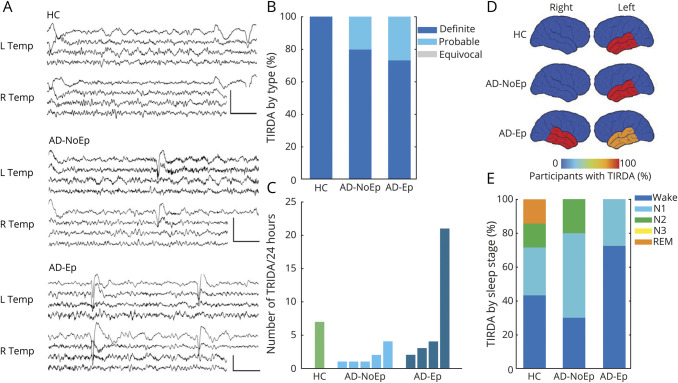
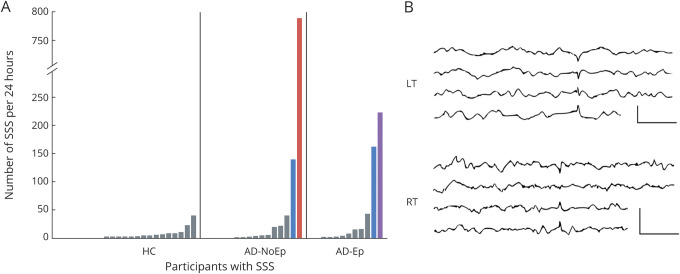
Results: Epileptiform abnormalities were seen in 53% of AD-Ep, 22% of AD-NoEp, and 4.7% of HC. Specific features of epileptiform discharges, including high frequency, robust morphology, right temporal location, and occurrence during wakefulness and REM, were associated with clinical seizures in AD. Multiple EEG biomarkers concordantly demonstrated a pattern of left temporal lobe hyperexcitability in early stages of AD, whereas clinical seizures in AD were often associated with bitemporal hyperexcitability. Frequent small sharp spikes were specifically associated with epileptiform EEGs and thus identified as a potential biomarker of hyperexcitability in AD.

Conclusion: Epileptiform abnormalities are common in AD but not all equivalent. Specific features of epileptiform discharges are associated with clinical seizures in AD. Given the difficulty recognizing clinical seizures in AD, these EEG features could provide guidance on which patients with AD are at high risk for clinical seizures.


Figures

Figure 1
Figure 1. Epileptiform abnormalities in AD
(A) Percentage of participants with an overall epileptiform EEG based on expert consensus. Error bars show the 95% confidence interval for the population proportion. (B) Mean confidence index for rating overall epileptiform EEGs in each group. Error bars show the 95% confidence interval of the mean. AD = Alzheimer disease; AD-Ep = AD with epilepsy; AD-NoEp = AD with no epilepsy; HC = healthy controls.
Figure 2
Figure 2. Characterization of epileptiform discharges in AD
(A) Representative examples of definite, probable, and equivocal epileptiform discharges arising from the left temporal region in AD-Ep1, AD-NoEp7, and HC1, respectively. EEG channels (top to bottom): Fp1-ave, F7-ave, T1-ave, T3-ave, T5-ave, and O1-ave. Calibration bars: 100 µV, 500 milliseconds. (B) Averaged distribution of epileptiform discharge type, normalized to each participant. (C) Frequency of epileptiform discharges across groups. Each bar represents 1 participant with at least 1 epileptiform discharge on 24-hour EEG. Bars are in order of increasing frequency of epileptiform discharges within each group. (D) Schematic representation of epileptiform discharge location. Color bar represents the percentage of participants with epileptiform discharges with a specific localization. Numbers add up to >100% in AD-NoEp and AD-Ep because some participants had epileptiform discharges in >1 location. (E) Distribution of epileptiform discharges by sleep stage, normalized to each participant. AD = Alzheimer disease; AD-Ep = AD with epilepsy; AD-NoEp = AD with no epilepsy; HC = healthy controls.
Figure 3
Figure 3. Characterization of TIRDA as a scalp biomarker of mesial temporal lobe hyperexcitability in AD
(A) Representative examples of definite TIRDA. Top: Left TIRDA in HC1. Middle: Left TIRDA in AD-NoEp8. Bottom: Right TIRDA in AD-Ep2. EEG channels (top to bottom): L Temp (Fp1–F7, F7–T3, T3–T5, T5–O1) and R Temp (Fp2–F8, F8–T4, T4–T6, T6–O2). Calibration bars: 100 µV, 1 second. (B) Averaged distribution of TIRDA type normalized to each participant. (C) Frequency of TIRDA occurrence across groups. Each bar represents 1 participant with at least 1 example of TIRDA on 24-hour EEG. Bars are in order of increasing TIRDA occurrence within each group. (D) Schematic representation of TIRDA lateralization. Color bar represents the percentage of participants with TIRDA with a given lateralization. Numbers add up to >100% in AD-Ep because 3 participants had bitemporal TIRDA. (E) Distribution of TIRDA by sleep stage, normalized to each participant. AD = Alzheimer disease; AD-Ep = AD with epilepsy; AD-NoEp = AD with no epilepsy; HC = healthy controls; Temp = temporal; TIRDA = temporal intermittent rhythmic delta activity.
Figure 4
Figure 4. Frequent SSS-like waveforms are a potential epileptiform abnormality in AD
(A) Number of SSS-like waveforms per 24 hours for all participants with at least 1 example. Each bar represents 1 participant. Bars are organized by increasing number of SSS-like waveforms within each group. Gray bars indicate participants with either ≤5 SSS-like waveforms or >5 SSS-like waveforms with bilateral representation over a 24-hour EEG. Blue bar indicates >5 SSS-like waveforms with >90% left temporal. Red bar indicates >5 SSS-like waveforms with >90% right temporal. Purple bar indicates frequent independent bitemporal SSS-like waveforms. (B) Representative examples of SSS-like waveforms. Top: Left temporal example from AD-NoEp5. Bottom: Right temporal example from AD-NoEp10. EEG channels (top to bottom): LT (Fp1–F7, F7–T3, T3–T5, T5–O1) and RT (Fp2–F8, F8–T3, T3–T5, T5–O1). Calibration bars: 50 µV, 500 milliseconds. AD = Alzheimer disease; AD-Ep = probable AD with epilepsy related to AD; AD-NoEp = probable AD with no history/risk factors for epilepsy; HC = healthy controls; LT = left temporal; RT = right temporal; SSS = small sharp spike.

Comment in

References

    1. Palop JJ, Mucke L. Network abnormalities and interneuron dysfunction in Alzheimer disease. Nat Rev Neurosci 2016;17:777–792. - PMC - PubMed
    1. Noebels J. A perfect storm: converging paths of epilepsy and Alzheimer's dementia intersect in the hippocampal formation. Epilepsia 2011;52:39–46. - PMC - PubMed
    1. Vossel KA, Beagle AJ, Rabinovici GD, et al. . Seizures and epileptiform activity in the early stages of Alzheimer disease. JAMA Neurol 2013;70:1158–1166. - PMC - PubMed
    1. Busche MA, Konnerth A. Neuronal hyperactivity: a key defect in Alzheimer's disease? Bioessays 2015;37:624–632. - PubMed
    1. Busche MA, Konnerth A. Impairments of neural circuit function in Alzheimer's disease. Philos Trans R Soc B Biol Sci 2016;371:20150429. - PMC - PubMed

Publication types