. 2020 Sep;31(9):2044-2064.
doi: 10.1681/ASN.2019080829. Epub 2020 Aug 6.

Apolipoprotein L1-Specific Antibodies Detect Endogenous APOL1 inside the Endoplasmic Reticulum and on the Plasma Membrane of Podocytes

Affiliations

Apolipoprotein L1-Specific Antibodies Detect Endogenous APOL1 inside the Endoplasmic Reticulum and on the Plasma Membrane of Podocytes

Suzie J Scales et al. J Am Soc Nephrol. 2020 Sep.

Abstract

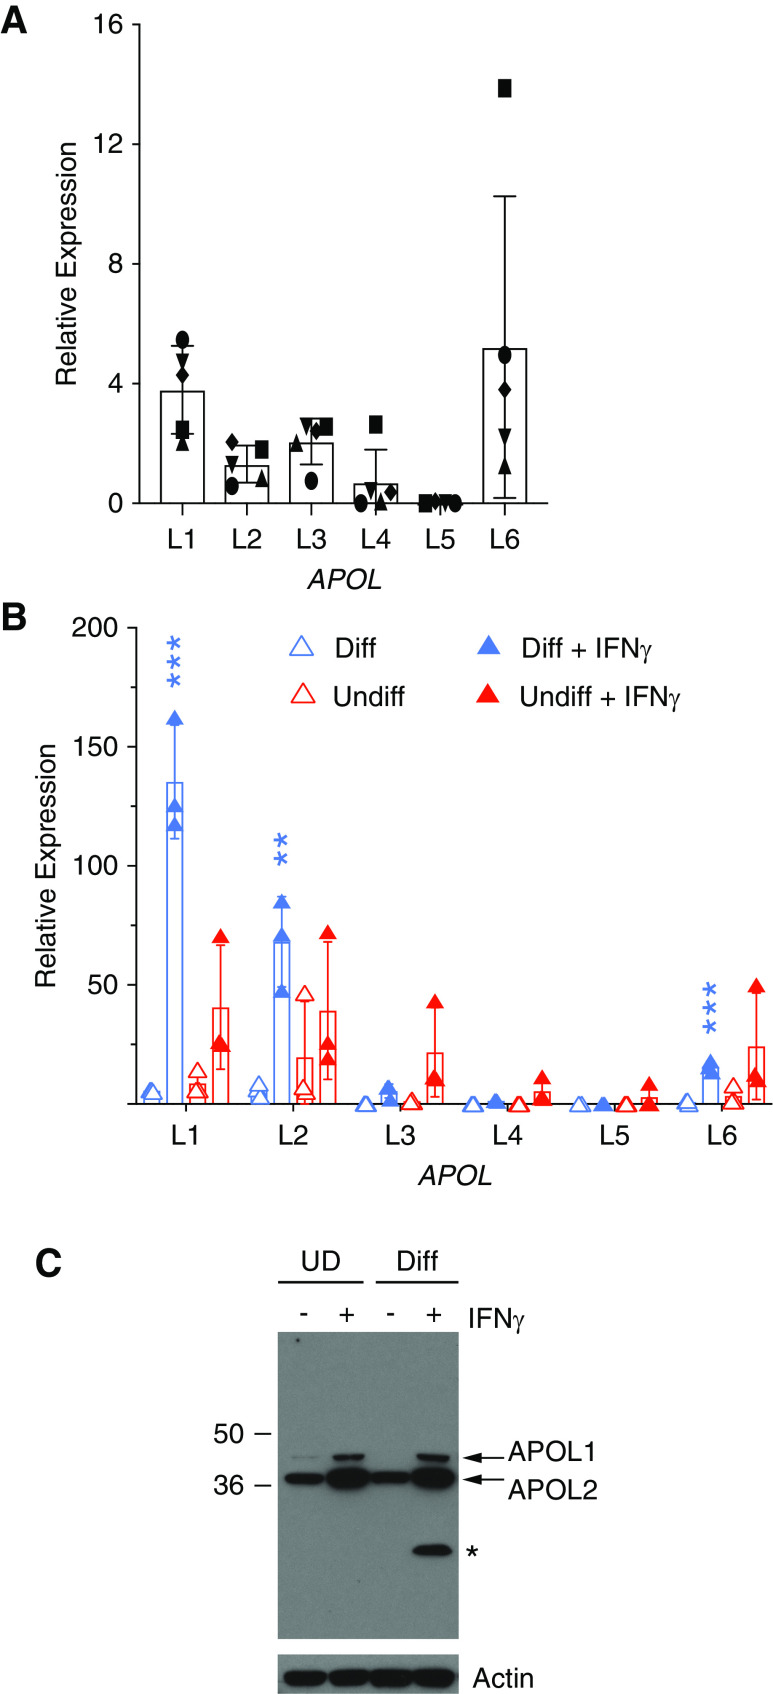
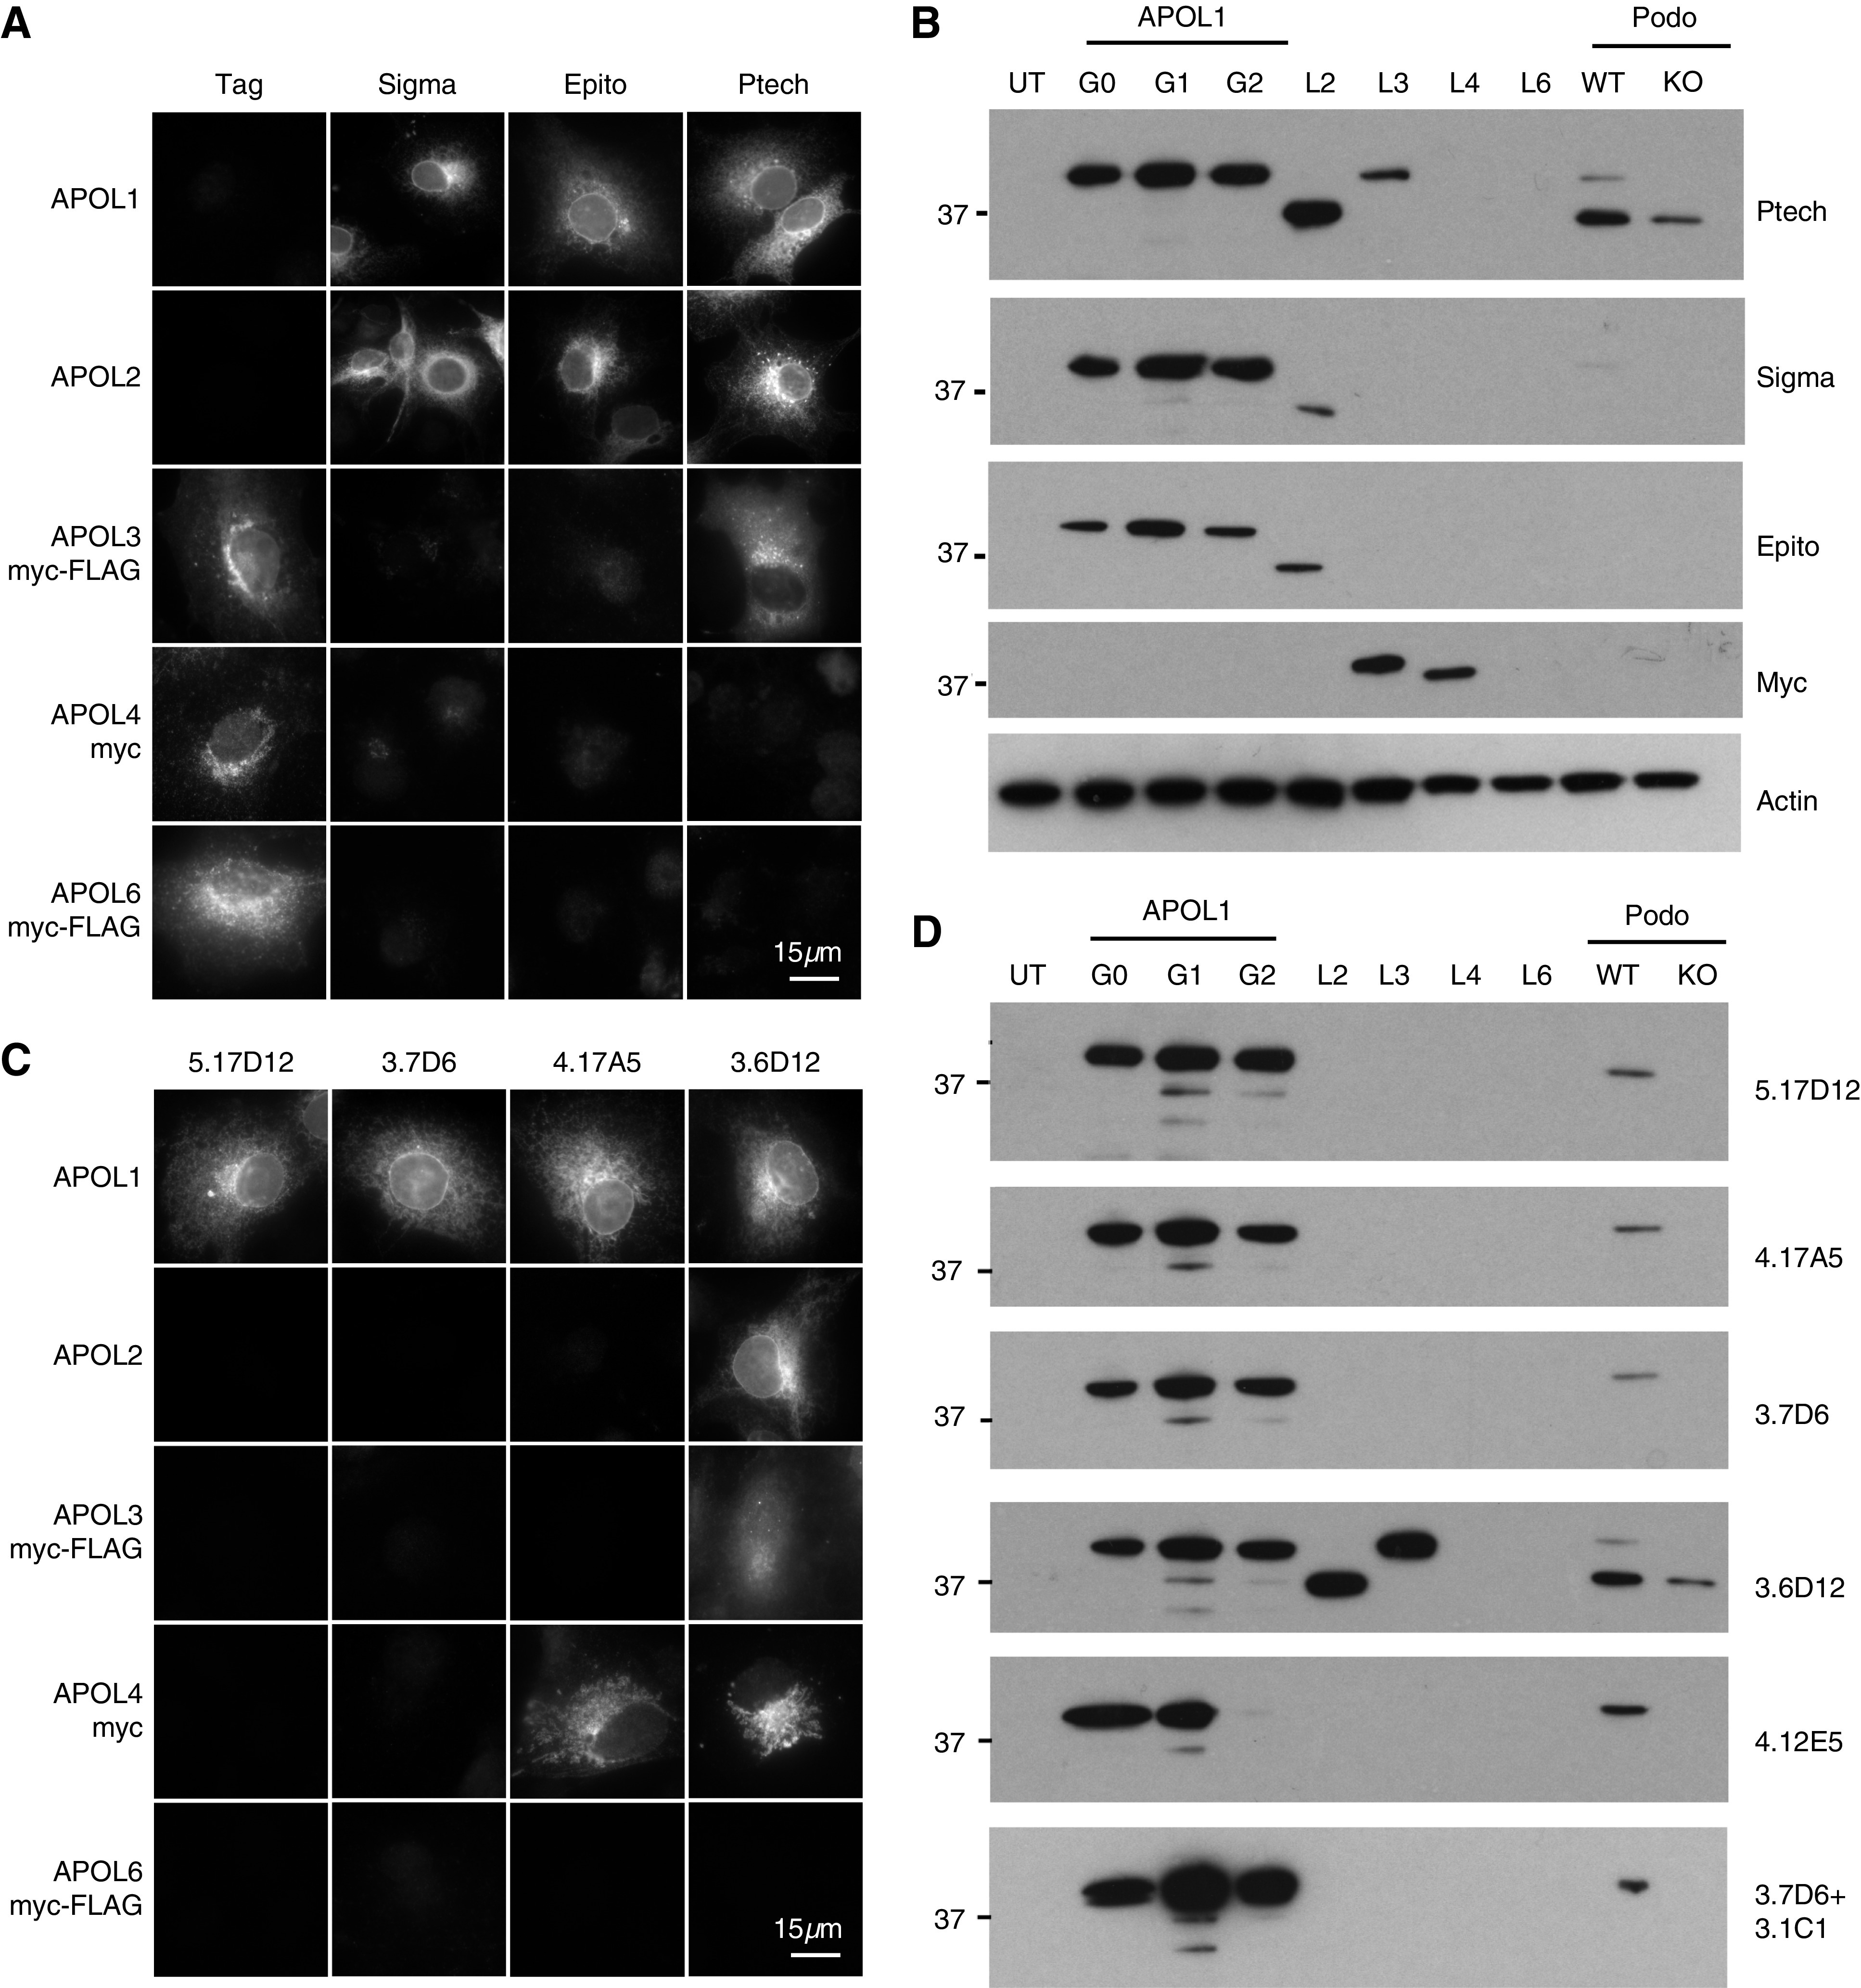
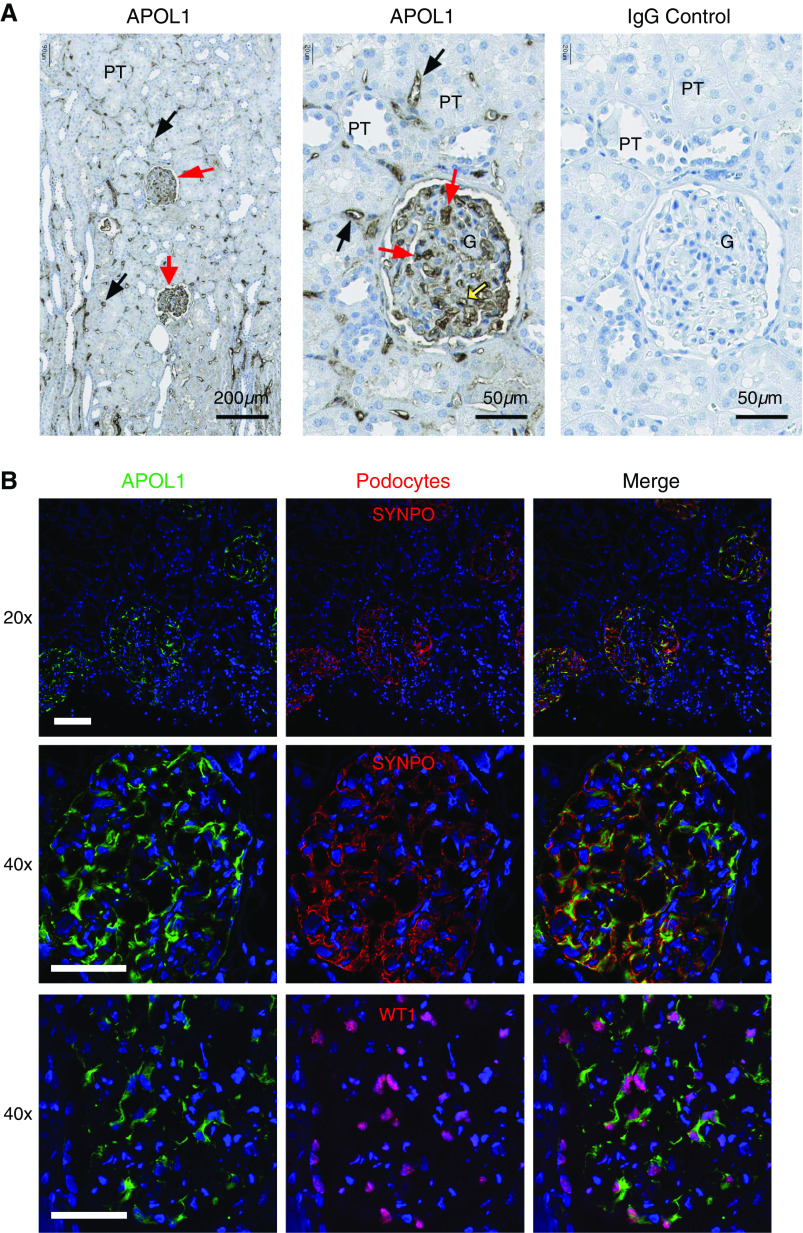
Background: APOL1 is found in human kidney podocytes and endothelia. Variants G1 and G2 of the APOL1 gene account for the high frequency of nondiabetic CKD among African Americans. Proposed mechanisms of kidney podocyte cytotoxicity resulting from APOL1 variant overexpression implicate different subcellular compartments. It is unclear where endogenous podocyte APOL1 resides, because previous immunolocalization studies utilized overexpressed protein or commercially available antibodies that crossreact with APOL2. This study describes and distinguishes the locations of both APOLs.

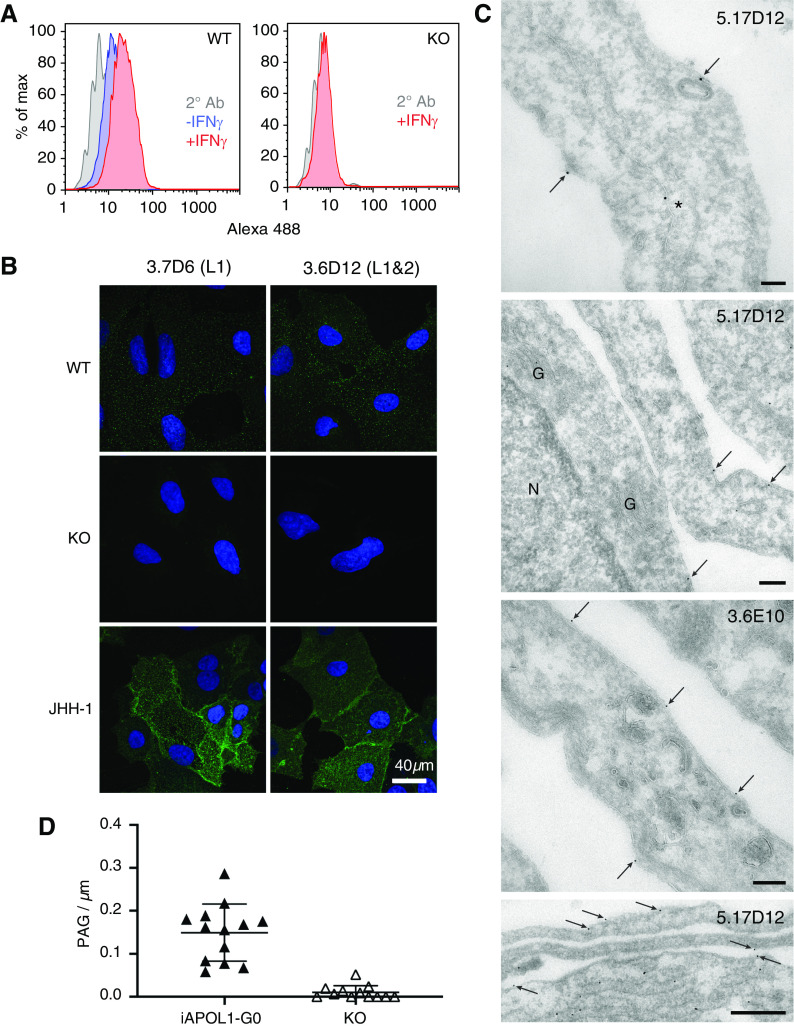
Methods: Immunohistochemistry, confocal and immunoelectron microscopy, and podocyte fractionation localized endogenous and transfected APOL1 using a large panel of novel APOL1-specific mouse and rabbit monoclonal antibodies.

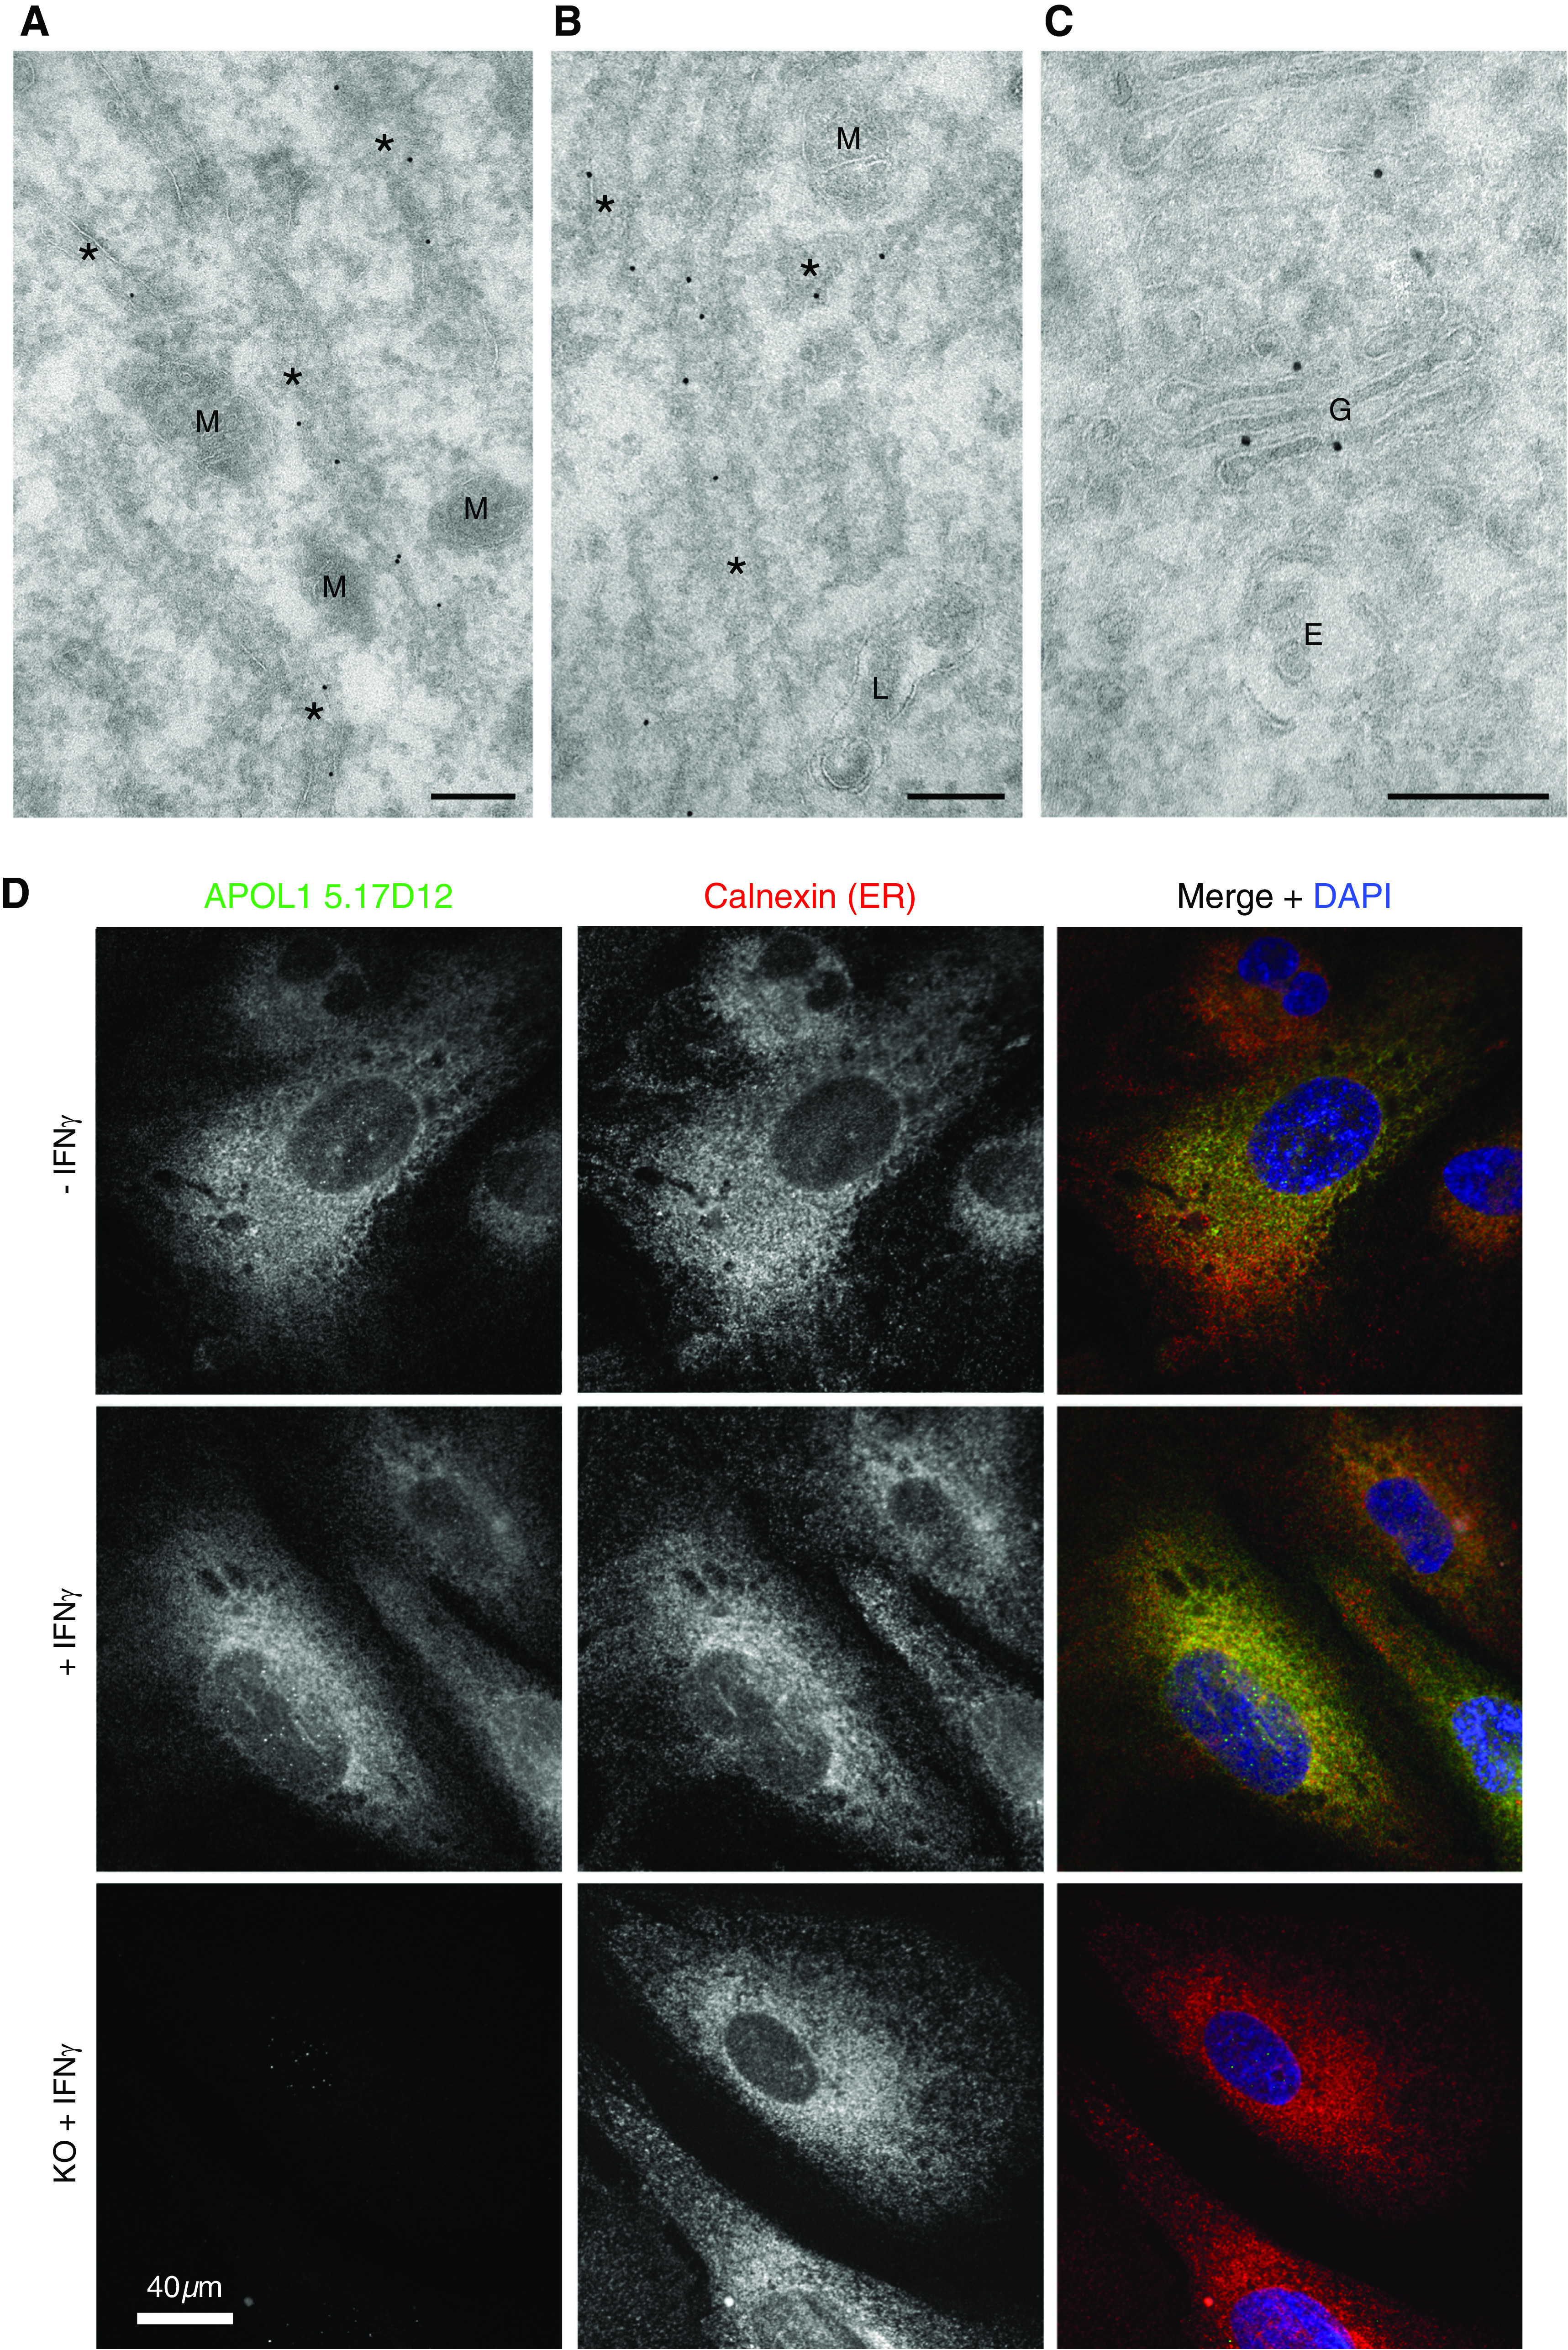
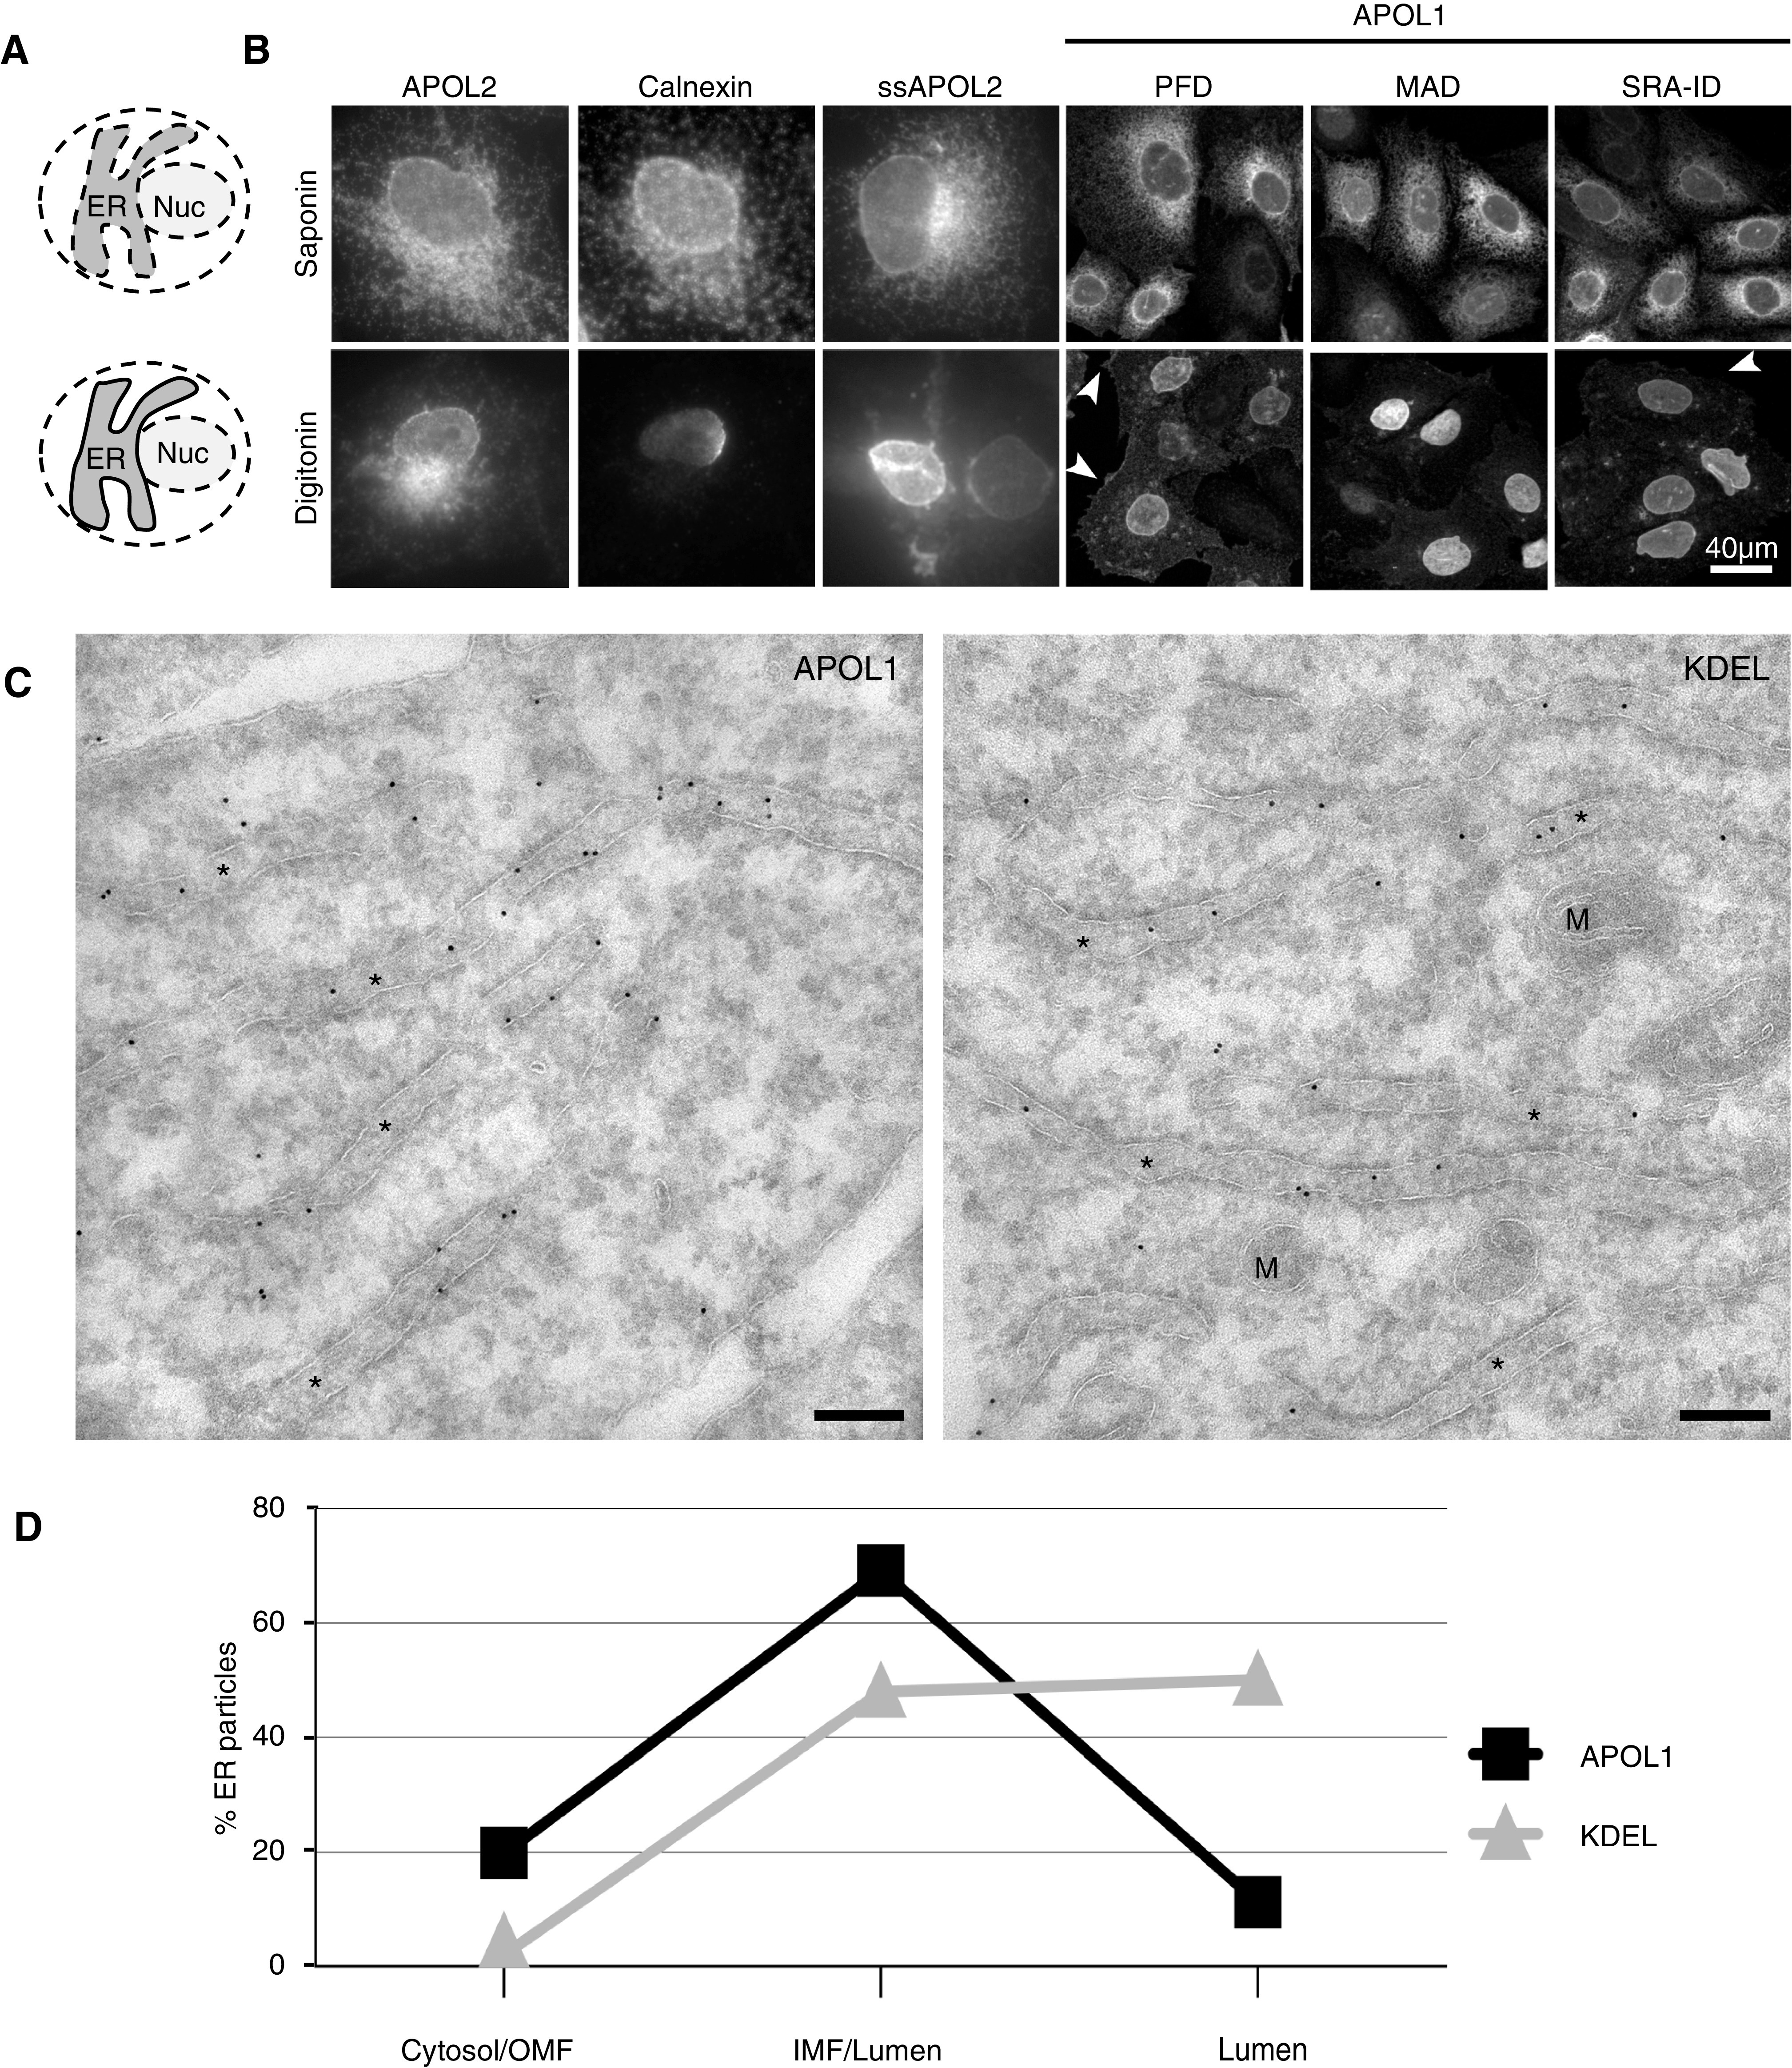
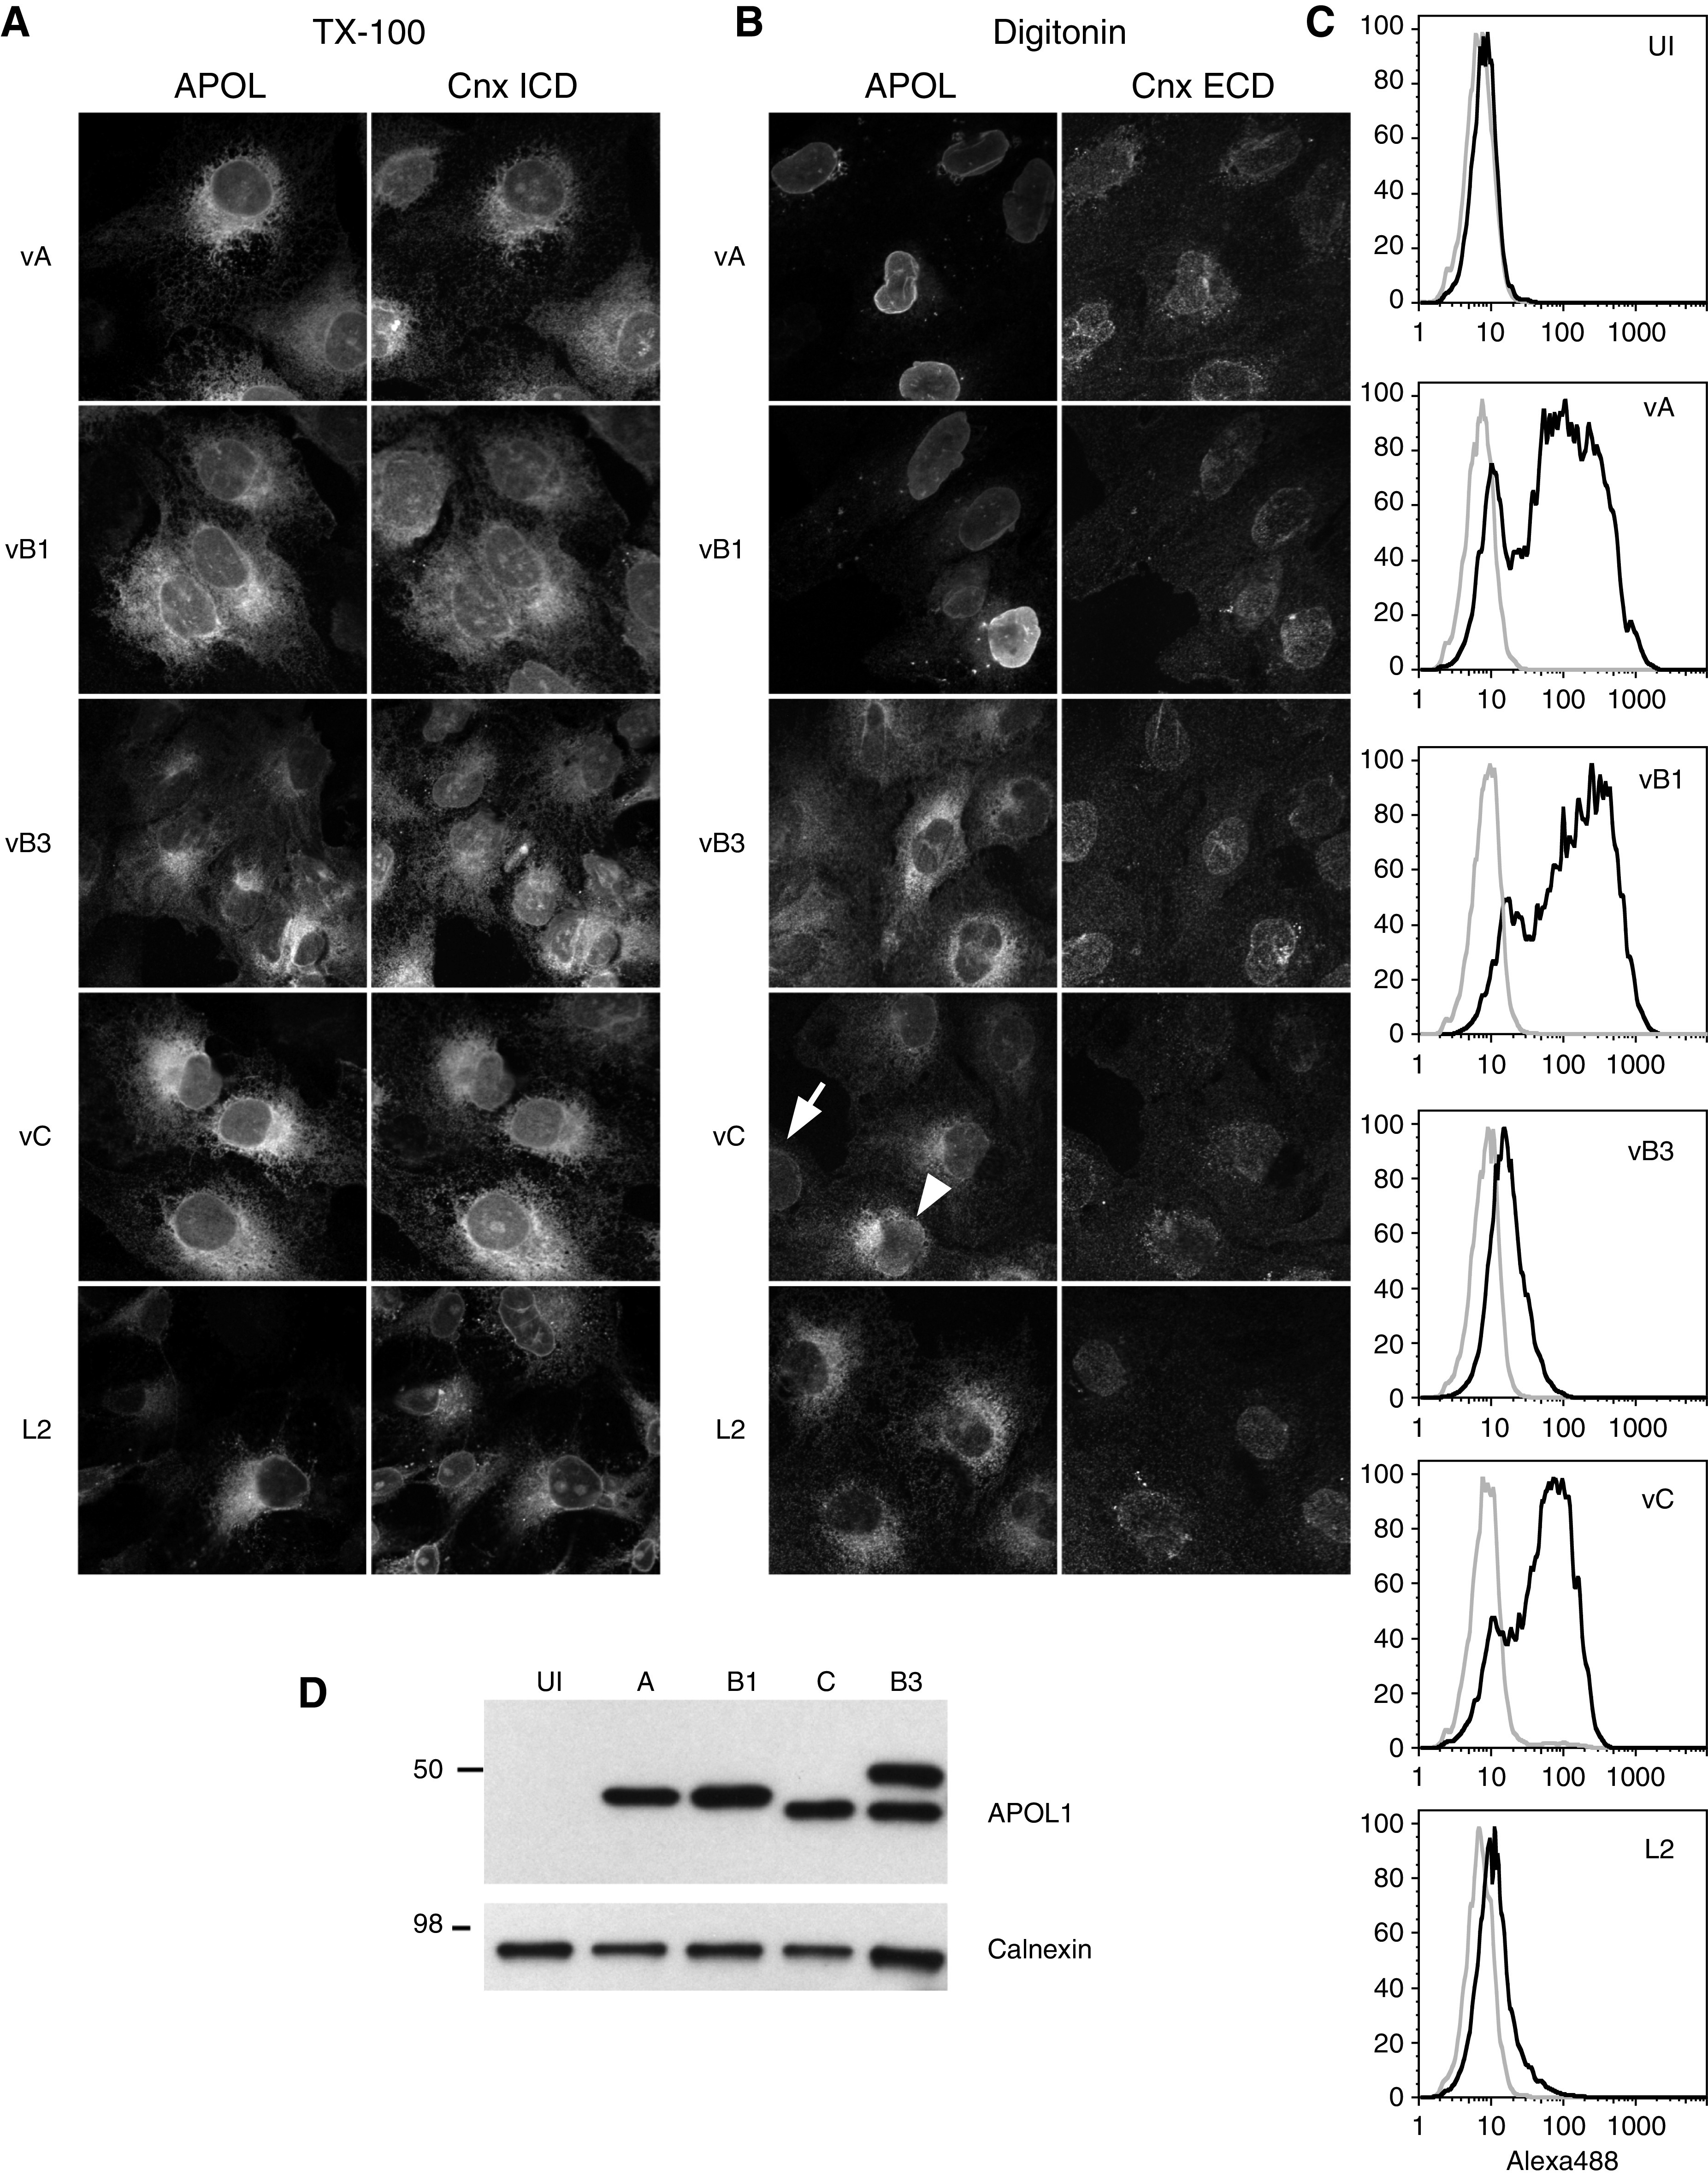
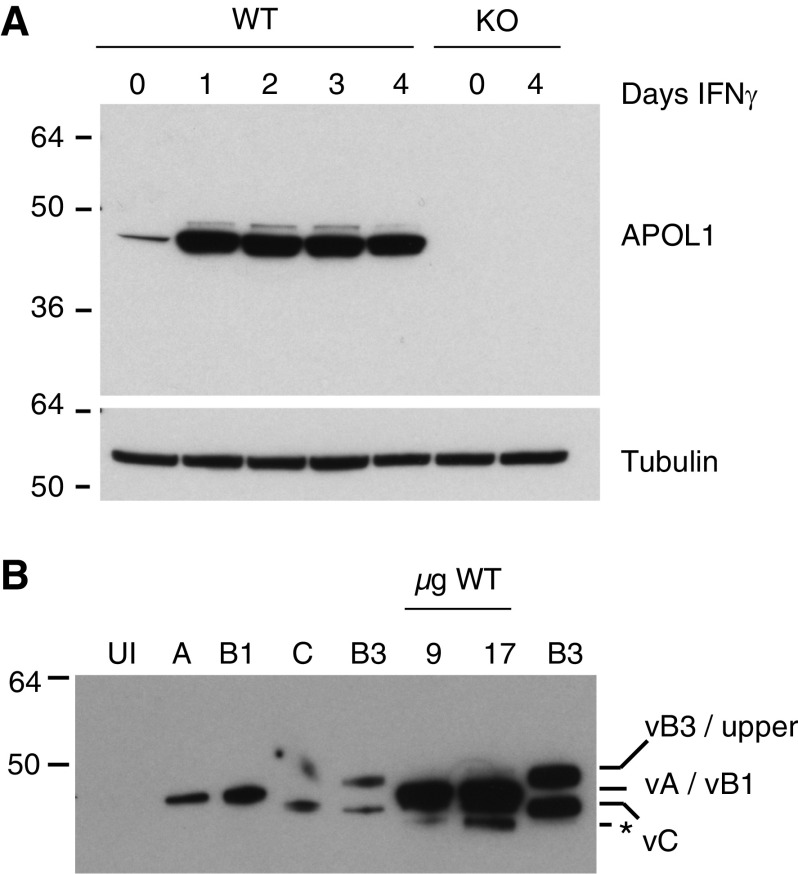
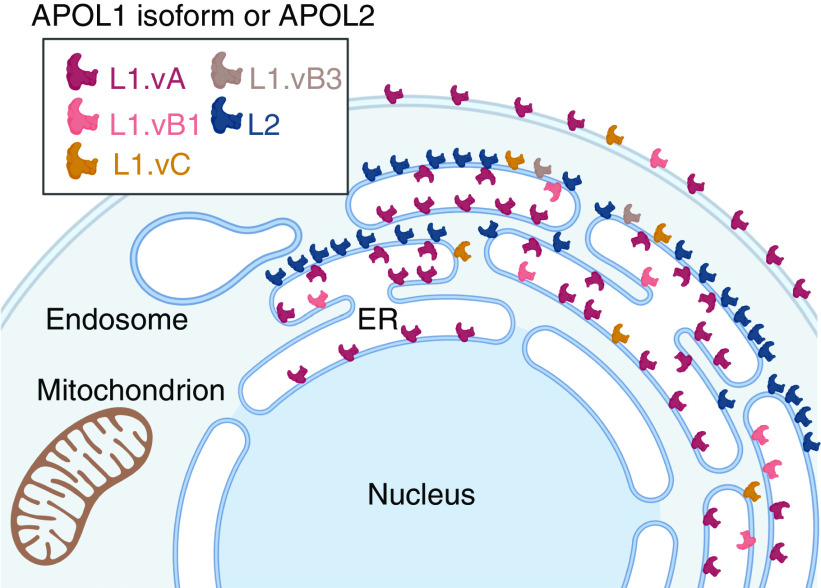
Results: Both endogenous podocyte and transfected APOL1 isoforms vA and vB1 (and a little of isoform vC) localize to the luminal face of the endoplasmic reticulum (ER) and to the cell surface, but not to mitochondria, endosomes, or lipid droplets. In contrast, APOL2, isoform vB3, and most vC of APOL1 localize to the cytoplasmic face of the ER and are consequently absent from the cell surface. APOL1 knockout podocytes do not stain for APOL1, attesting to the APOL1-specificity of the antibodies. Stable re-transfection of knockout podocytes with inducible APOL1-G0, -G1, and -G2 showed no differences in localization among variants.

Conclusions: APOL1 is found in the ER and plasma membrane, consistent with either the ER stress or surface cation channel models of APOL1-mediated cytotoxicity. The surface localization of APOL1 variants potentially opens new therapeutic targeting avenues.

Keywords: Apolipoprotein L1; Apolipoprotein L2; chronic kidney disease; immunofluorescence; immunohistochemistry; podocyte.


Figures

Figure 1.
Figure 1.
APOLs 1, 2, and 6 are expressed in kidney podocytes. (A) RT-PCR of five normal human kidneys with probes specific for each APOL family member. Data are normalized to RPL19 and the mean and SD of the five kidneys are plotted over the individual data points (each kidney is assigned a unique symbol and the mean of the relative expression [2−dCT] of up to three independent RT-PCRs is plotted for each sample). See Supplemental Figure 1A for APOL probe specificities. (B) RT-PCR of immortalized differentiated (Diff, blue, grown at 38°C) or undifferentiated (Undiff, red, grown at 33°C) human podocytes (mean±SD of three separate passages, each analyzed in duplicate) using the same probes as in (A). The variability is likely attributable to our observation that APOL1 levels decline during passaging. Open triangles, untreated; closed triangles, IFNγ treated (100 ng/ml for 24 hours). APOL3 became detectable after IFNγ treatment in undifferentiated, but not differentiated, podocytes. Asterisks indicate APOLs whose expression was significantly elevated by IFNγ treatment according to the two-tailed unpaired t test (**P<0.01; ***P<0.001). (C) Representative western blot on a 4%–12% Bis-Tris gel of immortalized undifferentiated (UD) and differentiated (Diff) podocytes ± IFNγ stimulation using the Proteintech polyclonal that recognizes APOL2 as well as APOL1 (see Figure 2B). The asterisk denotes a nonspecific band not seen with other anti-APOL1 antibodies. Actin served as the loading control.
Figure 2.
Figure 2.
Several anti-APOL1 antibodies crossreact with APOL2. (A) APOL-family reactivity of commercial anti-APOL1 antibodies by IF. COS cells were transfected with untagged APOL1-G0, APOL2, APOL3a-myc-FLAG, APOL4-myc, or APOL6-myc-FLAG (see Supplemental Table 1A for cDNAs). After 40–48 hours, cells were PFA fixed, Triton X-100 permeabilized, and stained with the indicated commercial rabbit anti-APOL1 antibodies (at 1 µg/ml; Ptech, Proteintech; Epito, Epitomics) followed by Alexa488 anti-rabbit. Transfection of APOLs 3–6 was confirmed by staining for the epitope tag (with mouse anti-FLAG-M2 or mouse anti-myc 9E10 for APOL4-myc, followed by Alexa647 anti-mouse), and any positive signals colocalized with the tag as expected (Supplemental Figure 2B). All results were verified in at least one independent experiment. (B) Western blots of APOL-transfected COS cells or endogenous APOL1 in podocytes after 24-hour IFNγ stimulation with commercial anti-APOL1 antibodies corroborate the IF data. Lysates were run on 4%–12% Bis-Tris gels. UT, untransfected COS; G0, G1 (I384M, S342G), and G2 (ΔN388,Y389) are the three APOL1 variants; L2, APOL2; L3, APOL3a-myc-FLAG; L4, APOL4-myc; L6, untagged APOL6; WT, wild-type podocytes; KO, APOL1 CRISPR KO podocytes. Anti-myc labeling confirmed expression of myc-tagged APOLs 3 and 4 and actin served as the loading control. (C) As in (A), except with in-house mouse anti-APOL1 monoclonals at 1 µg/ml. Secondary antibodies were Alexa488 anti-rabbit for 5.17D12 and Alexa488 anti-mouse for the others. 5.17D12 and 3.7D6 are APOL1-specific, and although mAb 4.17A5 crossreacted weakly with APOL4, it could be considered APOL1-specific for the purposes of kidney staining due to lack of APOL4 expression in this tissue (Figure 1). By contrast, the 3.6D12 mAb crossreacts with APOLs 2, 3, and 4 by IF. (D) The same lysates as in (B) were probed with the top in-house mouse monoclonals at 2 µg/ml, or a mixture of rabbit 3.7D6 and 3.1C1 at 0.05 µg/ml (bottom blot), which covers both ends of APOL1 and is our preferred reagent for western blotting. 3.1C1 maps to the linker domain, whereas the rest map to the N-terminal pore-forming domain, except for 4.12E5, which recognizes the C-terminal APOL1-G2 epitope (it barely recognizes APOL1-G2 by western blotting and does not crossreact with APOL2–6 [confirmed by IF; Supplemental Figure 2B]). The results corroborate the IF crossreactivities, except for APOL4 crossreactivity, which appears to be conformationally sensitive. The 3.6D12 antibody continues to recognize APOL2 in the APOL1 KO podocytes (generated in Gupta et al.). Note that the 4.17A5 western is shown at a longer exposure than the others.
Figure 3.
Figure 3.
Endogenous APOL1 is found in normal kidney podocytes and endothelial cells by immunohistochemistry. (A) Left panel, immunohistochemistry of FFPE normal human kidney stained with 0.5 µg/ml APOL1-specific rabmab 5.17D12 at 5× (200-µm scale bar), showing two positive (brown-stained) glomeruli (red arrows), multiple positive extraglomerular endothelia (black arrows), and numerous APOL1-negative proximal tubules (PT). Center, ×20 magnification (scale bar, 50 µm) of the APOL1-stained upper glomerulus from the left image. Red arrows point to APOL1 signal in podocytes; yellow and black arrows highlight APOL1 on the luminal surface of glomerular endothelial cells and extraglomerular endothelial cells (capillaries), respectively. The signal is primarily membrane and cytoplasmic staining. The different cell types were identified morphologically by a kidney pathologist (see Methods). This staining pattern was replicated by two other top anti-APOL1 antibodies to different epitopes and is representative of at least five kidneys examined (data not shown). Unlike a previous report, the staining was not predominantly in proximal tubules. G, glomerulus; PT, proximal tubule. Right, rabbit IgG isotype control on an adjacent section of the same glomerulus, also at ×20, showing no signal. (B) Dual IF confirms that APOL1 is strongly expressed in human kidney podocytes. A frozen normal human kidney was costained with 1 µg/ml murine 4.17A5 anti-APOL1 (green, left) and rabbit anti-podocyte markers (center, red): synaptopodin (SYNPO, at ×20 [top] and ×40 [middle row]) or nuclear WT1 (lower row, at ×40), all overlaid with DAPI (blue). The merged images on the right confirm that most APOL1 is found in synaptopodin- and WT1-positive podocytes and is predominantly intracellular (Figure 4 suggests that it is likely ER). Scale bars in all panels, 50 µm.
Figure 4.
Figure 4.
Endogenous and stably transfected APOL1 localizes to the ER of cultured podocytes. (A–C) iEM of iAPOL1-G0 podocytes. APOL1 KO podocytes re-expressing iAPOL1-G0 (after 5 ng/ml doxycycline induction for 48 hours) were 4% PFA fixed and immunolabeled with 25 µg/ml rabmab 5.17D12, followed by protein-A gold. Staining of APOL1 in the ER (A and B) and Golgi (C) is shown. All scale bars, 200 nm. *, ER lumen; M, mitochondrion; L, lysosome; E, early endosome; G, Golgi. APOL1 is seen in the ER and, to a lesser extent, the Golgi ([C], note that the image shown has above-average gold particles to illustrate that APOL1 is seen in this compartment), but not in mitochondria or the endolysosomal system. Examples of APOL1 staining in the more perinuclear region of the ER and its absence from the mitochondria and MAM are shown in Supplemental Figure 10, along with uninduced controls showing that the antibody staining is APOL1-specific. (D) Endogenous APOL1 in wild-type differentiated podocytes (upper row) is shown in PFA-fixed, saponin-permeabilized cells costained with 2 µg/ml APOL1 5.17D12 (green) and mouse anti-calnexin (red); merge with nuclear DAPI is on the right. IFNγ-treated (24 hours) WT podocytes (middle) show stronger ER labeling of APOL1, whereas APOL1 KO (lower) podocytes lacked this. Note that nuclear speckles (overlapping DAPI) are evident in many cells, which are clearly nonspecific (not APOL1) because they are found in KO as well as WT cells. Scale bar, 40 µm. APOL1 was similarly ER-localized with eight other antibodies in both differentiated and undifferentiated podocytes (see Supplemental Figure 12 for 4.17A5, and other data not shown).
Figure 5.
Figure 5.
A small proportion of endogenous podocyte APOL1, but not APOL2, is at the plasma membrane. (A) Live WT (left) or APOL1 KO (right) podocytes were incubated on ice for 1 hour (without fixation or permeabilization) with 2.5 µg/ml 3.6D12 (an APOL2-crossreactive mAb). Gray, Alexa488 anti-mouse secondary antibody alone; blue, untreated; red, 24-hour IFNγ-treated podocytes. There is a shift on WT, but not KO cells (which express APOL2 but not APOL1). The lack of signal on APOL1 KO cells indicates that APOL2 is not on the cell surface, despite being more abundant than APOL1 (Figure 1C, Supplemental Figure 17A). Thus, the shift seen with 3.6D12 in WT cells must represent APOL1, and increases with IFNγ, as expected. Evidence that 3.6D12 has the ability to recognize unfixed APOL2 on cells is shown in Supplemental Figure 21A. (B) Live IFNγ-treated WT podocytes (upper), APOL1 KO podocytes (middle), and liver JHH-1 cells (lower) were incubated with 5 µg/ml APOL1-specific 3.7D6 (left) or APOL2-crossreactive 3.6D12 (right) on ice for 1 hour, then washed, PFA fixed, and detected (without permeabilization so as to avoid seeing the abundant intracellular ER signal) with Alexa488 anti-mouse (green; overlaid with nuclear DAPI in blue). Punctate signal is seen on the cell surface of WT podocytes and JHH-1 (but not APOL1 KO podocytes) with both APOL1-specific and APOL2-crossreactive antibodies, indicating that only APOL1 (not APOL2) is on the cell surface. Scale bar, 40 µm. Similar results on podocytes were seen with ≥8 other antibodies to different epitopes (data not shown). (C) iEM of APOL1-G0 podocytes, using the APOL1-specific antibodies 5.17D12 and 3.6E10, showing the dispersed distribution of APOL1 immunogold particles (arrows) at the cell surface. Note that the gold density on the plasma membranes visible in these images is 2–5 times above average in order to illustrate more than one particle per image. *, ER lumen; G, Golgi; N, nucleus. Scale bars (top to bottom), 100, 200, 200, and 500 nm. (D) Quantification of 5.17D12 anti-APOL1 immunogold particle density (protein A gold [PAG] particle number/µm membrane length) at the plasma membrane of iAPOL1-G0 podocytes (n=13 cells, totaling 945.8 µm plasma membrane analyzed, black triangles) is substantially (14.4-fold) above the background level in APOL1 KO cells (n=12 cells, totaling 1148.7 µm analyzed, open triangles). Means and SDs are overlaid on the results for the individual cells. Examples of negative-control KO podocyte staining are shown in Supplemental Figure 10, E and F.
Figure 6.
Figure 6.
APOL1 is associated with the inner face of the ER membrane. (A) Schematic of PFA-fixed cells permeabilized with 0.4% saponin for 20 minutes (or 0.1% Triton X-100 for 4 minutes; upper), with cell-surface and ER membranes permeabilized (dashed lines) versus cell-surface–specific permeabilization by 0.0025% digitonin for 4 minutes (ER membrane is intact, solid line; lower). Note that PFA fixation permeabilizes the nuclear envelope of some cells (Nuc, gray) irrespective of any detergent. (B) COS cells transiently transfected with APOL2, or APOL2 with the signal sequence of APOL1 at its N terminus (ssAPOL2), or doxycycline-induced (5 µg/ml for 20 hours) iAPOL1-CHO stables were PFA fixed then permeabilized with saponin (top) or digitonin (bottom). The APOL2 proteins in COS cells are shown stained with 3.6D12 (a mAb to the N-terminal pore-forming domain [PFD]), and similar results were obtained with the other 43 APOL2-crossreactors (all to the PFD, data not shown). Anti-calnexin luminal domain staining for the APOL2-COS (monkey) cells is shown to the right of APOL2 as a control for permeabilization conditions (this antibody does not crossreact with CHO [hamster] calnexin). APOL1, in iAPOL1-CHO cells, is shown stained with APOL1-specific PFD mAb 3.7D6, membrane-addressing domain (MAD) mAb 3.3A8, or SRA-interacting domain (SRA-ID) mAb 3.1C1, each detected with Alexa488 anti-mouse (see Gupta et al. for epitope mapping), and similar results were obtained with all of the other APOL1-specific antibodies to all three domains (data not shown). The reticular ER pattern persists in digitonin (plasma membrane only)-permeabilized cells for APOL2, but not APOL1 or ssAPOL2, indicating that APOL2 is on the cytoplasmic face of the ER, whereas APOL1 and ssAPOL2 are inside, and thus not on both faces at once. The nuclear membrane signal for APOL1 with digitonin is also seen without detergent in some cells because PFA semipermeabilizes the nuclear membrane (data not shown). With digitonin, some of the more sensitive antibodies, including the PFD (3.7D6) and SRA-ID (3.1C1) antibodies shown here (but not MAD antibody 3.3A8), additionally detected APOL1 on the plasma membrane (arrowheads), which is topologically equivalent to the ER lumen. (C) Immunoelectron micrographs of iAPOL1-G0 podocytes (induced for 24 hours with 5 ng/ml doxycycline) immunolabeled with 3.6E10 and amplified with rabbit anti-mouse secondary antibody for APOL1 (left) or the soluble luminal marker anti-KDEL (right), directly detected with 10-nm protein A–gold, both showing representative gold distributions in the ER cisternae. *, ER lumen; M, mitochondrion. Scale bars, 200 nm. APOL1 appears more closely associated with the inner ER membrane face than does the luminal KDEL. (D) Quantitation confirms that APOL1 is more associated with the inner face of the ER membrane than KDEL in iAPOL1-G0 podocytes. Quantitation of ER-associated gold particles was done on 55 images of APOL1 immunogold-labeled sections (81 gold particles) and 23 images (100 gold particles) from KDEL-labeled sections. Both labelings were performed without secondary antibody amplification in order to minimize the size of the antibody–Protein A–gold complexes and to render the quantitation more accurate. APOL1 is mainly associated with the inner ER membrane face (IMF), with a small amount attributed to the outer (cytosolic) face (OMF) of the ER membrane or central lumen by virtue of the approximately 25-nm size of the immunogold complex relative to the 7-nm ER membrane thickness (see Supplemental Figure 19A for details). By contrast, the KDEL reference marker for a luminal ER protein appeared equally distributed over the central ER lumen and the 20-nm luminal zone near the surface of the inner ER face, and, as expected, was minimally detected in the 20-nm zone of cytosol flanking the outer ER membrane surface. The few gold particles apparently lying in the cytosol away from any membrane were considered background and not included in the quantitation.
Figure 7.
Figure 7.
APOL1 isoforms localize to opposite sides of the ER membrane in podocyte stables. (A) Stable pools of APOL isoforms were PFA fixed and fully permeabilized with Triton X-100 to reveal total APOL distribution, and APOL1/2 was costained with rabbit anti-calnexin cytoplasmic tail (intracellular domain, Cnx ICD), followed by Alexa488 anti-IgG2a and Dy649 anti-rabbit. All of the APOL1 isoforms and APOL2 appear ER-associated and colocalize well with calnexin under these conditions. (B) As in (A), except with digitonin permeabilization to reveal only cytoplasmic APOLs, and mouse anti-calnexin extracellular (luminal/ECD) domain and isotype-specific secondaries (Alexa488 anti-IgG2a for APOL; Alexa647 anti-IgG1 for calnexin). APOL1.vA, vB1, and a few cells expressing vC exhibit luminal staining (noncytoplasmic, arrow; arrowhead indicates nuclear envelope [luminal] signal in the same cell as reticular [cytoplasmic] signal), whereas vB3, APOL2, and the majority of vC are cytoplasmically oriented because they retain a reticular ER staining pattern with digitonin. Note that the calnexin ECD antibody gives similar nuclear membrane staining to the luminal APOL1 isoforms, validating our digitonin method. (C) Flow cytometry of APOL1-G0 isoforms and APOL2 podocyte stable pools (gated on live [PI-negative] cells i.e., unfixed, unpermeabilized) stained with 1 µg/ml 3.6D12 and Alexa488 anti-mouse after 22 hours of induction at 10 ng/ml doxycycline (except UI, uninduced vA control). APOL1.vA and vB1 give a large FACS shift, indicating that they are secretory, vC gives a smaller shift (partially secretory), and vB3 and APOL2 (L2) give almost no shift (i.e., nonsecretory), in accordance with the topologies identified by digitonin IF in (B). The y axis is % maximum and the x axis is Alexa488 fluorescence intensity; gray lines are secondary antibody alone and black lines are 3.6D12 histograms. Note that even the secretory isoforms (vA and vB1) were not actually secreted into the media due to being anchored to the cell surface, presumably via their predicted transmembrane domains (data not shown). (D) The different APOL1 isoforms are expressed at comparable levels in stable podocytes. A portion of the cells used in (C) were western blotted on a 10% gel with 0.05 µg/ml 3.1C7/3.7D6 (validated in Figure 2D) and calnexin as a loading control. The similar total expression of the different isoforms implies that the greater FACS shifts with vA and vB1 (C) are due to greater secretory transport to the cell surface rather than higher expression. Furthermore, the similar size of APOL1.vA and vB1 suggests cleavage at the same VRA/EE site and thus that the 43-aa signal sequence of vB1 is functional, in contradiction to the signal sequence program predictions (Supplemental Table 1B). APOL1.vB3 is larger than vA, consistent with lack of signal sequence cleavage, which was confirmed by retention of an N-terminal tag (Supplemental Figure 22C), but also has a smaller, potentially cytoplasmically cleaved band. By contrast, vC is smaller than vA, despite predictions that it should be 1-kDa larger because it is mostly nonluminal (Supplemental Table 1B), and thus it may also be cytoplasmically clipped; indeed at high expression levels it appears as a doublet (Supplemental Figure 22B).
Figure 8.
Figure 8.
APOL1 isoform expression in podocytes. (A) Western blot of WT and APOL1 KO podocytes stimulated for 0–4 days with 100 ng/ml IFNγ. Lysates were immunoblotted for APOL1 as in Figure 7D, then reprobed with 1A2 anti-tubulin as a loading control. IFNγ treatment increases the level of APOL1 and a faint upper band also is reproducibly detected on 10% or 12% Tris-Glycine gels (12% here) at the right loading level. Note that there is no band smaller than the major band, suggesting that vC is not detectable. (B) The upper APOL1 band in IFNγ-stimulated podocytes is the same size as vB3. Western blot of APOL1 isoform stable podocyte lysates from Figure 7D loaded adjacent to 9 or 17 µg of WT IFNγ-stimulated podocyte lysate and a larger amount of vB3 in the last lane. The upper band of endogenous APOL1 is similar in size to that of APOL1.vB3, although we cannot rule out the possibility that it is a post-translational modification. From the molecular weight predictions (Supplemental Table 1B) it could not represent any of the other isoforms. The band beneath vA in WT podocytes (*) is probably a degradation product, because it is only sporadically detected (compare [A]).
Figure 9.
Figure 9.
Summary of APOL1 isoform and APOL2 subcellular locations. Diagram of a cell depicting localization and relative abundance of APOL1 isoforms (although note that APOL1 and APOL2 are grossly under-represented compared with the minor variants). APOL1.vA (maroon), vB1 (pink), and a little of vC (tan) are within the ER lumen (associated with the inner membrane) and a small proportion of each is transported to the plasma membrane via the Golgi (not shown), i.e., the classic secretory pathway. By contrast, APOL1.vB3 (gray-brown), APOL2 (blue), and the majority of APOL1.vC (tan) are on the cytoplasmic face of the ER and not on the cell surface. This sketch was created with BioRender.

References

    1. Genovese G, Friedman DJ, Ross MD, Lecordier L, Uzureau P, Freedman BI, et al.: Association of trypanolytic APOL1 variants with kidney disease in African Americans. Science 329: 841–845, 2010. - PMC - PubMed
    1. Tzur S, Rosset S, Shemer R, Yudkovsky G, Selig S, Tarekegn A, et al.: Missense mutations in the APOL1 gene are highly associated with end stage kidney disease risk previously attributed to the MYH9 gene. Hum Genet 128: 345–350, 2010. - PMC - PubMed
    1. Heymann J, Winkler CA, Hoek M, Susztak K, Kopp JB: Therapeutics for APOL1 nephropathies: Putting out the fire in the podocyte. Nephrol Dial Transplant 32[Suppl 1]: i65–i70, 2017 - PMC - PubMed
    1. Kruzel-Davila E, Skorecki K: Dilemmas and challenges in apolipoprotein L1 nephropathy research. Curr Opin Nephrol Hypertens 28: 77–86, 2019. - PubMed
    1. Kopp JB, Heymann J, Winkler CA: APOL1 renal risk variants: Fertile soil for HIV-associated nephropathy. Semin Nephrol 37: 514–519, 2017. - PMC - PubMed

Publication types

LinkOut - more resources