. 2020 Aug 25;117(34):20706-20716.
doi: 10.1073/pnas.1920372117. Epub 2020 Aug 6.

The histone methyltransferase DOT1L prevents antigen-independent differentiation and safeguards epigenetic identity of CD8+ T cells

Affiliations

The histone methyltransferase DOT1L prevents antigen-independent differentiation and safeguards epigenetic identity of CD8+ T cells

Eliza Mari Kwesi-Maliepaard et al. Proc Natl Acad Sci U S A. .

Abstract

Cytotoxic T cell differentiation is guided by epigenome adaptations, but how epigenetic mechanisms control lymphocyte development has not been well defined. Here we show that the histone methyltransferase DOT1L, which marks the nucleosome core on active genes, safeguards normal differentiation of CD8+ T cells. T cell-specific ablation of Dot1L resulted in loss of naïve CD8+ T cells and premature differentiation toward a memory-like state, independent of antigen exposure and in a cell-intrinsic manner. Mechanistically, DOT1L controlled CD8+ T cell differentiation by ensuring normal T cell receptor density and signaling. DOT1L also maintained epigenetic identity, in part by indirectly supporting the repression of developmentally regulated genes. Finally, deletion of Dot1L in T cells resulted in an impaired immune response. Through our study, DOT1L is emerging as a central player in physiology of CD8+ T cells, acting as a barrier to prevent premature differentiation and controlling epigenetic integrity.

Keywords: DOT1L; H3K79me2; T cell; epigenetics; virtual memory.


Conflict of interest statement

The authors declare no competing interest.

Figures
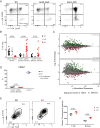
Fig. 1.
Fig. 1.
Ablation of Dot1L results in CD44+CD62L+ memory-like CD8+ T cells. (A) Flow-cytometry analysis of CD8+ T cell subsets in the spleen based on CD44 and CD62L expression in WT and heterozygous and homozygous Dot1L-KO mice. Subsets are indicated in the Top Left. (B) Quantification of CD8+ T cell subsets in the spleen indicated in the representative plots in A. Data from three to five individual experiments with three to four mice per genotype per experiment, shown as mean ± SD. (C) Mean average (MA) plot of RNA-Seq data from FACS-sorted CD44+CD62L+ (TCM) and CD44CD62L+ (TN) CD8+ T cells from four mice per indicated genotype. Naïve and memory signatures were defined based on differentially expressed genes (false discovery rate [FDR] < 0.01) between WT TN and WT TCM cells. (D) Percentage of CD49d+ cells in CD44+CD62L+ CD8+ T cells from unchallenged mice and in CD44+CD62L CD8+ T cells from WT mice challenged with L. monocytogenes for 7 d. Data are from one experiment with four mice per genotype, represented as mean ± SD. (E) Representative flow-cytometry plots of T-bet and Eomes expression in CD8+ T cells from the spleen. (F) Median fluorescence intensity (MFI) of T-bet and Eomes in CD44+CD62L+ CD8+ T cells from the spleen. Data are from one experiment with three mice per genotype, represented as mean ± SD.
Fig. 2.
Fig. 2.
The TAIM phenotype in Dot1L-KO initiates in the thymus and is cell intrinsic. (A) MA plot of RNA-Seq data from sorted CD4CD8+CD3+ thymocytes from three WT and four KO mice. Naïve and memory signature genes were defined as described in Fig. 1C. (B) Representative plot and (C) quantification of T-bet and Eomes expression on CD4CD8+CD3+ thymocytes; data are of three individual experiments with two to four mice per genotype, represented as mean ± SD. (D) Quantification of iNKT (CD1d-PBS57+TCRβ+) cells in total thymus. Data are from one experiment with four mice per genotype, represented as mean ± SD. (E) Absolute number of γδTCR+ cells in spleen; data are of two individual experiments with four mice per genotype, represented as mean ± SD. (F) Outline of the mixed bone-marrow chimeras. (G and H) Representative flow-cytometry plots and quantification of CD44 and CD62L expression on Ly5.1+ and Ly5.2+ CD8+ splenocytes from mixed bone-marrow chimeras 4 mo after irradiation and reconstitution. All recipient mice were Ly5.1+ and transplanted with a mixture of either WT Ly5.1+ and Ly5.2+ Lck-Cre+/−;Dot1Lwt/wt (WT; Left) or WT Ly5.1+ and Ly5.2+ Lck-Cre+/−;Dot1Lfl/fl (KO; Right). Data are from one experiment with six or eight mice per genotype, represented as mean ± SD.
Fig. 3.
Fig. 3.
Dot1L ablation impairs TCR/CD3 expression. (A) Heatmap showing RNA expression of TCR signaling genes, defined by differential expression between WT and Dot1L-KO, in any of the sorted CD4CD8+CD3+ thymocytes (thymus), CD44CD62L+ (naïve) CD8+ T cells, and CD44+CD62L+ (memory) CD8+ T cells; four mice per genotype except for WT thymus where there are three mice. Genes are clustered based on Z-score. Arrows indicate genes involved in the TCR complex and Itk. Z-score is calculated row-wise within genes between samples. (B) Expression of TCRβ, CD3ε, TCRα V2, TCRβ V5, CD8α, and CD8β on CD8+ T cells in spleen from Lck-Cre;Dot1L and Lck-Cre;Dot1L;OT-I mice. (C) Median fluorescence intensity for TCRβ on DP3 and CD8+ SP thymocytes; data are from one experiment with four mice per genotype, represented as mean ± SD. (D) Absolute number of CD4CD8+CD3+ thymocytes in WT and KO mice from Lck-Cre;Dot1L;OT-I background; data are from two individual experiments with three to four mice per genotype, represented as mean ± SD. (E) Representative plot of TCRα V2 and TCRβ V5 expression on CD8+ T cells from spleen.
Fig. 4.
Fig. 4.
DOT1L is required for maintenance of the epigenetic identity of CD8+ T cells. (A) MA plot indicating differentially expressed genes between Dot1L-KO and WT in sorted CD44CD62L+ (naïve) CD8+ T cells and CD44+CD62L+ (memory) CD8+ T cells (Left). Genes significantly up-regulated (red) and down-regulated (black) in Dot1L-KO are indicated. Genes were considered differentially expressed when FDR <0.01. Genes outside the limit of the y axis are indicated with triangles. Right shows H3K79me2 normalized read counts at the transcription start site (TSS) ± 2 kb of these genes. Genes with low H3K79me2 read counts are blue, genes with high H3K79me2 are red. (B) Violin plots of H3K79me2 read counts around 4 kb of the TSS of genes up in KO (KO), down in KO (WT), and nonsignificant (n.s.) between KO and WT. (C) MA plot of gene expression between WT and Dot1L-KO memory CD8+ T cells, with genes differential between activated WT and activated Ezh2-KO CD8+ T cells indicated in orange (derepressed in Ezh2 KO) and blue (down-regulated in Ezh2 KO) (49). Box plot notes effect size in Dot1L-KO vs. WT RNA-Seq data based on the indicated differential gene expression category in Ezh2 KO data. (D) Gene Set Enrichment Analysis (GSEA) of genes up-regulated in Ezh2-KO in Dot1L-KO and WT memory CD8+ cells. (E) H3K4me3, H3K79me2, and H3K27me3 ChIP-Seq data around transcription start sites from genes that are up-regulated in Dot1L-KO (KO Gain) and genes that did not change expression (Expression Matched). Coverage was calculated as reads per genomic content, cutoff at the 0.995th quantile per sample and rescaled to a maximum of 1. (F) Clearance of L. monocytogenes in spleen defined by the number of CFUs per organ. Lines indicate median. Data are from one experiment with four to five mice per genotype. (G) Percentage of E7-specific CD8+ cells in blood after vaccination with HPV-E7. Data are from one experiment with three or four mice per genotype, represented as mean ± SD.

Similar articles

Cited by

References

    1. Borst J., Jacobs H., Brouns G., Composition and function of T-cell receptor and B-cell receptor complexes on precursor lymphocytes. Curr. Opin. Immunol. 8, 181–190 (1996). - PubMed
    1. Hussain T., Quinn K. M., Similar but different: Virtual memory CD8 T cells as a memory-like cell population. Immunol. Cell Biol. 97, 675–684 (2019). - PubMed
    1. Jameson S. C., Lee Y. J., Hogquist K. A., Innate memory T cells. Adv. Immunol. 126, 173–213 (2015). - PMC - PubMed
    1. White J. T., Cross E. W., Kedl R. M., Antigen-inexperienced memory CD8+ T cells: Where they come from and why we need them. Nat. Rev. Immunol. 17, 391–400 (2017). - PMC - PubMed
    1. Henning A. N., Roychoudhuri R., Restifo N. P., Epigenetic control of CD8+ T cell differentiation. Nat. Rev. Immunol. 18, 340–356 (2018). - PMC - PubMed

Publication types

MeSH terms