. 2020 Aug 25;117(34):20803-20813.
doi: 10.1073/pnas.2007837117. Epub 2020 Aug 6.

Inhibition of PIKfyve kinase prevents infection by Zaire ebolavirus and SARS-CoV-2

Affiliations

Inhibition of PIKfyve kinase prevents infection by Zaire ebolavirus and SARS-CoV-2

Yuan-Lin Kang et al. Proc Natl Acad Sci U S A. .

Abstract

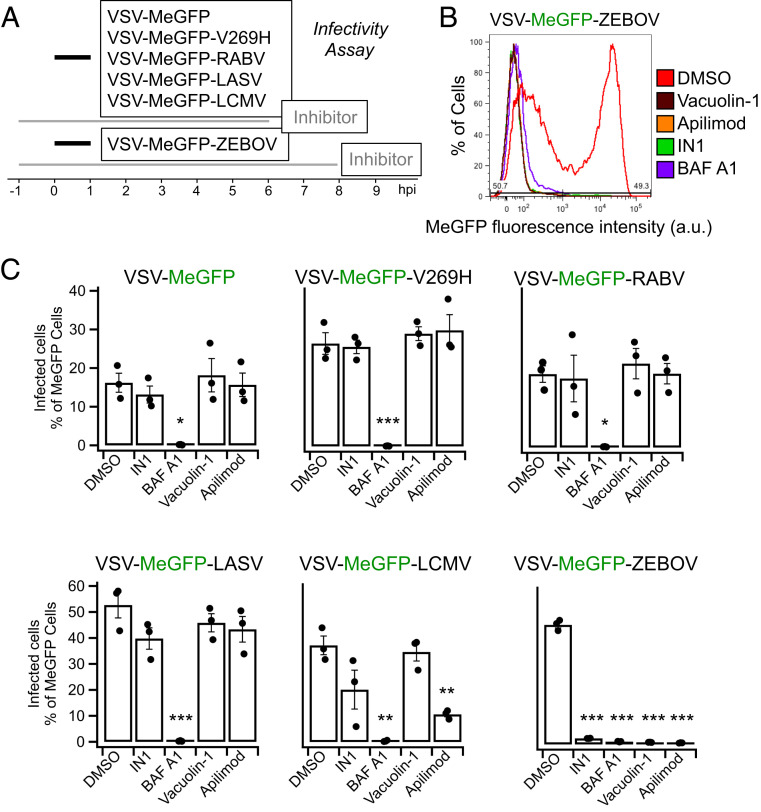
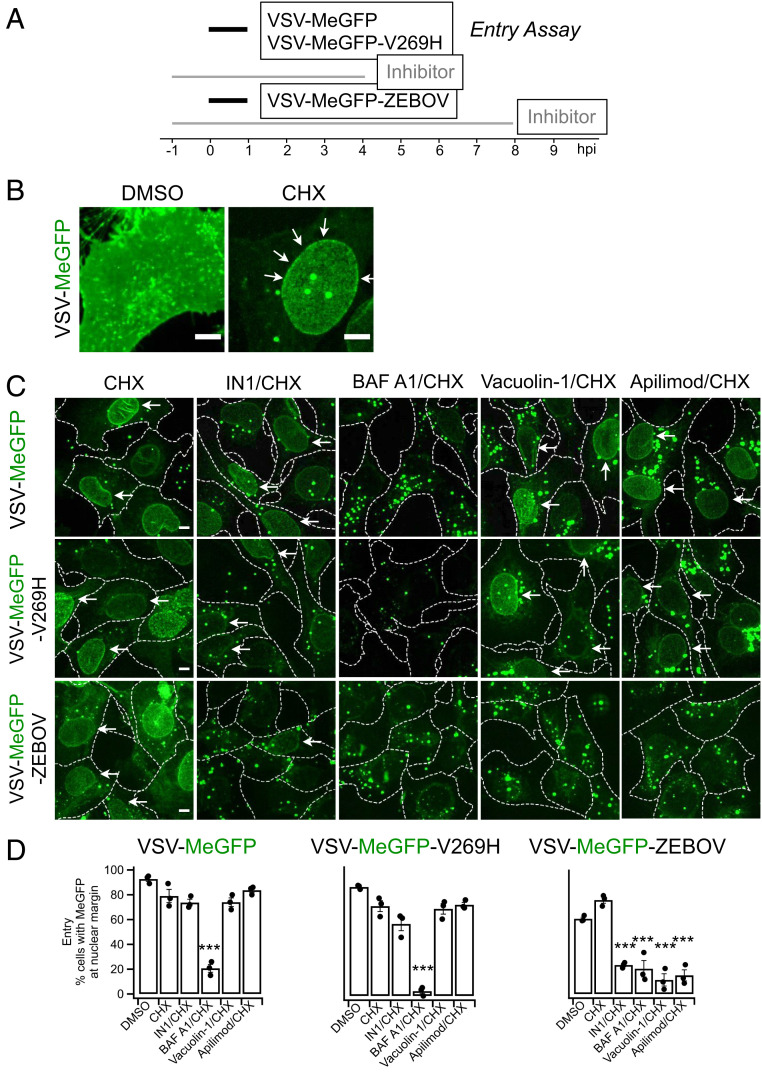
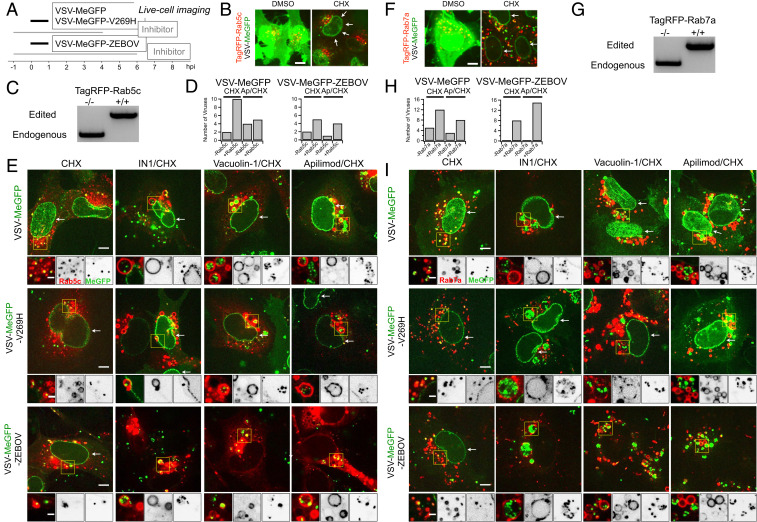
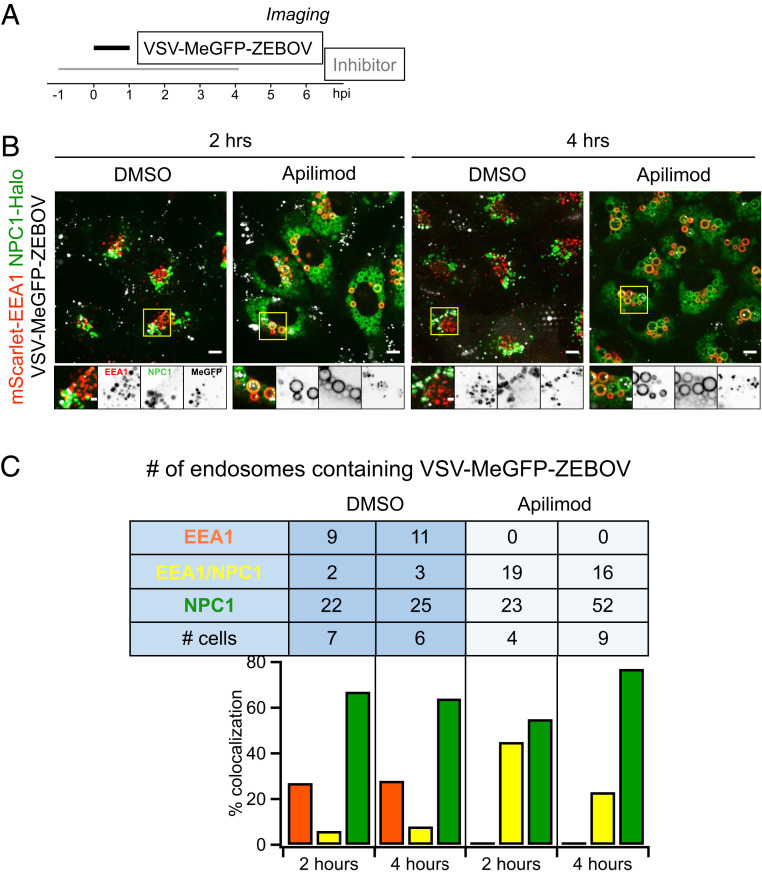
Virus entry is a multistep process. It initiates when the virus attaches to the host cell and ends when the viral contents reach the cytosol. Genetically unrelated viruses can subvert analogous subcellular mechanisms and use similar trafficking pathways for successful entry. Antiviral strategies targeting early steps of infection are therefore appealing, particularly when the probability for successful interference through a common step is highest. We describe here potent inhibitory effects on content release and infection by chimeric vesicular stomatitis virus (VSV) containing the envelope proteins of Zaire ebolavirus (VSV-ZEBOV) or severe acute respiratory syndrome coronavirus 2 (SARS-CoV-2) (VSV-SARS-CoV-2) elicited by Apilimod and Vacuolin-1, small-molecule inhibitors of the main endosomal phosphatidylinositol-3-phosphate/phosphatidylinositol 5-kinase, PIKfyve. We also describe potent inhibition of SARS-CoV-2 strain 2019-nCoV/USA-WA1/2020 by Apilimod. These results define tools for studying the intracellular trafficking of pathogens elicited by inhibition of PIKfyve kinase and suggest the potential for targeting this kinase in developing small-molecule antivirals against SARS-CoV-2.

Keywords: APILIMOD; COVID-19; SARS-CoV-2; Vacuolin-1; ZEBOV.


Conflict of interest statement

Competing interest statement: M.S.D. is a consultant for Inbios, Vir Biotechnology, and NGM Biopharmaceuticals, and is on the Scientific Advisory Board of Moderna. The M.S.D. laboratory at Washington University School of Medicine has received sponsored research agreements from Moderna and Emergent BioSolutions.

Figures

Fig. 1.
Fig. 1.
Apilimod and Vacuolin-1 inhibit VSV-MeGFP-ZEBOV infection. (A) Schematic of infectivity assay, where SVG-A cells were pretreated for 1 h with 5 μM Vacuolin, 5 μM Apilimod, 5 μM IN1, or 10 nM BAF A1 and subsequently infected with VSV-MeGFP (MOI = 2), VSV-MeGFP-V269H (MOI = 1), VSV-MeGFP-RABV (MOI = 0.6), VSV-MeGFP-LASV (MOI = 0.6), VSV-MeGFP-LCMV (MOI = 0.6), or VSV-MeGFP-ZEBOV (MOI = 0.6) for 1 h in the presence of drugs. The cells were then washed to remove unbound virus and incubated for the indicated times in the presence of drugs. The cells were then fixed, and the percentage of cells expressing viral MeGFP was measured by flow cytometry. (B) Representative flow cytometry results of an infection assay using VSV-MeGFP-ZEBOV. (C) Quantification of the infectivity is shown with averages from three independent experiments per condition, each determined as a duplicate measurement (error bars show SEM). The statistical significance was determined using a one-way ANOVA and Tukey post hoc test (*P ≤ 0.05; **P ≤ 0.01; ***P ≤ 0.001).
Fig. 2.
Fig. 2.
Apilimod and Vacuolin-1 inhibit VSV-MeGFP-ZEBOV. (A) Schematic of entry assay where SVG-A cells were infected with VSV-MeGFP (MOI = 4), VSV-MeGFP-V269H (MOI = 4), or VSV-MeGFP-ZEBOV (MOI = 4). Experiments were performed in the presence of 5 µg/mL cycloheximide (CHX) to prevent protein synthesis. Entry assay was based on the appearance of MeGFP fluorescence on the nuclear margin, on a per cell basis, of fixed infected cells visualized by fluorescence microscopy. Staining the fixed cells with Alexa647-labeled wheat germ agglutinin identified the plasma membrane of each cell (dashed outlines in C). (B) Virus infection in the absence of CHX (Left) resulted in the appearance of MeGFP fluorescence throughout the cell volume. The presence of CHX resulted in virus entry being observed by MeGFP fluorescence at the nuclear margin, which was released from incoming viral particles (Right, white arrows). (Scale bar: 10 µm.) (C) Representative examples of maximum-Z projections images from the whole-cell volume obtained with optical sections separated by 0.3 µm using spinning disk confocal microscopy. MeGFP fluorescence at the nuclear margin released from incoming viral particles is highlighted (white arrows). (Scale bar: 10 µm.) (D) Quantification of the number of cells with nuclear margin labeling from three independent experiments, each determined from fields containing 59 to 90 cells (error bars show SEM). The statistical significance of the entry data was analyzed for statistical significance by one-way ANOVA and Tukey post hoc test (***P ≤ 0.001).
Fig. 3.
Fig. 3.
Endolysosomal traffic of VSV-MeGFP-ZEBOV in cells expressing TagRFP-Rab5c or TagRFP-Rab7a in the presence of Apilimod or Vacuolin-1 (SI Appendix and Movies S1 and S2). (A) Schematic of live cell imaging experiment using SVG-A cells expressing fluorescently tagged TagRFP-Rab5c or TagRFP-Rab7a. Cells were infected with VSV-MeGFP, VSV-MeGFP-V269H, or VSV-MeGFP-ZEBOV (MOI = 4). Viruses trafficking (monitored with MeGFP) to the endolysosomal system (recognized by their labeling with TagRFP-Rab5c or TagRFP-Rab7a) and virus entry (established by MeGFP at the nuclear margin) were ascertained by live-cell florescence imaging using a spinning disk confocal microscope. (B) Visualization of VSV-MeGFP infection in TagRFP-Rab5c cells in the absence (Left) or presence (Right, white arrows) of CHX using live-cell imaging. (Scale bar: 10 µm.) (C) Genomic PCR analysis of SVG-A cells showing biallelic integration of TagRFP into the RAB5C genomic locus by cotransfection of a plasmid coding for Cas9, a linear PCR product coding for the specific guide RNAstargeting a region near the ATG codon of Rab5c under the control of the U6 promoter, and a template plasmid containing the RFP sequence flanked by 800 base pairs upstream and downstream of the targeted region (see Materials and Methods for more details) to generate a clonal gene-edited cell line expressing TagRFP-Rab5c. (D) Quantification of VSV-MeGFP and VSV-MeGFP-ZEBOV colocalization with Rab5c containing endosomes in the presence of CHX together with absence or presence of 5 µM Apilimod depicted in E. Data show number of viruses that colocalized with endosomes containing or not containing Rab5c within the complete volume of the single cells depicted in E. (E) Representative examples of maximum-Z projection images from four optical sections spaced 0.35 µm apart of virus entry without or with IN1, Vacuolin, or Apilimod for VSV-MeGFP (Top), VSV-Me-GFP-V269H (Middle), and VSV-MeGFP-ZEBOV (Bottom). Each condition is in the presence of CHX. All viruses reach Rab5c-containing endosomes, but only VSV-MeGFP-ZEBOV fails to penetrate in the presence of IN1, Vacuolin-1, or Apilimod. (Scale bars: 10 µm.) Insets correspond to a single optical section. Insets (yellow boxes) correspond to a single optical section. (Scale bars: 3 µm.) (F) Visualization of VSV infection in TagRFP-Rab7a cells in the absence of CHX (Left) and entry in the presence of CHX (Right, white arrows). (Scale bar: 10 µm.) (G) Genomic PCR analysis showing biallelic integration of TagRFP into the RAB7A genomic locus to generate a clonal gene-edited cell-line expressing TagRFP-Rab7a, using the same approach as used for RAB5C. (H) Quantification of VSV-MeGFP and VSV-MeGFP-ZEBOV colocalization with Rab7a containing endosomes in the presence of CHX with or without 5 µM Apilimod within the complete cell volumes in the images depicted in I. (I) Representative examples of maximum-Z projection images from four optical sections spaced 0.35 µm apart of virus entry without or with IN1, Vacuolin, or Apilimod for VSV-MeGFP (Top), VSV-Me-GFP-V269H (Middle), and VSV-MeGFP-ZEBOV (Bottom). All viruses reach Rab7a-containing endosomes, but only VSV-MeGFP-ZEBOV fails to penetrate in the presence of IN1, Vacuolin-1, or Apilimod. (Scale bars: 10 µm.) Insets correspond to a single optical section. Insets (yellow boxes) correspond to a single optical section. (Scale bars: 3 µm.)
Fig. 4.
Fig. 4.
Endolysosomal traffic of VSV-MeGFP-ZEBOV in cells expressing NPC1-Halo or coexpressing mScarlet-EEA1 and NPC1-Halo in the presence of Apilimod (SI Appendix and Movie S3). (A) Schematic of live-cell imaging experiment with gene-edited SVG-A cells expressing NPC1-Halo or NPC1-Halo together with mScarlet-EEA1. Halo was labeled with either JF549 or JF647. Cells were infected with VSV-MeGFP-ZEBOV (MOI = 3). (B) Genomic PCR analysis showing biallelic integration of Halo into the NPC1 genomic locus to generate a clonal gene-edited cell line expressing NPC1-Halo, using the same approach as for RAB5C and RAB7A. (C) Representative examples of maximum-Z projection images from four optical sections spaced 0.25 µm apart in the absence (Left) and presence (Right) of Apilimod, showing that VSV-MeGFP-ZEBOV reached NPC1-Halo−containing endosomes even in the presence of Apilimod, while failing to penetrate and infect. (Scale bar: 10 µm.) Insets correspond to a single optical section. (Scale bar: 3 µm.) (D) SVG-A cells with genomic NPC1-Halo were further gene edited to contain EEA1 tagged with mScarlet. Genomic PCR analysis shows biallelic integration into the EEA1 locus of mScarlet-EEA1 (Left) and into the NPC1 locus of NPC1-Halo (Right). (E) Representative examples of maximum-Z projection images in the absence (Left) and presence (Right) of Apilimod, showing that VSV-MeGFP-ZEBOV reached endosomes containing mScarlet-EEA1 and endosomes containing both mScarlet-EEA1 and NPC1-Halo in the presence of Apilimod, while failing to penetrate and infect. (Scale bar: 10 µm.) Insets correspond to a single optical section. (Scale bar: 3 µm.) (F) Representative images of parental cells (Top) and gene-edited SVG-A cells expressing NPC1-Halo (Bottom) incubated with filipin III (naturally fluorescent polyene antibiotic that binds to cholesterol) in the absence (Left) and presence (Right, NPC1 inhibitor of cholesterol export) of U18666A, showing NPC1-Halo is a functional cholesterol transporter. (Scale bar: 10 µm.)
Fig. 5.
Fig. 5.
Extent of VSV-MeGFP-ZEBOV traffic into endosomes enriched in NPC1-Halo or NPC1-Halo and mScarlet-EEA1. (A) Schematic of imaging experiment of VSV-MeGFP-ZEBOV trafficking in NPC1-Halo or NPC1-Halo and mScarlet-EEA1 gene-edited SVG-A cells. (B) Representative examples of maximum-Z projection images from four optical sections spaced 0.25 µm apart in the absence and presence of Apilimod 2 h or 4 h postinfection. A large number of VSV-MeGFP-ZEBOV but not of VSV-MeGFP particles accumulated in the endosomes enlarged upon Apilimod treatment. (Scale bar: 10 µm.) (C) Quantification of VSV-MeGFP-ZEBOV colocalization with mScarlet-EEA1 alone, both mScarlet-EEA1 and NPC1-Halo, or NPC1-Halo alone 2 h and 4 h postinfection, in the absence or presence of 5 µM Apilimod. Data obtained from complete cell volumes are presented as numbers and corresponding percent colocalizations of VSV-MeGFP-ZEBOV particles associated with a given type of endosome.
Fig. 6.
Fig. 6.
Apilimod and Vacuolin-1 inhibit infection of VSV-eGFP-SARS-CoV-2. (A) Schematic of infectivity assay of VSV-eGFP, VSV-eGFP-ZEBOV, and VSV-eGFP-SARS-CoV-2 in MA104 cells. MA104 cells were pretreated for 1 h with the indicated concentration of Apilimod. Pretreated cells were inoculated with the indicated virus (MOI = 1) for 1 h at 37 °C. At 6 h postinfection cells were harvested, and the fraction of cell expressing eGFP cells was quantified by flow cytometry. (B) Quantification of the infectivity is shown with averages ± SEM from three independent experiments. Statistical significance was determined using a t test (*P ≤ 0.05; **P ≤ 0.01).
Fig. 7.
Fig. 7.
Apilimod inhibits infection of SARS-CoV-2 virus. (A) Schematic of infectivity assay of fully infectious Sars-CoV-2 (strain 2019-nCoV/USA-WA1/2020). Vero E6 cell monolayers were pretreated with medium containing DMSO or serial dilutions of Apilimod at the indicated concentrations. SARS-CoV-2 was diluted (MOI = 0.01) in Apilimod-containing medium and added to Vero E6 cells for 1 h at 37 °C. After adsorption, the viral inocula were removed, and medium containing the respective concentration of Apilimod was reapplied. After 24-h incubation, supernatants were harvested and titrated by focus-forming assay on a separate set of Vero E6 cells. (B) Quantification of the infectivity is shown with averages ± SEM from three independent experiments per condition and expressed as the percent infection relative to mock-treated SARS-CoV-2 infected cells.

Update of

References

    1. Chandran K., Sullivan N. J., Felbor U., Whelan S. P., Cunningham J. M., Endosomal proteolysis of the Ebola virus glycoprotein is necessary for infection. Science 308, 1643–1645 (2005). - PMC - PubMed
    1. Carette J. E. et al. ., Ebola virus entry requires the cholesterol transporter Niemann-Pick C1. Nature 477, 340–343 (2011). - PMC - PubMed
    1. Huang I.-C. et al. ., SARS coronavirus, but not human coronavirus NL63, utilizes cathepsin L to infect ACE2-expressing cells. J. Biol. Chem. 281, 3198–3203 (2006). - PMC - PubMed
    1. Simmons G. et al. ., Inhibitors of cathepsin L prevent severe acute respiratory syndrome coronavirus entry. Proc. Natl. Acad. Sci. U.S.A. 102, 11876–11881 (2005). - PMC - PubMed
    1. Ou X. et al. ., Characterization of spike glycoprotein of SARS-CoV-2 on virus entry and its immune cross-reactivity with SARS-CoV. Nat. Commun. 11, 1620 (2020). - PMC - PubMed

Publication types

MeSH terms

LinkOut - more resources