. 2020 Nov 2;130(11):6141-6150.
doi: 10.1172/JCI142004.

Sex, age, and hospitalization drive antibody responses in a COVID-19 convalescent plasma donor population

Affiliations

Sex, age, and hospitalization drive antibody responses in a COVID-19 convalescent plasma donor population

Sabra L Klein et al. J Clin Invest. .

Abstract

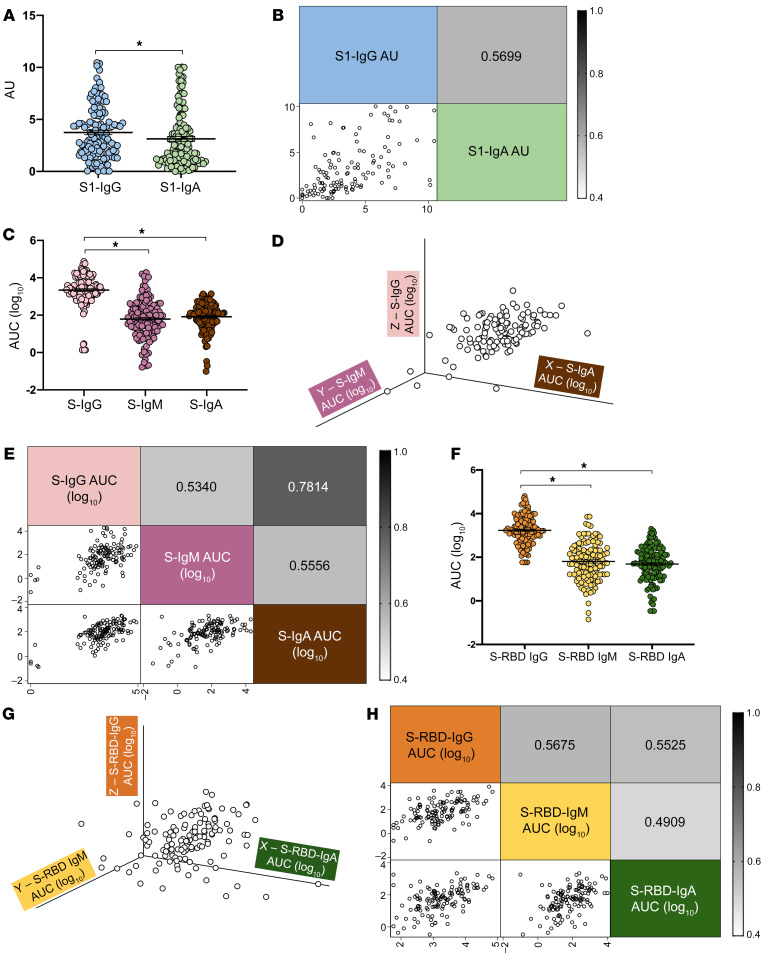
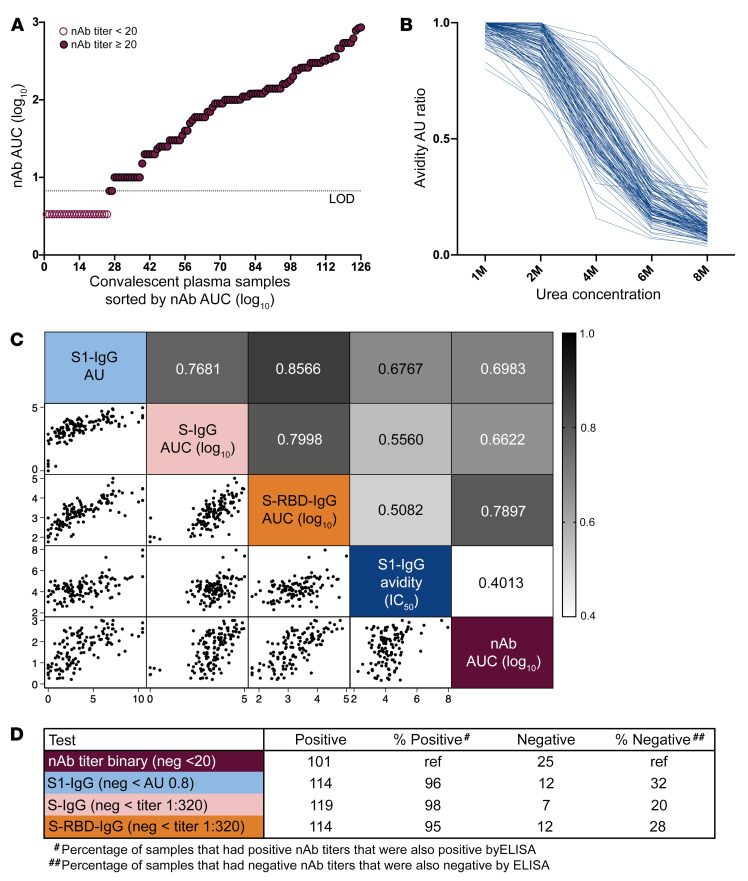
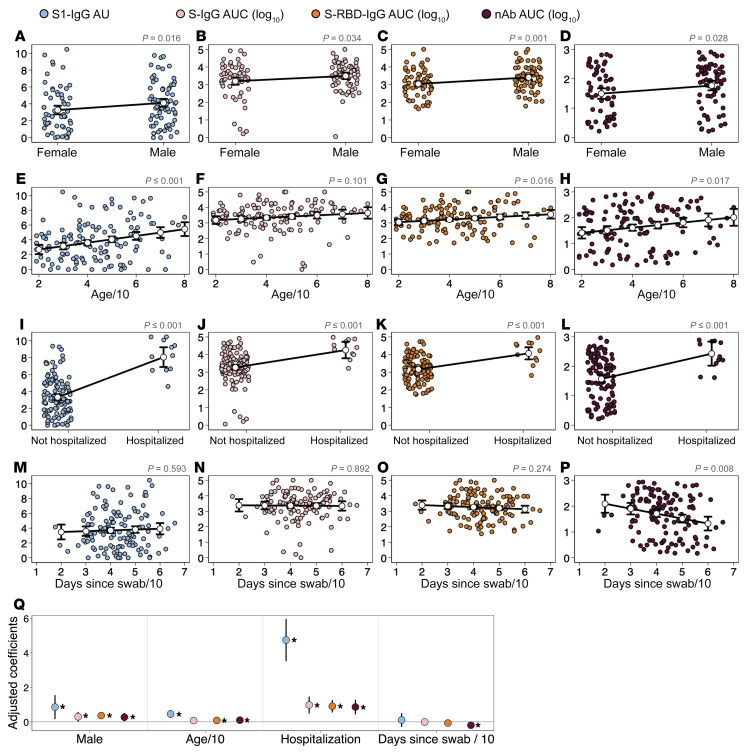
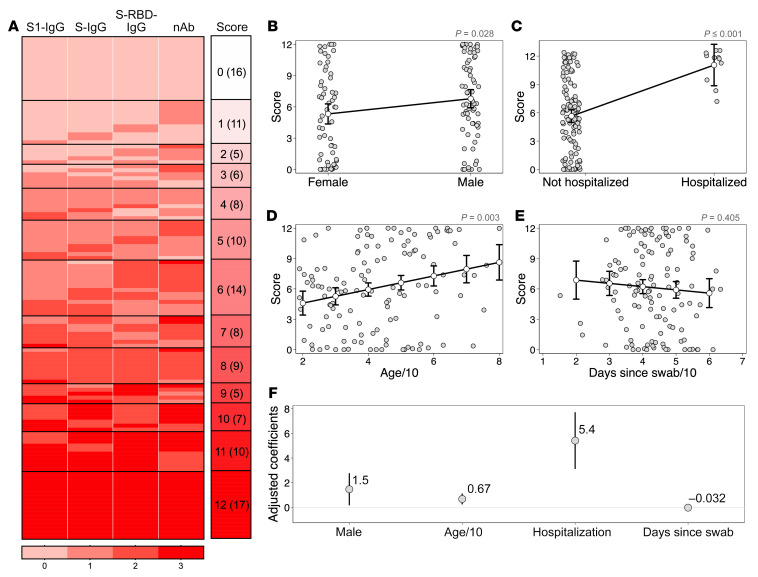
Convalescent plasma is a leading treatment for coronavirus disease 2019 (COVID-19), but there is a paucity of data identifying its therapeutic efficacy. Among 126 potential convalescent plasma donors, the humoral immune response was evaluated using a severe acute respiratory syndrome coronavirus 2 (SARS-CoV-2) virus neutralization assay with Vero-E6-TMPRSS2 cells; a commercial IgG and IgA ELISA to detect the spike (S) protein S1 domain (EUROIMMUN); IgA, IgG, and IgM indirect ELISAs to detect the full-length S protein or S receptor-binding domain (S-RBD); and an IgG avidity assay. We used multiple linear regression and predictive models to assess the correlations between antibody responses and demographic and clinical characteristics. IgG titers were greater than either IgM or IgA titers for S1, full-length S, and S-RBD in the overall population. Of the 126 plasma samples, 101 (80%) had detectable neutralizing antibody (nAb) titers. Using nAb titers as the reference, the IgG ELISAs confirmed 95%-98% of the nAb-positive samples, but 20%-32% of the nAb-negative samples were still IgG ELISA positive. Male sex, older age, and hospitalization for COVID-19 were associated with increased antibody responses across the serological assays. There was substantial heterogeneity in the antibody response among potential convalescent plasma donors, but sex, age, and hospitalization emerged as factors that can be used to identify individuals with a high likelihood of having strong antiviral antibody responses.

Keywords: COVID-19; Immunoglobulins.


Conflict of interest statement

Conflict of interest: EMB reports receiving personal fees and nonfinancial support from Terumo BCT and personal fees and nonfinancial support from Grifols Diagnostic Solutions. EMB is a member of the United States FDA Blood Products Advisory Committee. Any views or opinions that are expressed in this manuscript are those of the authors, based on their own scientific expertise and professional judgment; they do not necessarily represent the views of either the Blood Products Advisory Committee or the formal position of the FDA, and also do not bind or otherwise obligate or commit either the advisory committee or the agency to the views expressed.

Figures

Figure 1
Figure 1. IgG is the primary isotype produced against SARS–CoV-2 S protein.
Convalescent plasma samples from patients who recovered from COVID-19 were used to assess antibody isotypes that recognize SARS–CoV-2 antigens. (A) Commercial kits from EUROIMMUN were used to measure total IgG and IgA antibodies against the SARS–CoV-2 S protein domain S1 at an OD of 450 nm (OD450) and were compared with a calibrator to yield AU. (B) The correlation between anti–S1 isotypes is graphed, with the r value noted. Indirect ELISAs were used to measure IgG, IgM, and IgA antibody levels against S protein (C) and IgG, IgM, and IgA against S-RBD (F) and are graphed as AUC values. The heterogeneity of the IgG, IgM, and IgA antibody responses against S protein (D) and S-RBD (G) are shown in 3D scatter plots, with IgA on the x axis, IgM on the y axis, and IgG on the z axis. The correlations between IgG, IgM, and IgA for S protein (E) and S-RBD (H) are included, with r values shown, and are shaded darker for higher correlation values or lighter for lower correlation values. Data indicate the mean ± SEM. n = 126. *P < 0.05, by paired t test.
Figure 2
Figure 2. nAb titers correlate with IgG antibodies that recognize SARS–CoV-2 S protein.
Convalescent plasma samples from patients recovered from COVID-19 were used to assess functional antibody levels. (A) Microneutralization assays were performed on each plasma sample in 2-fold serial dilutions, with the AUC calculated for all samples with a titer of 20 or higher. (B) Avidity assay used varying amounts of urea to dissociate the anti–S1 spike protein domain IgG/antigen complex from each plasma sample (represented as arbitrary units, AU) to identify the optimal avidity AU ratio (2 M urea) for subsequent analyses. (C) The correlations between nAb AUC values, anti–S1-IgG avidity AU, anti–S1-IgG AU, anti–S-IgG AUC, and anti–S-RBD-IgG AUC are shown, with the r values indicated as well as darker shading for higher correlation values and lighter shading for lower correlation values. (D) For each ELISA assay, the percentage of positive and negative (neg) samples was defined and compared with the nAb AUC (ref), with the negative cutoff values for each assay listed.
Figure 3
Figure 3. Sex, age, hospitalization, and time since collection of the PCR+ nasal swab are associated with antibody responses to SARS–CoV-2.
Multiple linear regression models were used to analyze the continuous outcomes of anti–S protein domain S1-IgG AU (A, E, I, and M), anti–S-IgG AUC (B, F, J, and N), anti–S-RBD AUC (C, J, K, and O), and nAb (NT) AUC (D, H, L, and P). For each outcome, the model included parameters for the 4 predictors of interest: sex (AD), age in decades (EH), hospitalization status (JL), and number of days since collection of the PCR+ nasal swab (MP). Regression models included the 124 subjects for whom complete predictor data were available (hospitalization status was missing for 2 subjects). In each panel, colored circles show the raw data, and white dots show the marginal effect of the given predictor or the model-predicted outcome (with a 95% CI) for the average person for different levels of the given predictor. P values at the top of each panel represent the significance level for the parameter. The 4 models are summarized in Q, where the position of the marker indicates the coefficient value and the 95% CI, and asterisks indicate significance (*P < 0.05).
Figure 4
Figure 4. Male sex and hospitalization are predictors of overall greater antibody titers in convalescent plasma.
(A) Composite scores were computed for each subject on the basis of the quartile of their response across the anti–S protein domain S1-IgG, anti–S-IgG, anti–S-RBD-IgG, and nAb (NT) assays. The distribution of scores among the study population is shown to the right of the heatmap. (BE) Multiple linear regression analysis was performed on the continuous outcome of score, including parameters for sex, age in decades, hospitalization status, and number of days since collection of the PCR+ nasal swab scaled by 10. For each predictor, the raw data are shown in gray, and the marginal effect plus 95% CI of the given predictor for the average individual in the study is shown in white. P values on top of each panel represent the significance level for the parameter. (F) Summary of the model, where the position of the marker indicates the coefficient value and 95% CI or the expected increase in score for a 1-unit increase in each predictor.

Update of

References

    1. JHU. Johns Hopkins University Coronavirus Resource Center. https://coronavirus.jhu.edu/map.html Accessed 10/6/2020.
    1. Casadevall A, Pirofski LA. The convalescent sera option for containing COVID-19. J Clin Invest. 2020;130(4):1545–1548. doi: 10.1172/JCI138003. - DOI - PMC - PubMed
    1. Shen C, et al. Treatment of 5 critically ill patients with COVID-19 with convalescent plasma. JAMA. 2020;323(16):1582–1589. - PMC - PubMed
    1. Duan K, et al. Effectiveness of convalescent plasma therapy in severe COVID-19 patients. Proc Natl Acad Sci U S A. 2020;117(17):9490–9496. doi: 10.1073/pnas.2004168117. - DOI - PMC - PubMed
    1. Joyner MJ, et al. Early safety indicators of COVID-19 convalescent plasma in 5000 patients. J Clin Invest. 2020;130(9):4791–4797. doi: 10.1172/JCI140200. - DOI - PMC - PubMed

Publication types

MeSH terms

Substances