

Graphene Oxide Concentration Effect on the Optoelectronic Properties of ZnO/GO Nanocomposites
- PMID: 32764216
- PMCID: PMC7466397
- DOI: 10.3390/nano10081532
Graphene Oxide Concentration Effect on the Optoelectronic Properties of ZnO/GO Nanocomposites
Abstract
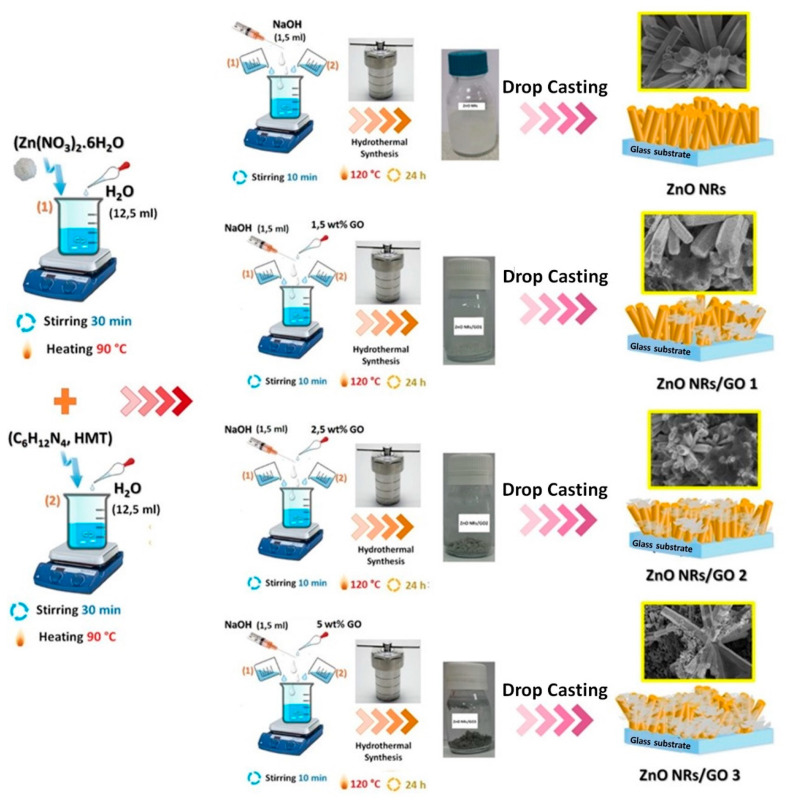
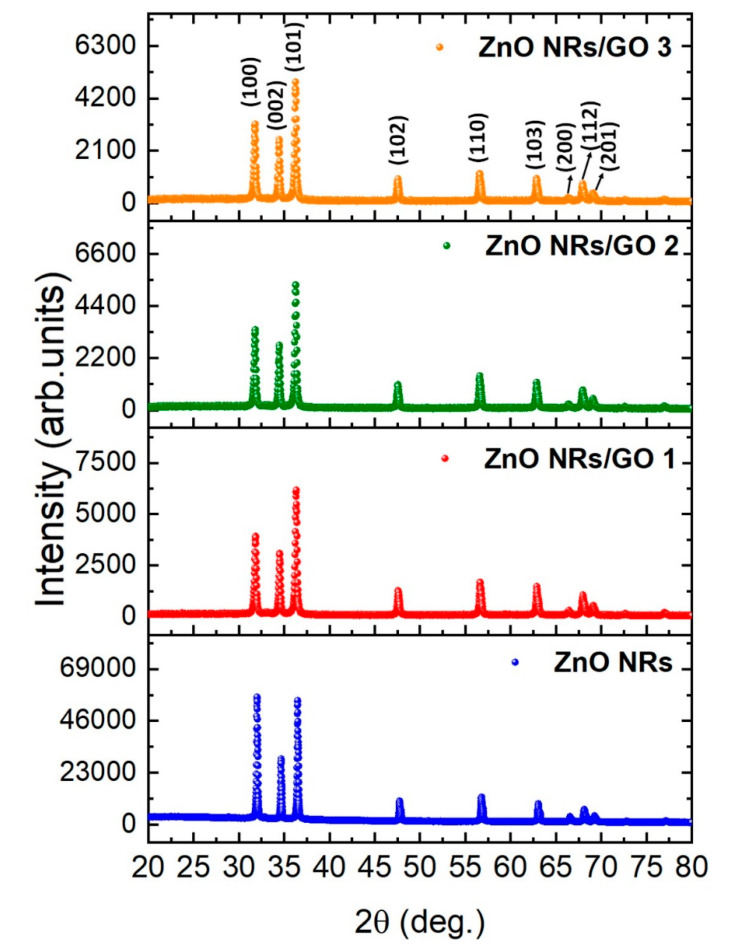
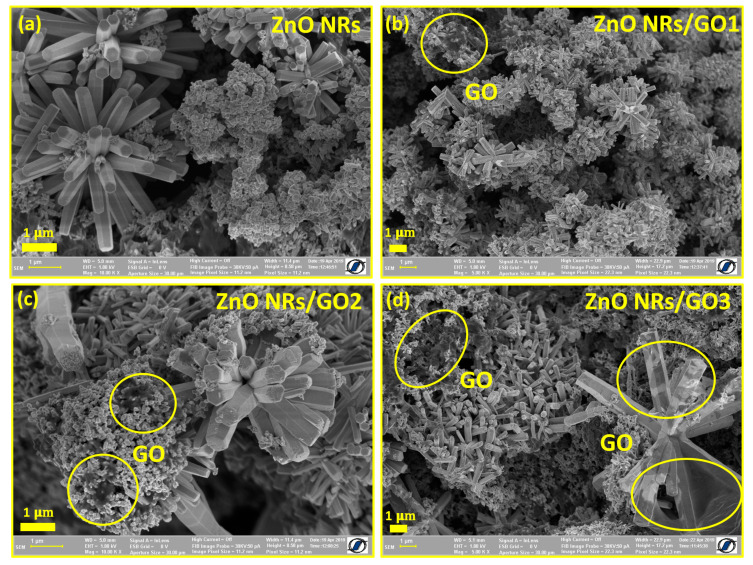
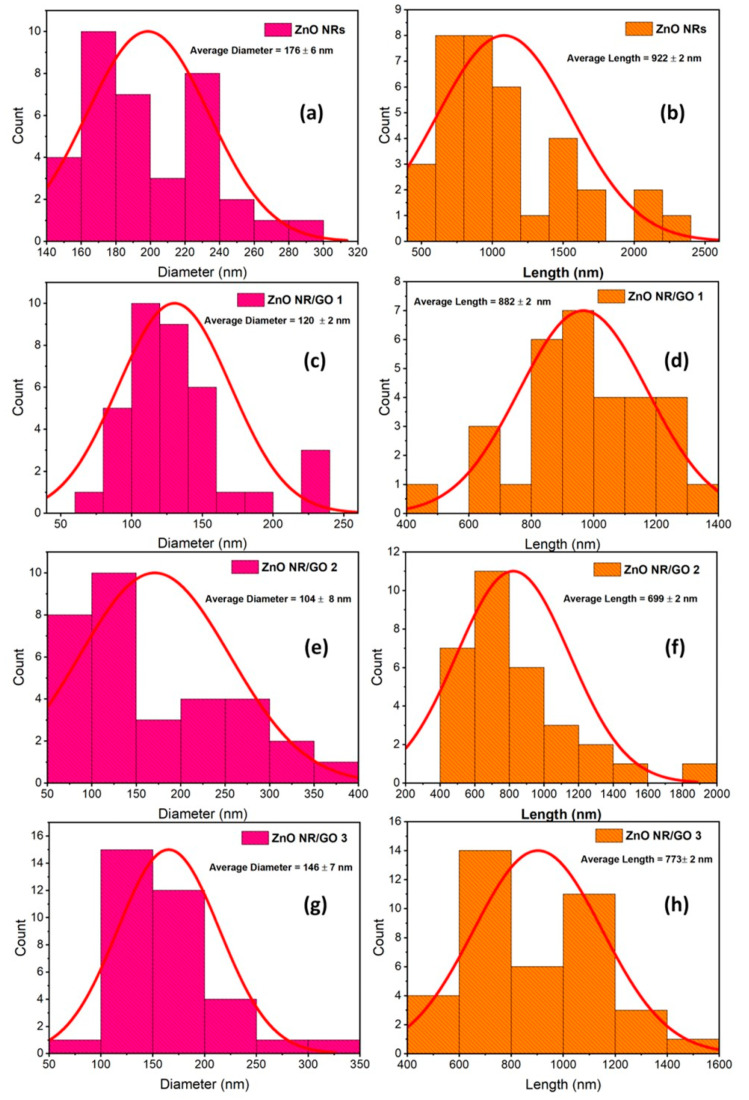
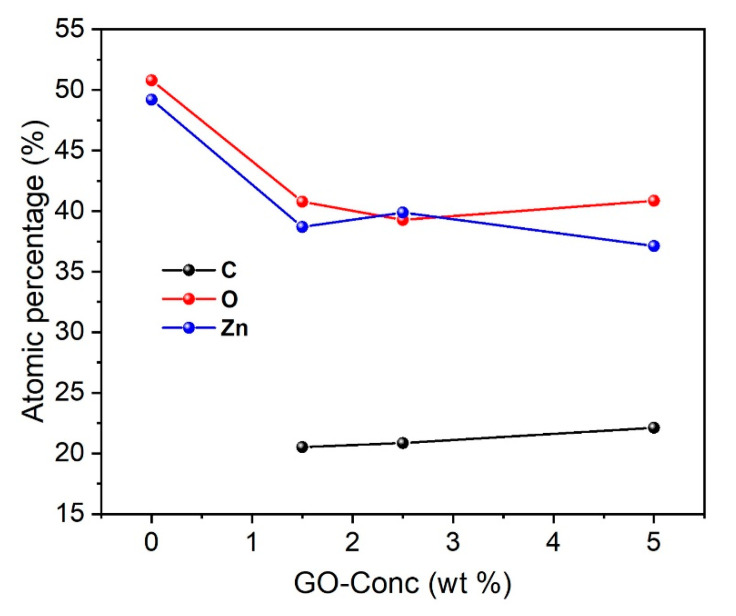
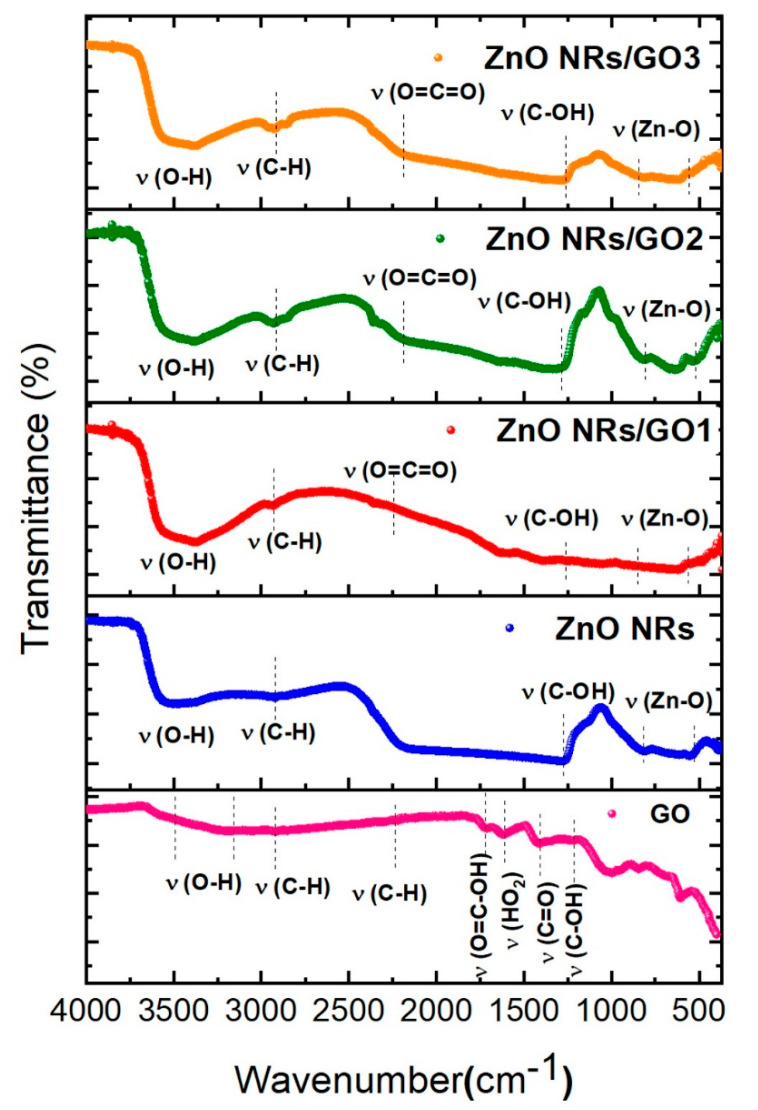
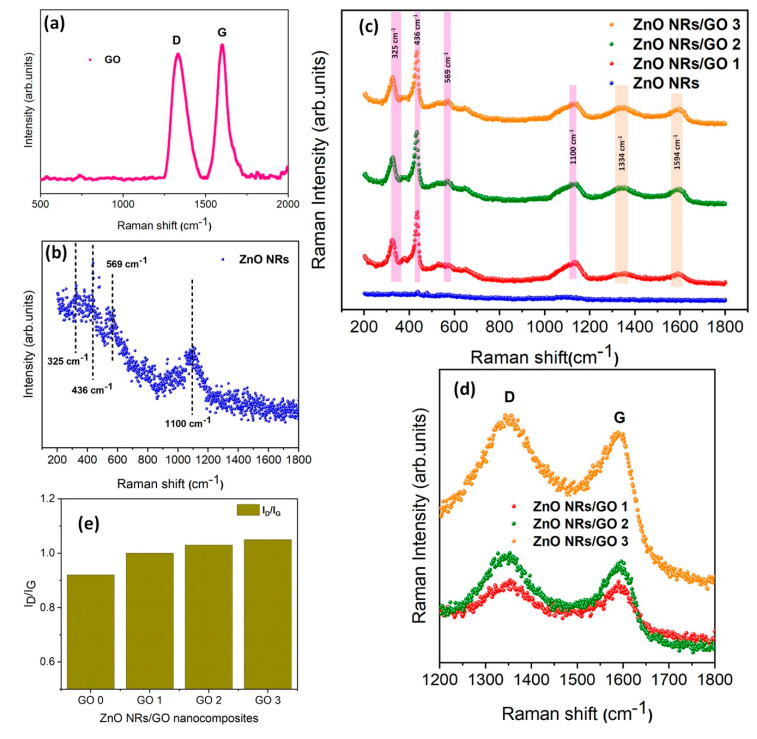
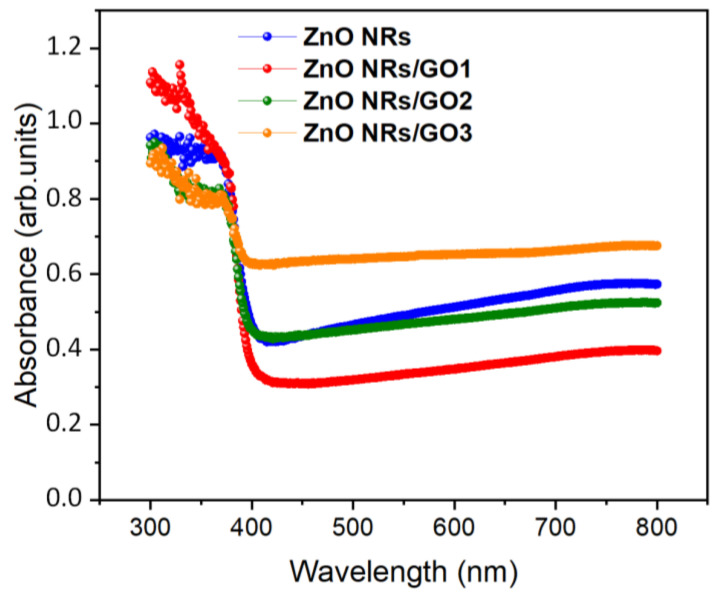
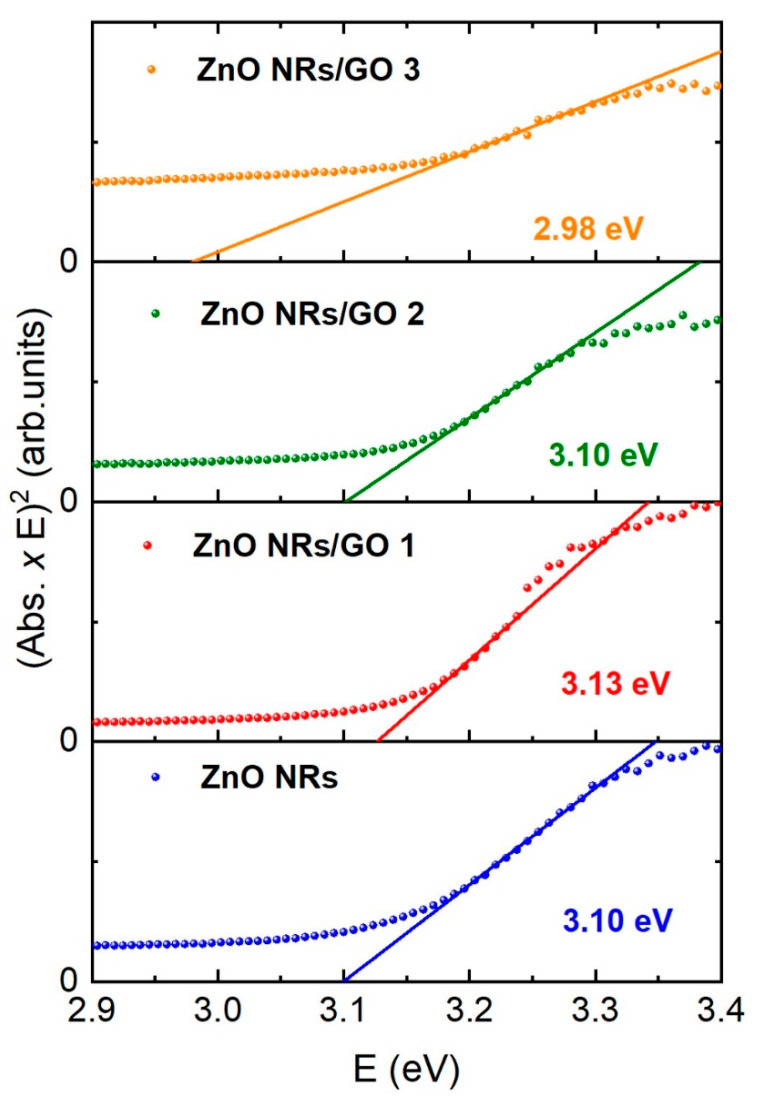
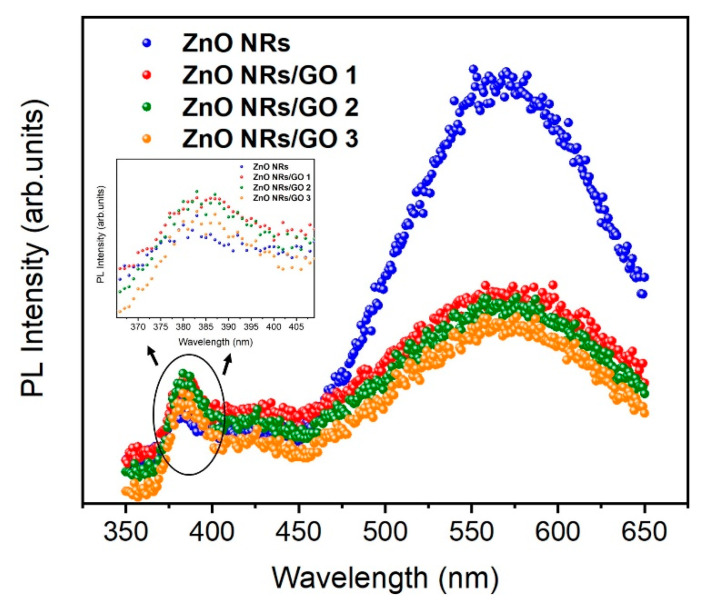
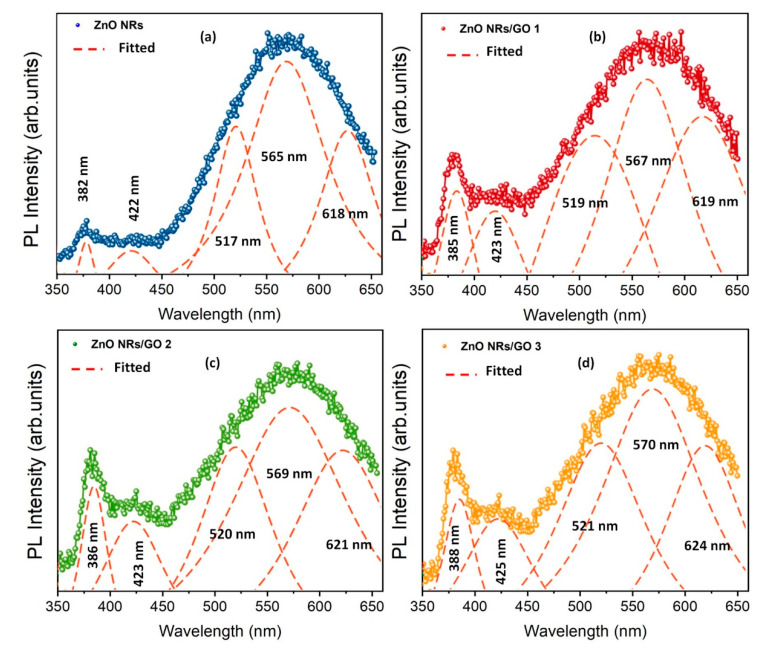
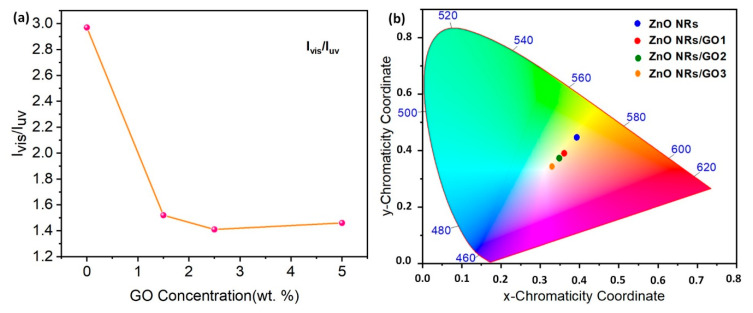
In this work, the effects of graphene oxide (GO) concentrations (1.5 wt.%, 2.5 wt.%, and 5 wt.%) on the structural, morphological, optical, and luminescence properties of zinc oxide nanorods (ZnO NRs)/GO nanocomposites, synthesized by a facile hydrothermal process, were investigated. X-ray diffraction (XRD) patterns of NRs revealed the hexagonal wurtzite structure for all composites with an average coherence length of about 40-60 nm. A scanning electron microscopy (SEM) study confirmed the presence of transparent and wrinkled, dense GO nanosheets among flower-like ZnO nanorods, depending on the GO amounts used in preparation. Raman spectroscopy, Fourier transform infrared spectroscopy (FTIR), ultraviolet-visible (UV-Vis) absorption spectroscopy, and photoluminescence (PL) measurements revealed the impact of GO concentration on the optical and luminescence properties of ZnO NRs/GO nanocomposites. The energy band gap of the ZnO nanorods was independent of GO concentration. Photoluminescence spectra of nanocomposites showed a significant decrease in the intensities in the visible light range and red shifted suggesting a charge transfer process. The nanocomposites' chromaticity coordinates for CIE 1931 color space were estimated to be (0.33, 0.34), close to pure white ones. The obtained results highlight the possibility of using these nanocomposites to achieve good performance and suitability for optoelectronic applications.
Keywords: CIE diagram; ZnO NRs/GO nanocomposites; hydrothermal method; optoelectronic properties.
Conflict of interest statement
The authors declare no conflict of interest.
Figures
References
-
- Yi G.C., Wang C., Park W. ZnO nanorods: Synthesis, characterization and applications. Semicond. Sci. Technol. 2005;20:S22–S34. doi: 10.1088/0268-1242/20/4/003. - DOI
-
- Wen B., Huang Y., Boland J.J. Controllable growth of ZnO nanostructures by a simple solvothermal process. J. Phys. Chem. C. 2008;112:106–111. doi: 10.1021/jp076789i. - DOI
-
- Fan Z., Wang D., Chang P.-C., Tseng W.-Y., Lu J.G. ZnO nanowire field-effect transistor and oxygen sensing property. Appl. Phys. Lett. 2004;85:5923–5925. doi: 10.1063/1.1836870. - DOI
-
- Paul R., Gayen R.N., Biswas S., Bhat S.V., Bhunia R. Enhanced UV detection by transparent graphene oxide/ZnO composite thin films. RSC Adv. 2016;6:61661–61672. doi: 10.1039/C6RA05039E. - DOI
Grants and funding
LinkOut - more resources
Full Text Sources
Miscellaneous
