. 2020 Aug 6;10(1):12207.
doi: 10.1038/s41598-020-68872-9.

Increased future occurrences of the exceptional 2018-2019 Central European drought under global warming

Affiliations

Increased future occurrences of the exceptional 2018-2019 Central European drought under global warming

Vittal Hari et al. Sci Rep. .

Abstract

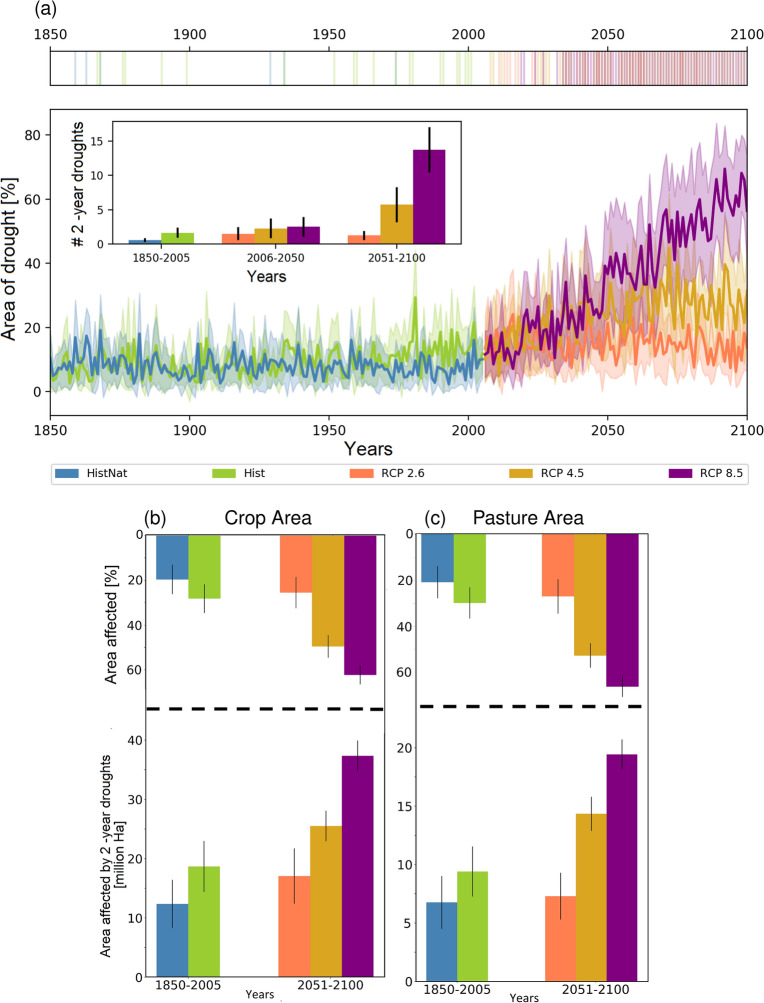
Since the spring 2018, a large part of Europe has been in the midst of a record-setting drought. Using long-term observations, we demonstrate that the occurrence of the 2018-2019 (consecutive) summer drought is unprecedented in the last 250 years, and its combined impact on the growing season vegetation activities is stronger compared to the 2003 European drought. Using a suite of climate model simulation outputs, we underpin the role of anthropogenic warming on exacerbating the future risk of such a consecutive drought event. Under the highest Representative Concentration Pathway, (RCP 8.5), we notice a seven-fold increase in the occurrence of the consecutive droughts, with additional 40 ([Formula: see text]) million ha of cultivated areas being affected by such droughts, during the second half of the twenty-first century. The occurrence is significantly reduced under low and medium scenarios (RCP 2.6 and RCP 4.5), suggesting that an effective mitigation strategy could aid in reducing the risk of future consecutive droughts.


Conflict of interest statement

The authors declare no competing interests.

Figures

Figure 1
Figure 1
Anomalies of climate and vegetation health index (VHI) during 2003, 2018 and 2019. (a,b,c) Mean summer (June–August) temperature anomalies (C) for 2003, 2018 and 2019 based on the 1980–2010 climatology, and (d,e,f) their corresponding precipitation anomalies (%). (g,h,i) Vegetation condition in terms of VHI during 2003, 2018 and 2019, respectively. (j) Yearly development of the summer time, percentage area with poor vegetation health (i.e., VHI 30) estimated over the Central European region (depicted by a black rectangular region in the panel g) during the period 2000–2019. The thick black line shows the year-wise weekly mean of VHI during summer months, and the pink bar represents the corresponding 95% confidence limit based on the sampling distribution of the mean. The years 2003, 2015, 2018 and 2019 experienced the deprivation in the vegetation health, where the poor vegetation health extends over more than 20% of the central European region. The gray shaded region highlights the years 2018 and 2019, during which the poor vegetation health persists over more than 20% of the central European area, consecutively in 2 years. (k) Yearly summer-time precipitation and temperature anomalies estimated over the central Europe region during the 254 years. Three exceptional years of 2003, 2018 and 2019 are shown by the red dots, where the mean summer temperature anomalies over the Central Europe reached the record extreme conditions of more than 2C; and precipitation anomalies show deficit of more than 20%. The maps in the figure are generated using Python version 3.7.3 (https://www.python.org/search/?q=Python+3.7.3).
Figure 2
Figure 2
2-year droughts from the long-term observational records over the Central Europe. (a,b) Spatial distribution of the drought index estimated based on summer months (June–August) SPEI for 2018 and 2019. (c) Scatter plot showing the percent drought area over the Central Europe for the next year (At+1) as a function of current year drought area (At). Prominent drought years, viz., 1949, 1950, 2003, 2015; and the recent 2018 and 2019 years, during which the spatial extent of summer droughts are significantly higher than the rest are highlighted in red dots. The cumulative distribution of the percent drought area is shown in the right panel of (c), with highlighted major drought years. The green dashed lines in (c) depict the drought area threshold of 33.3%—i.e., one third of the Central Europe region. The 2018–2019 event stands alone as an exceptional event for the consecutive droughts during the last 254 years (1766–2019). The maps in the figure are generated using Python version 3.7.3 (https://www.python.org/search/?q=Python+3.7.3).
Figure 3
Figure 3
2-year droughts from state-of-the-art climate model simulations and its implications on cropland and pasture. (a) Yearly development of the percent area of drought over the Central Europe based on the ensemble (N=11) of climate model simulations from CMIP5 under different experimental scenarios: natural only historical (HistNat), all-forcings historical (Hist), and three future RCPs (2.6, 4.5, and 8.5). The thick solid lines show the multimodel means, and the filled areas represent the 95% confidence intervals based on the sampling distribution of the mean from 11 GCMs simulations. The inset plot in (a) represents the number of 2-year droughts, with an areal extent in each year covering at-least one third of the Central European region, estimated over the specified time-period for different experimental scenarios (i.e., 1850–2005 for the Hist and HistNat; and 2006–2050/2051–2100 for the RCPs). Shown are the ensemble mean and 95% confidence limits based on the sampling distribution of the mean, corresponding to the 11 climate model outputs. The top panel of (a) depicts the year in which any of the 11 climate models show the 2-year droughts. The bottom panel of (b) shows cropland area (in million hectares) affected by the consecutive droughts under different experimental scenarios. The top panel of (b) shows the corresponding estimates in terms of percent of total cropland areas over the Central Europe, affected by the 2-year droughts. (c) Same as (b), but for pasture lands. The colors and ensemble statistics (i.e, mean and confidence intervals) are estimated as mentioned above.

References

    1. Pall P, et al. Anthropogenic greenhouse gas contribution to flood risk in England and Wales in autumn 2000. Nature. 2011;470:382–385. - PubMed
    1. Min S-K, Zhang X, Zwiers FW, Hegerl GC. Human contribution to more-intense precipitation extremes. Nature. 2011;470:378–381. - PubMed
    1. Ciais P, et al. Europe-wide reduction in primary productivity caused by the heat and drought in 2003. Nature. 2005;437:529–533. - PubMed
    1. Liu, X., He, B., Guo, L., Huang, L. & Chen, D. Similarities and differences in the mechanisms causing the European summer heatwaves in 2003, 2010, and 2018. Earth’s Futurein press (2020).
    1. Ionita M, et al. The European 2015 drought from a climatological perspective. Hydrol. Earth Syst. Sci. 2017;21:1397–1419.

Publication types