

Associations between historical redlining and birth outcomes from 2006 through 2015 in California
- PMID: 32764800
- PMCID: PMC7413562
- DOI: 10.1371/journal.pone.0237241
Associations between historical redlining and birth outcomes from 2006 through 2015 in California
Abstract
Background: Despite being one of the wealthiest nations, disparities in adverse birth outcomes persist across racial and ethnic lines in the United States. We studied the association between historical redlining and preterm birth, low birth weight (LBW), small-for-gestational age (SGA), and perinatal mortality over a ten-year period (2006-2015) in Los Angeles, Oakland, and San Francisco, California.
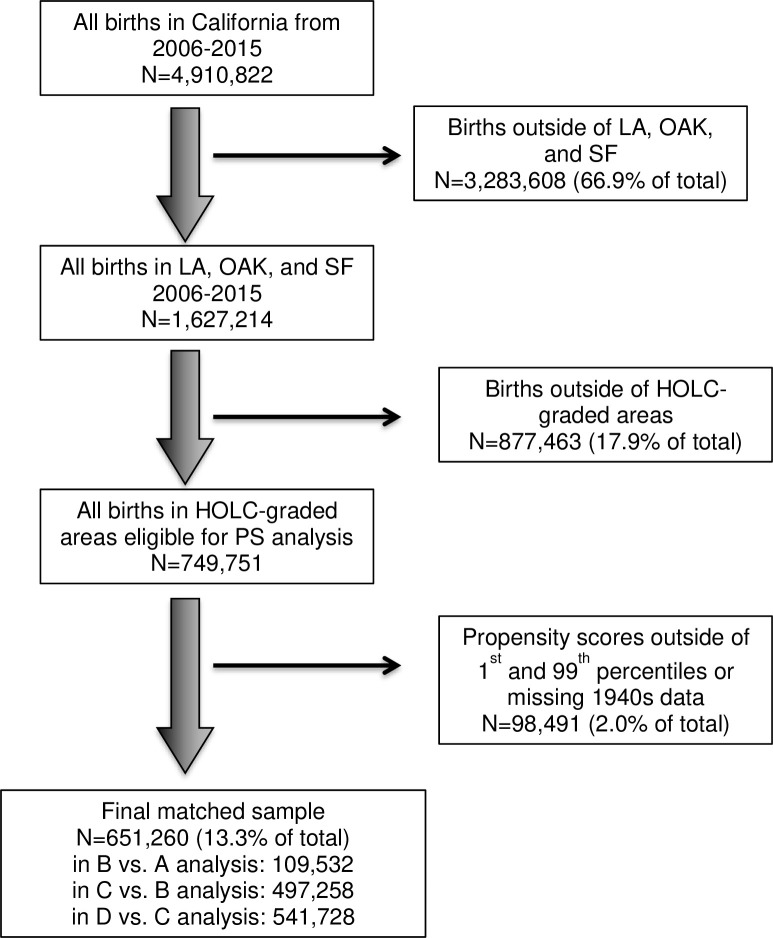
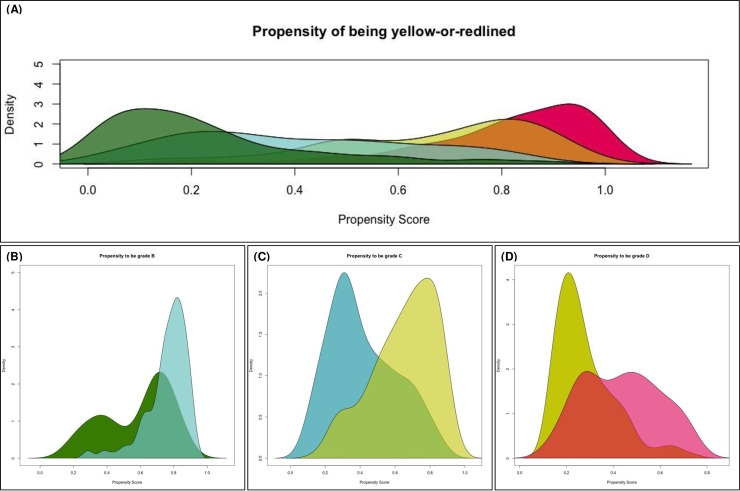
Methods: We used birth outcomes data from the California Office of Statewide Health Planning and Development between January 1, 2006 and December 31, 2015. Home Owners' Loan Corporation (HOLC) Security Maps developed in the 1930s assigned neighborhoods one of four grades that pertained to perceived investment risk of borrowers from that neighborhood: green (grade A) were considered "Best", blue (grade B) "Still Desirable", yellow (grade C) "Definitely Declining", and red (grade D, hence the term "redlining") "Hazardous". Geocoded residential addresses at the time of birth were superimposed on HOLC Security Maps to assign each birth a HOLC grade. We adjusted for potential confounders present at the time of Security Map creation by assigning HOLC polygons areal-weighted 1940s Census measures. We then employed propensity score matching methods to estimate the association of historical HOLC grades on current birth outcomes. Because tracts graded A had almost no propensity of receiving grade C or D and because grade B tracts had low propensity of receiving grade D, we examined birth outcomes in the three following comparisons: B vs. A, C vs. B, and D vs. C.
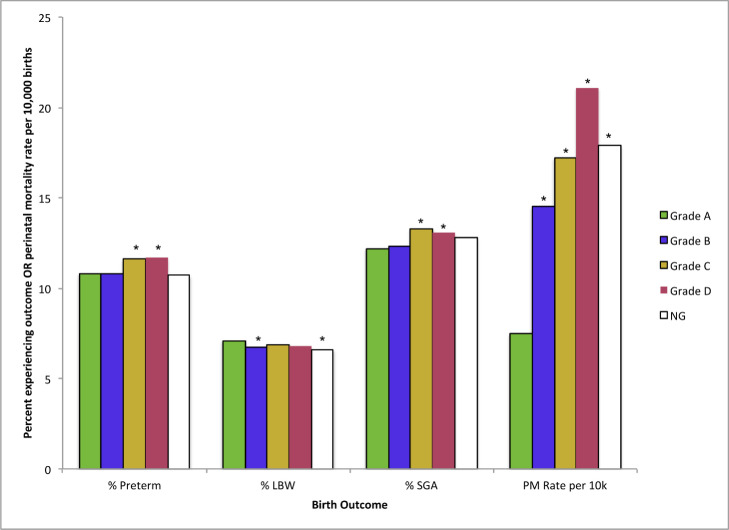
Results: The prevalence of preterm birth, SGA and mortality tended to be higher in worse HOLC grades, while the prevalence of LBW varied across grades. Overall odds of mortality and preterm birth increased as HOLC grade worsened. Propensity score matching balanced 1940s census measures across contrasting groups. Logistic regression models revealed significantly elevated odds of preterm birth (odds ratio (OR): 1.02, 95% confidence interval (CI): 1.00-1.05), and SGA (OR: 1.03, 95% CI: 1.00-1.05) in the C vs. B comparison and significantly reduced odds of preterm birth (OR: 0.93, 95% CI: 0.91-0.95), LBW (OR: 0.94-95% CI: 0.92-0.97), and SGA (OR: 0.94, 95% CI: 0.92-0.96) in the D vs. C comparison. Results differed by metropolitan area and maternal race.
Conclusion: Similar to prior studies on redlining, we found that worsening HOLC grade was associated with adverse birth outcomes, although this relationship was less clear after propensity score matching and stratifying by metropolitan area. Higher odds of preterm birth and SGA in grade C versus grade B neighborhoods may be caused by higher-stress environments, racial segregation, and lack of access to resources, while lower odds of preterm birth, SGA, and LBW in grade D versus grade C neighborhoods may due to population shifts in those neighborhoods related to gentrification.
Conflict of interest statement
The authors have declared that no competing interests exist.
Figures
References
-
- The World Bank. Current health expenditure per capita (current US$) [Internet]. [cited 2020 Jan 12]. Available from: https://data.worldbank.org/indicator/SH.XPD.CHEX.PC.CD?most_recent_value...
-
- Martin JA, Hamilton BE, Osterman MJK, Driscoll AK. Births: Final Data for 2018. Natl Vital Stat Reports [Internet]. 2019. [cited 2019 Dec 28];68:7, 8. Available from: https://www.cdc.gov/nchs/products/index.htm. - PubMed
-
- MacDorman MF, Gregory ECW. Fetal and Perinatal Mortality: United States, 2013. Natl Vital Stat Rep [Internet]. 2015. [cited 2019 Dec 28];64:1–24. Available from: http://www.ncbi.nlm.nih.gov/pubmed/26222771 - PubMed
-
- Casey J, James P, Cushing L, Jesdale B, Morello-Frosch R. Race, Ethnicity, Income Concentration and 10-Year Change in Urban Greenness in the United States. Int J Environ Res Public Health [Internet]. Multidisciplinary Digital Publishing Institute; 2017. [cited 2019 Nov 4];14:1546 Available from: http://www.mdpi.com/1660-4601/14/12/1546 - PMC - PubMed
