. 2020 Aug 7;16(8):e1008699.
doi: 10.1371/journal.ppat.1008699. eCollection 2020 Aug.

Genomic Surveillance of Yellow Fever Virus Epizootic in São Paulo, Brazil, 2016 - 2018

Affiliations

Genomic Surveillance of Yellow Fever Virus Epizootic in São Paulo, Brazil, 2016 - 2018

Sarah C Hill et al. PLoS Pathog. .

Abstract

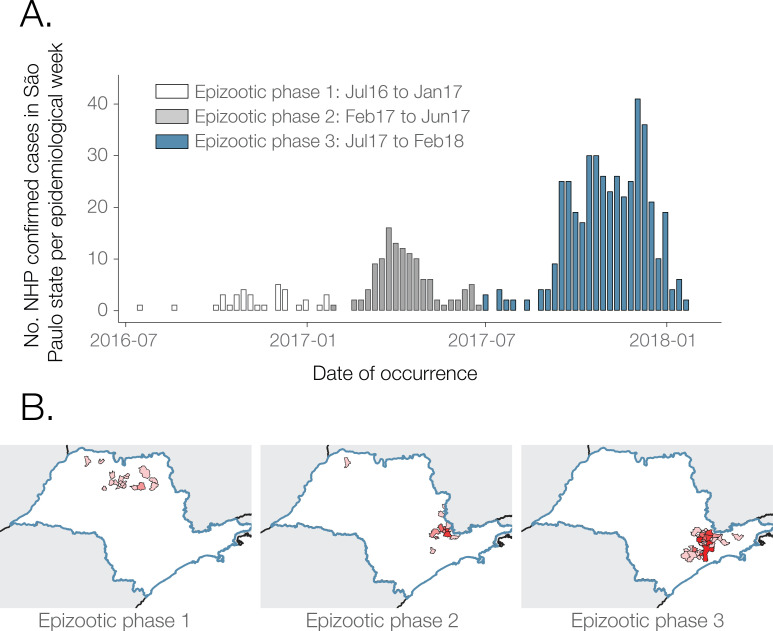
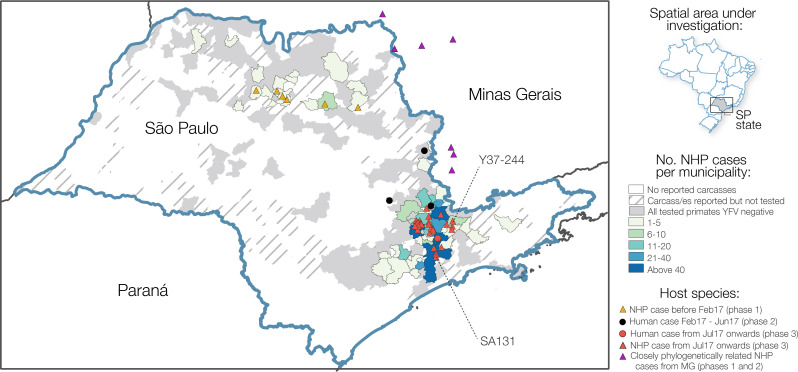
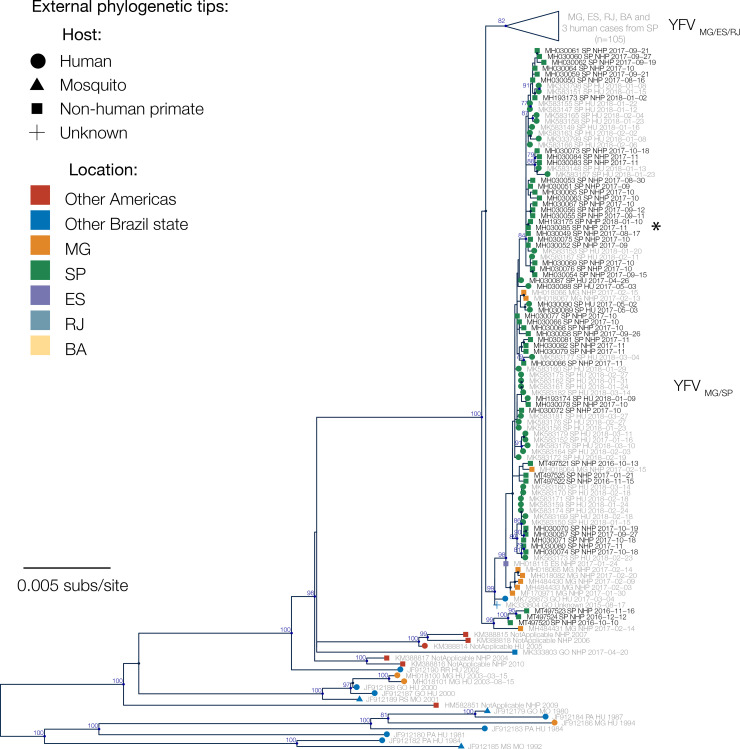
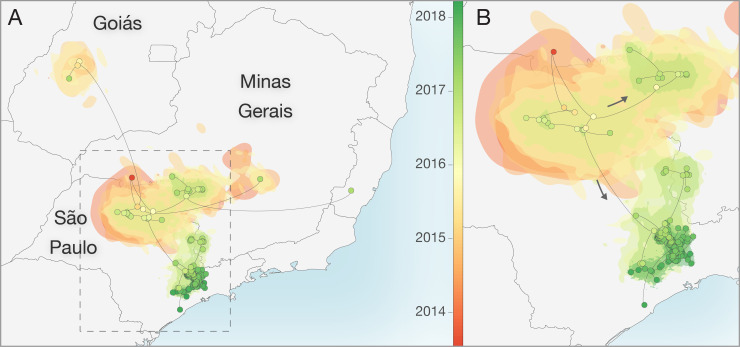
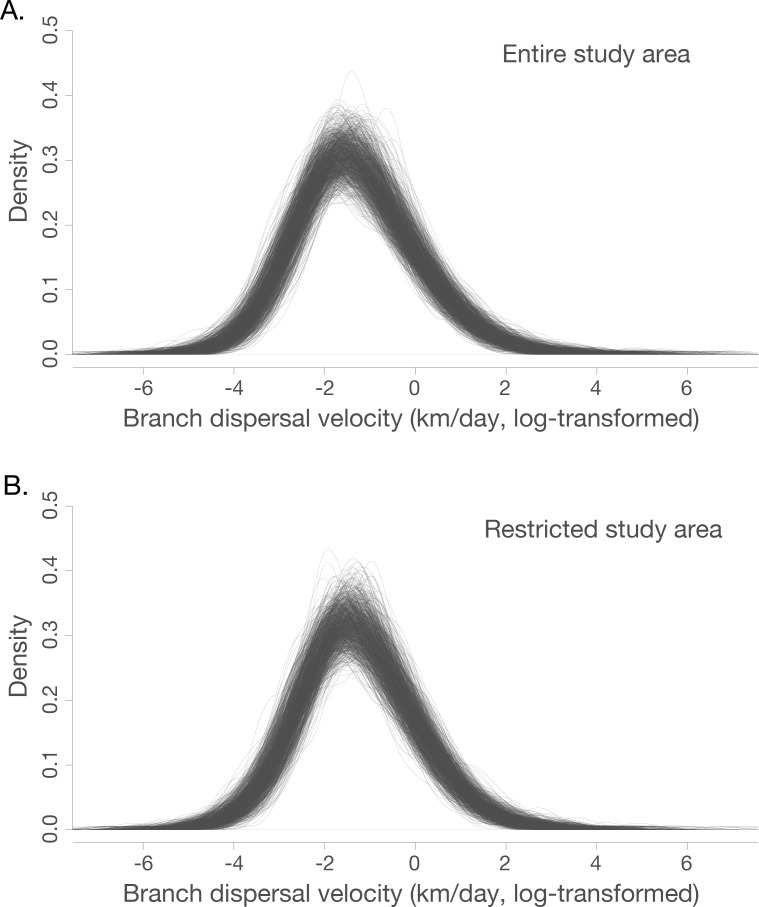
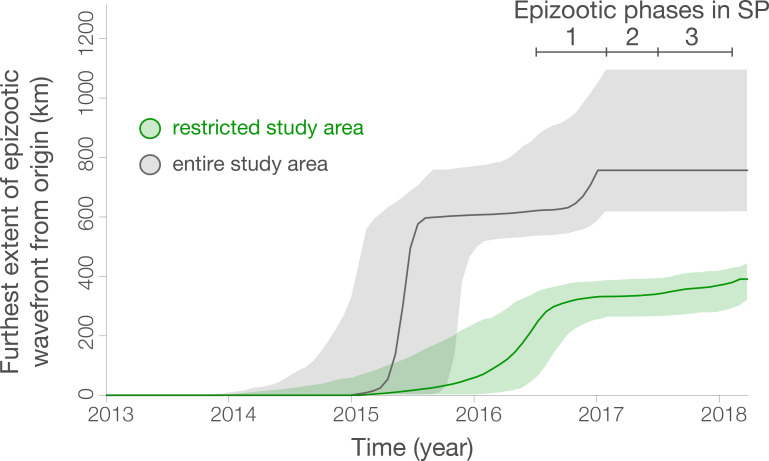
São Paulo, a densely inhabited state in southeast Brazil that contains the fourth most populated city in the world, recently experienced its largest yellow fever virus (YFV) outbreak in decades. YFV does not normally circulate extensively in São Paulo, so most people were unvaccinated when the outbreak began. Surveillance in non-human primates (NHPs) is important for determining the magnitude and geographic extent of an epizootic, thereby helping to evaluate the risk of YFV spillover to humans. Data from infected NHPs can give more accurate insights into YFV spread than when using data from human cases alone. To contextualise human cases, identify epizootic foci and uncover the rate and direction of YFV spread in São Paulo, we generated and analysed virus genomic data and epizootic case data from NHPs in São Paulo. We report the occurrence of three spatiotemporally distinct phases of the outbreak in São Paulo prior to February 2018. We generated 51 new virus genomes from YFV positive cases identified in 23 different municipalities in São Paulo, mostly sampled from NHPs between October 2016 and January 2018. Although we observe substantial heterogeneity in lineage dispersal velocities between phylogenetic branches, continuous phylogeographic analyses of generated YFV genomes suggest that YFV lineages spread in São Paulo at a mean rate of approximately 1km per day during all phases of the outbreak. Viral lineages from the first epizootic phase in northern São Paulo subsequently dispersed towards the south of the state to cause the second and third epizootic phases there. This alters our understanding of how YFV was introduced into the densely populated south of São Paulo state. Our results shed light on the sylvatic transmission of YFV in highly fragmented forested regions in São Paulo state and highlight the importance of continued surveillance of zoonotic pathogens in sentinel species.


Conflict of interest statement

The authors have declared that no competing interests exist.

Figures

Fig 1
Fig 1. Distribution of weekly YFV cases.
A). NHP YFV positive confirmed cases per week. B). Choropleth map of São Paulo municipalities reporting positive NHP YFV cases during each outbreak phase. Shapefiles used to produce these maps are freely available from the Brazilian Institute of Geography and Statistics (IBGE) [42].
Fig 2
Fig 2. Choropleth map of the distribution of confirmed NHP cases per municipality in São Paulo state between July 2016 and February 2018.
Municipalities are shaded based on reporting and testing of NHPs. Circles depict locations of those cases from humans that were sequenced as part of this study, and red and orange triangles depict locations in São Paulo state from which NHP genome sequences were sequenced as part of this study. Eight samples from 7 municipalities in MG that form a clade with our sequences from São Paulo and that were sequenced by previous studies [8,43] are shown in purple triangles. Samples SA131 and Y37-244 are indicated. Shapefiles used to produce this maps are freely available from the Brazilian Institute of Geography and Statistics (IBGE) [42].
Fig 3
Fig 3. Maximum likelihood phylogenetic tree of YFV in Brazil.
Nodes with >50% bootstrap support are coloured dark blue, and bootstrap scores are provided for highly supported nodes (> = 75%). Sequences generated in this study have black tip labels (n = 51). One clade (previously denoted lineage YFVMG/ES/RJ [32]) is collapsed for clarity. This clade contains three sequences that were sampled from humans in São Paulo, but for all three cases patient travel histories indicate that YFV was acquired elsewhere. Samples SA131 and Y37-244 are indicated with an asterisk and discussed in the Discussion.
Fig 4
Fig 4. Reconstructed spatiotemporal diffusion of YFV in São Paulo.
Phylogenetic branches are mapped in space according to the location of phylogenetic nodes and tips (circles). Shaded regions coloured according to time show 80% highest posterior density contours calculated using bivariate kernel density estimation of the location of all nodes observed within defined 6-month time intervals in a subset of 1000 trees. Illustrated nodes are from the MCC tree and are coloured according to time. A) Spatiotemporal diffusion of taxa based on analysis of the full dataset (n = 99 sequences). B) Expansion of region highlighted in A without the long-distance outlier sequences. Shapefiles used to produce this map are available in the public domain from Natural Earth (https://www.naturalearthdata.com/).
Fig 5
Fig 5
Density of branch dispersal velocity in the entire (panel A) and restricted (panel B) datasets (see Fig 4). Branch dispersal velocities are natural log transformed. Each individual trace represents branch dispersal velocity density of one tree from the generated posterior distribution of phylogenetic trees.
Fig 6
Fig 6
Spatial wavefront distance from epidemic origin over time for all studied sequences (grey), and those in the restricted area shown in Fig 4B (green), as estimated with the “seraphim” package. The identified epizootic phases are indicated by bars in the upper right. Ribbons show 95% HPDs.

References

    1. Shearer FM, Moyes CL, Pigott DM, Brady OJ, Marinho F, Deshpande A, et al. Global yellow fever vaccination coverage from 1970 to 2016: an adjusted retrospective analysis. Lancet Infect Dis. 2017;17: 1209–1217. 10.1016/S1473-3099(17)30419-X - DOI - PMC - PubMed
    1. Monath TP, Vasconcelos PFC. Yellow fever. Journal of Clinical Virology. 2015;64: 160–173. 10.1016/j.jcv.2014.08.030 - DOI - PubMed
    1. Vasconcelos PFC, Sperb AF, Monteiro HAO, Torres MAN, Sousa MRS, Vasconcelos HB, et al. Isolations of yellow fever virus from Haemagogus leucocelaenus in Rio Grande do Sul State, Brazil. Transactions of the Royal Society of Tropical Medicine and Hygiene. 2003;97: 60–62. 10.1016/s0035-9203(03)90023-x - DOI - PubMed
    1. Vasconcelos PF da C. Yellow fever in Brazil: thoughts and hypotheses on the emergence in previously free areas. Revista de Saúde Pública. 2010;44: 1144–1149. 10.1590/s0034-89102010005000046 - DOI - PubMed
    1. Abreu FVS de, Ribeiro IP, Ferreira-de-Brito A, Santos AAC dos, Miranda RM de, Bonelly I de S, et al. Haemagogus leucocelaenus and Haemagogus janthinomys are the primary vectors in the major yellow fever outbreak in Brazil, 2016–2018. Emerging Microbes & Infections. 2019;8: 218–231. 10.1080/22221751.2019.1568180 - DOI - PMC - PubMed

Publication types

MeSH terms