Review
. 2020;216(5):100.
doi: 10.1007/s11214-020-00719-1. Epub 2020 Jul 23.

A Review of Possible Planetary Atmospheres in the TRAPPIST-1 System

Affiliations
Review

A Review of Possible Planetary Atmospheres in the TRAPPIST-1 System

Martin Turbet et al. Space Sci Rev. 2020.

Abstract

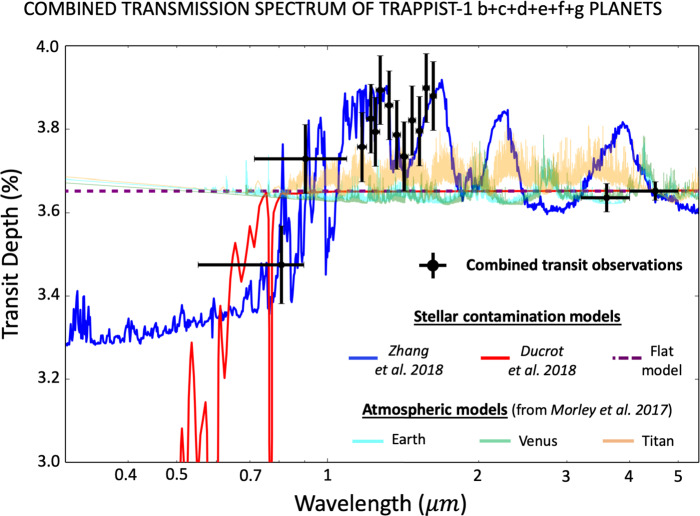
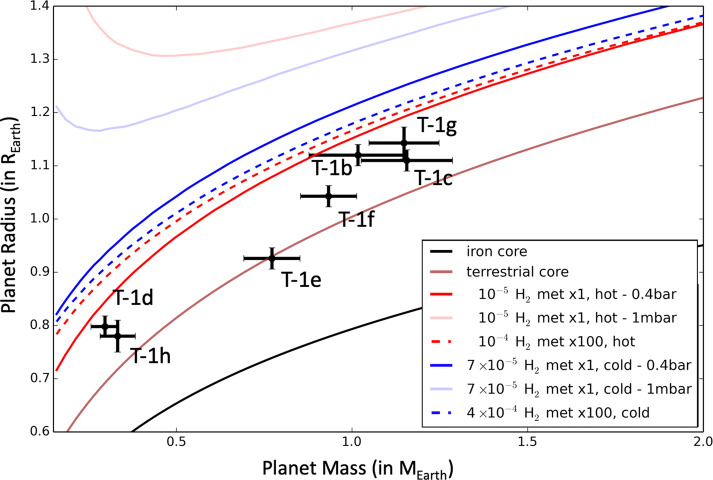
TRAPPIST-1 is a fantastic nearby (∼39.14 light years) planetary system made of at least seven transiting terrestrial-size, terrestrial-mass planets all receiving a moderate amount of irradiation. To date, this is the most observationally favourable system of potentially habitable planets known to exist. Since the announcement of the discovery of the TRAPPIST-1 planetary system in 2016, a growing number of techniques and approaches have been used and proposed to characterize its true nature. Here we have compiled a state-of-the-art overview of all the observational and theoretical constraints that have been obtained so far using these techniques and approaches. The goal is to get a better understanding of whether or not TRAPPIST-1 planets can have atmospheres, and if so, what they are made of. For this, we surveyed the literature on TRAPPIST-1 about topics as broad as irradiation environment, planet formation and migration, orbital stability, effects of tides and Transit Timing Variations, transit observations, stellar contamination, density measurements, and numerical climate and escape models. Each of these topics adds a brick to our understanding of the likely-or on the contrary unlikely-atmospheres of the seven known planets of the system. We show that (i) Hubble Space Telescope transit observations, (ii) bulk density measurements comparison with H2-rich planets mass-radius relationships, (iii) atmospheric escape modelling, and (iv) gas accretion modelling altogether offer solid evidence against the presence of hydrogen-dominated-cloud-free and cloudy-atmospheres around TRAPPIST-1 planets. This means that the planets are likely to have either (i) a high molecular weight atmosphere or (ii) no atmosphere at all. There are several key challenges ahead to characterize the bulk composition(s) of the atmospheres (if present) of TRAPPIST-1 planets. The main one so far is characterizing and correcting for the effects of stellar contamination. Fortunately, a new wave of observations with the James Webb Space Telescope and near-infrared high-resolution ground-based spectrographs on existing very large and forthcoming extremely large telescopes will bring significant advances in the coming decade.

Keywords: Atmospheres; Exoplanets; Review; TRAPPIST-1.


Figures

Fig. 1
Fig. 1
Architecture of the TRAPPIST-1 system and evolution of the runaway greenhouse/atmospheric collapse limit for water (a.k.a. the traditional inner edge of the Habitable Zone) and carbon dioxide. The spread of the runaway greenhouse/atmospheric collapse for water was calculated assuming a synchronous planet (i.e. at 1.4× the bolometric flux received on Earth; see Yang et al. .) and a non-synchronous planet (i.e. at 0.9× the bolometric flux received on Earth, using the results of the 1-D calculations of Kopparapu et al. 2013b,a). Note that the 1.4×F limit is a conservative estimate according to the results of Kopparapu et al. showing this threshold could vary depending on the metallicity of the host star, because the stellar mass-luminosity relationship depends on the metallicity, and thus does the rotation rate of the planet. Moreover, this runaway greenhouse estimate has been calculated assuming a cold start which is likely not a good approximation for planets orbiting such ultra-cool dwarfs, and that are thought to have started hot. The spread of the runaway greenhouse/atmospheric collapse for CO2 was calculated based on the results of Turbet et al. (2018) that the irradiation limit at which CO2 cannot accumulate in the atmosphere of TRAPPIST-1 planets is located between the orbit of TRAPPIST-1g and h. This result is discussed in more details in the Sect. 5.6 of the manuscript. These lines were drawn assuming a luminosity derived from evolutionary models for a 0.089 M M-dwarf (Van Grootel et al. 2018). For reference, we added the estimated age of 7.6±2.2 Gigayears based on Burgasser and Mamajek (2017). The figure was adapted from Bourrier et al. (2017a)
Fig. 2
Fig. 2
This figure shows irradiation spectra emitted by the star TRAPPIST-1 (red line) and the Sun (blue line). Both spectra were normalized to a total bolometric flux of 1366 W m−2, i.e. the mean irradiation received at the top of the atmosphere of present-day Earth. The solar spectrum (blue line) is the solar reference spectrum (SOLAR-ISS) taken from Meftah et al. (2018). The TRAPPIST-1 spectrum (red line) is calculated in Peacock et al. (2019) (scenario 1A). Black data points are described in the main text (Sect. 2.2)
Fig. 3
Fig. 3
Representation of the TRAPPIST-1 system viewed from above (left panel, figure adapted from Luger et al. 2017b) or seen edge-on with the seven planets transiting in front of their star (right panel; figure taken from Delrez et al. 2018)
Fig. 4
Fig. 4
Measured transit times of TRAPPIST-1c (with corresponding 1σ uncertainties) are indicated by coloured symbols, according to the origin of the data (Spitzer, K2 or other telescopes). The grey line indicates the spread of TTV fits obtained for one thousand distinct MCMC calculations samples (Grimm et al. 2018). The low-frequency TTV component is visible in the top panel, and the high-frequency (chopping) TTV component is visible in the bottom panel. A detailed list of all transits is given in the appendix of Grimm et al. (2018). This figure was adapted from Fig. 2 of Grimm et al. (2018), which also shows the TTVs of the 6 other planets in the system
Fig. 5
Fig. 5
This figure shows transit spectra (in Earth radius units) of the seven TRAPPIST-1 planets. These spectra were constructed using the transit depth measurements obtained with Spitzer (Gillon et al. ; Delrez et al. ; Ducrot et al. 2018, 2020), HST (de Wit et al. , ; Wakeford et al. 2019), K2 (Luger et al. ; Ducrot et al. 2018), SPECULOOS-South Observatory aka SSO and Liverpool telescope (Ducrot et al. 2018), VLT/HAWK-I, UKIRT and AAT (Burdanov et al. 2019). These transit depths were then converted into transit radii using the TRAPPIST-1 stellar radius estimate of Van Grootel et al. (2018), i.e. R=0.121R±0.003. The absolute error bars on the planetary radii due to the uncertainty on the radius of the star (about 2.5% according to Van Grootel et al. 2018) have not been applied here, because it is the relative uncertainties that are of interest here. Note that some of the transit observations (e.g. ground-based observations, HST/WFC3 observations) may not have a reliable absolute monochromatic baseline level (Ducrot et al. 2018, 2020)
Fig. 6
Fig. 6
Stellar contamination models fit to the K2+SPECULOOS-South+HST/WFC3+Spitzer/IRAC channels 1 and 2 (de Wit et al. ; Gillon et al. ; Luger et al. ; Delrez et al. ; de Wit et al. ; Ducrot et al. 2018, 2020) combined TRAPPIST-1 transmission spectra for planets b+c+d+e+f+g (black points and error bars, in transit depth % units). The blue stellar contamination spectrum (Zhang et al. 2018) corresponds to a three components model with (i) a photosphere (T=2400 K), (ii) hot faculae (T=3000 K) covering 50% of the projected stellar disk and cold spots (T=2000 K) covering 40% of it. The red stellar contamination spectrum (Morris et al. ; Ducrot et al. 2018) corresponds to a two-component model with (i) a photosphere (T=2500 K) and (ii) a few very bright spots (T=5300 K). The dashed purple stellar contamination spectrum corresponds to a flat model (i.e. no stellar contamination), which also corresponds to the best fit scenario in Wakeford et al. (2019). For each contamination spectrum, a small offset was added to ensure that each spectrum is compatible with the Spitzer/IRAC 4.5 μm transit measurement. Note that in the three contamination models (blue, red, and dashed purple lines), the signal (when fitted) is assumed to be fully stellar, i.e. no contribution from wavelength-dependent absorption by planetary atmospheres. The pale (i) cyan, (ii) green and (iii) orange lines correspond to combined synthetic transmission spectra from planetary atmospheres all made of (i) Earth-like, (ii) Venus-like and (iii) Titan-like compositions. These combined spectra were computed by summing the synthetic spectra of TRAPPIST-1b+c+d+e+f+g from Morley et al. (2017). They assume no stellar contamination
Fig. 7
Fig. 7
Mass-radius relationships for various interior compositions and hydrogen envelope masses. The mass-radius relationships for planets endowed with hydrogen envelopes were constructed (i) assuming a core of terrestrial composition (Zeng et al. 2016), (ii) endowed with a hydrogen envelope of 1x solar metallicity (solid lines) or 100x solar metallicity (dotted lines) for H2O and CH4. Red lines (and blue lines, respectively) indicate a scenario where the atmospheric temperature profile has been calculated in the irradiation condition of TRAPPIST-1b (of TRAPPIST-1h, respectively), hence the name ‘hot’ (and ‘cold’, respectively). All transit radii were computed assuming a transit pressure of 0.4 bar, which is a conservative assumption based on the results of Grimm et al. (2018) (Table 4). We also plotted the expected transit radii assuming a transit pressure at 1 mbar (pale red and blue lines). For comparison, we added the masses and radii of the seven TRAPPIST-1 planets measured from Grimm et al. (2018) and Ducrot et al. (2020), with their associated 1σ error bars. For reference, we also added a terrestrial composition (Zeng et al. 2016) that ressembles that of the Earth, and a pure iron core composition (Seager et al. 2007)
Fig. 8
Fig. 8
Mass-radius relationships for various interior compositions and water content, assuming water is in the condensed form (left panel) and water forms an atmosphere (right panel). The rocky composition mass-radius relationship assumes a pure MgSiO3 interior and was taken from Zeng et al. (2016). The water-rich mass-radius relationships for water in condensed form (left panel) were derived using the data from Zeng et al. (2016). The water-rich mass-radius relationships for water in gaseous form (right panel) were calculated in Turbet et al. (2020a). All mass-radius relationships with water were built assuming a pure MgSiO3 interior. For comparison, we added the measured positions of the seven TRAPPIST-1 planets measured from Grimm et al. (2018), Ducrot et al. (2020), with their associated 1σ error bars. Based on the irradiation they receive compared to the theoretical runaway greenhouse limit (see Fig. 7), TRAPPIST-1e, f, g and h should be compared with mass-radius relationships on the left, while TRAPPIST-1b, c and d should be compared with those on the right. To emphasize this, we indicated on each panel in black the planets (and their associated 1σ error bars) for which mass-radius relationships (with water) are appropriate. In contrast, we indicated on each panel in grey the planets (and their associated 1σ error bars) for which mass-radius relationships (with water) are not appropriate. For reference, we also added a terrestrial composition that ressembles that of the Earth. Note that mass-radius relationships for steam planets (right panel) can be easily built following the procedure described in Appendix D of Turbet et al. (2020a). The figure was adapted from Turbet et al. (2020a)
Fig. 9
Fig. 9
This diagram indicates the range of N2 and CO2 partial pressures for which TRAPPIST-1 planetary atmospheres are robust to CO2 surface condensation collapse (red regions) or not (blue regions). Each dot corresponds to the result of a 3-D Global Climate Model simulation. The black arrows indicate how planets that have an unstable atmosphere (due to CO2 surface condensation) would evolve on the diagram. Temperatures (in green) correspond to the rough estimate (based on GCM simulations) of the surface temperature of the coldest point of the planet, at the stable lower boundary (blue is up; red is down). The figure was taken from Turbet et al. (2018)
Fig. 10
Fig. 10
Surface contours for surface temperature, thermal emitted radiation at the top of the atmosphere (TOA) and reflected stellar radiation at TOA for “Hab1” scenario (i.e. a scenario of a planet with global ocean and an atmospheric bulk composition similar to present-day Earth) simulated by four of the state-of-the-art exoplanet GCMs: the UK Met Office United Model (UM) (Mayne et al. ; Boutle et al. 2017), the Laboratoire de Météorologie Dynamique Generic model (LMDG) (Wordsworth et al. ; Turbet et al. 2018), the Resolving Orbital and Climate Keys of Earth and Extraterrestrial Environments with Dynamics (ROCKE-3D) (Way et al. 2017), and the National Center for Atmospheric Research Community Atmosphere Model version 4 modified for exoplanets (ExoCAM) (Wolf and Toon ; Wolf 2017). The figure was taken from Fauchez et al. (2020b)
Fig. 11
Fig. 11
Synthetic transmission spectra simulated for TRAPPIST-1e at the spectral coverage and resolution of JWST NIRSpec and MIRI instruments. Each panel corresponds to a different composition, from top to bottom and left to right: a present-day Earth atmosphere, an Archean Earth (N2/CO2/CH4-dominated) atmosphere, a 1 bar CO2-dominated atmosphere and a 10 bar CO2-dominated atmosphere. While black lines indicate cloud-free transmission spectra, coloured lines take into account the effect of clouds, hazes, and both at the same time. The transmission spectra were computed using coupled 3-D Global Climate Model and 1-D photochemical climate model simulations. The figure was adapted from Fauchez et al. (2019)

References

    1. Agol E., Steffen J., Sari R., Clarkson W. On detecting terrestrial planets with timing of giant planet transits. Mon. Not. R. Astron. Soc. 2005;359:567–579.
    1. E. Agol et al., Planet. Sci. J. (2020, submitted for publication)
    1. Akeson R.L., Chen X., Ciardi D., Crane M., Good J., Harbut M., Jackson E., Kane S.R., Laity A.C., Leifer S., Lynn M., McElroy D.L., Papin M., Plavchan P., Ramírez S.V. The NASA exoplanet archive: data and tools for exoplanet research. Publ. Astron. Soc. Pac. 2013;125(930):989.
    1. Arney G., Domagal-Goldman S.D., Meadows V.S., Wolf E.T., Schwieterman E., Charnay B., Claire M., Hébrard E., Trainer M.G. The pale orange dot: the spectrum and habitability of hazy Archean Earth. Astrobiology. 2016;16:873–899. - PMC - PubMed
    1. Arney G.N., Meadows V.S., Domagal-Goldman S.D., Deming D., Robinson T.D., Tovar G., Wolf E.T., Schwieterman E. Pale orange dots: the impact of organic haze on the habitability and detectability of Earthlike exoplanets. Astrophys. J. 2017;836:49.

LinkOut - more resources