. 2020 Jul 12:13:2495-2504.
doi: 10.2147/DMSO.S260901. eCollection 2020.

(-)-Epigallocatechin-3-Gallate Inhibits eNOS Uncoupling and Alleviates High Glucose-Induced Dysfunction and Apoptosis of Human Umbilical Vein Endothelial Cells by PI3K/AKT/eNOS Pathway

Affiliations

(-)-Epigallocatechin-3-Gallate Inhibits eNOS Uncoupling and Alleviates High Glucose-Induced Dysfunction and Apoptosis of Human Umbilical Vein Endothelial Cells by PI3K/AKT/eNOS Pathway

Zhiyong Zhang et al. Diabetes Metab Syndr Obes. .

Erratum in

Abstract

Introduction: Diabetes can increase the risk of cardiovascular disease. This study aimed to explore the effect of (-)-epigallocatechin-3-gallate (EGCG) on high glucose (HG)-induced dysfunction and apoptosis of vascular endothelial cells.

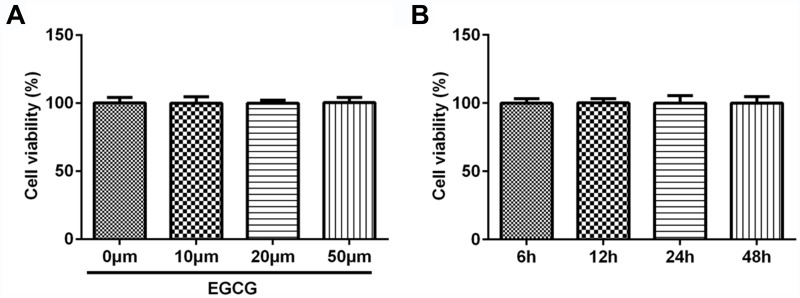
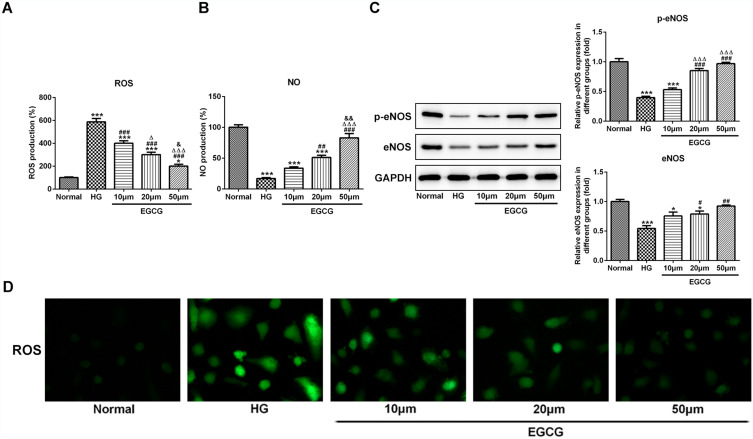
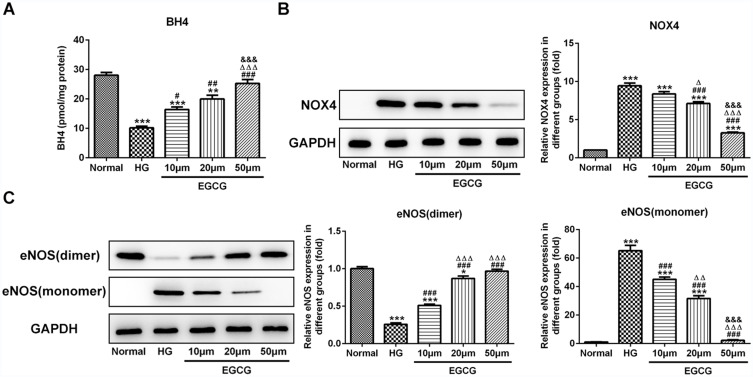
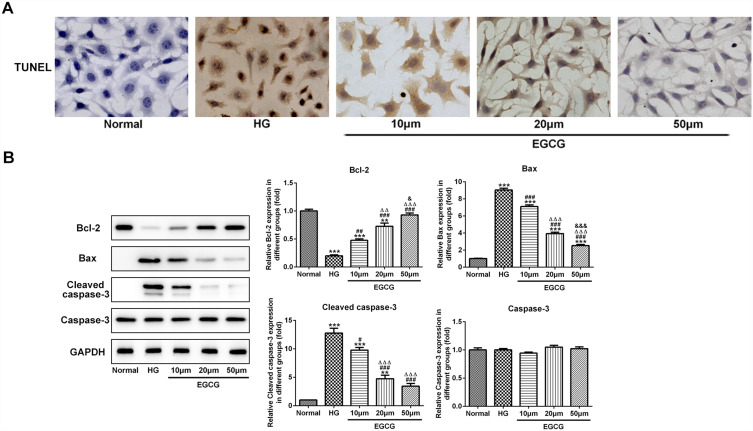
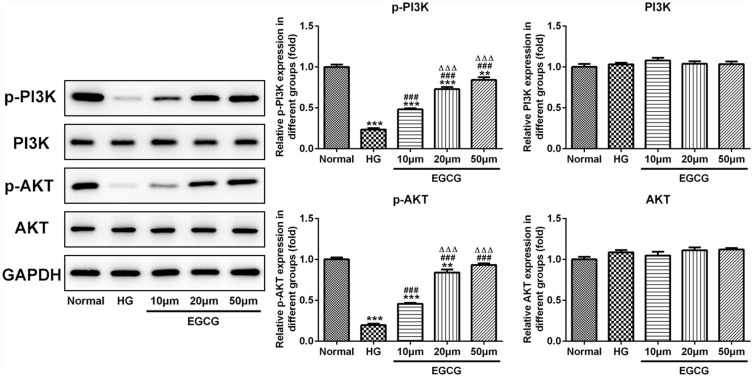
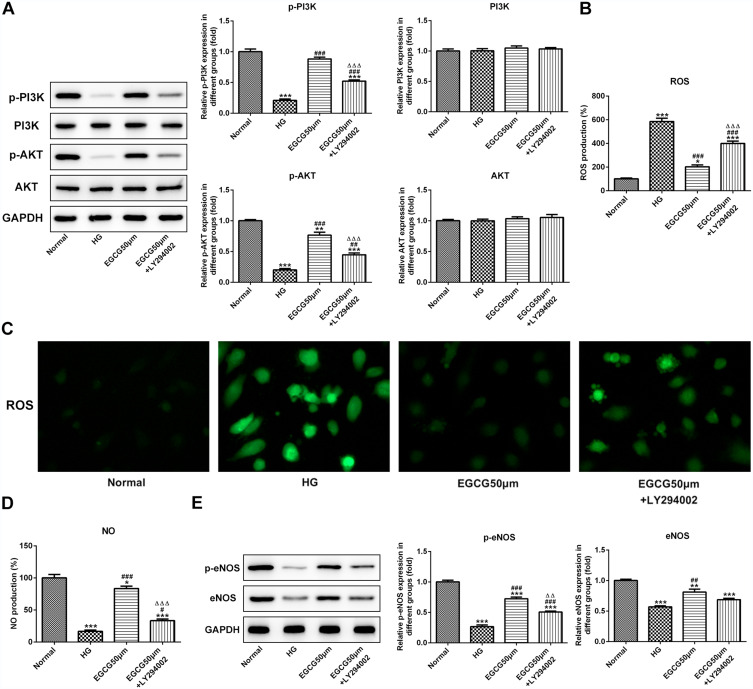
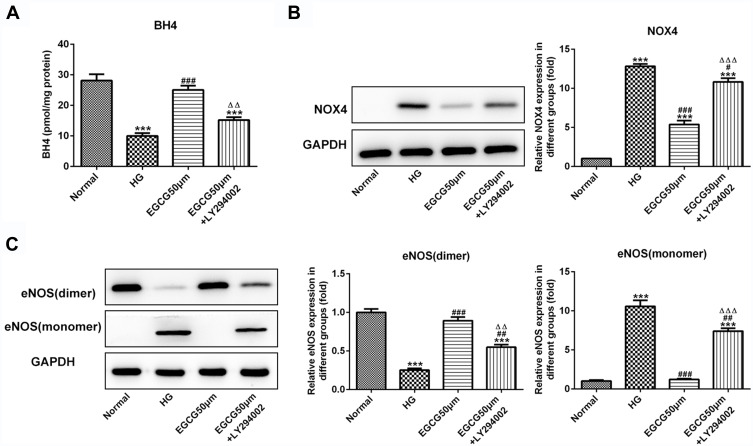
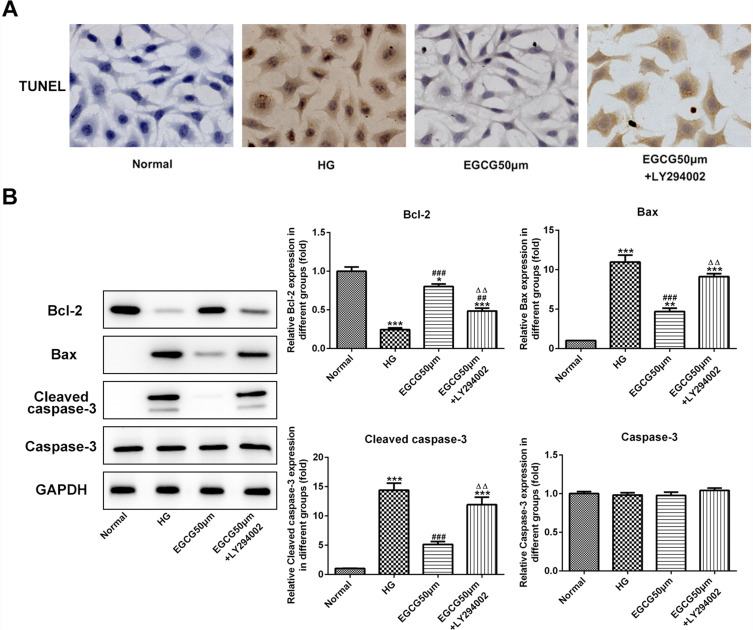
Materials and methods: The viability of human umbilical vein endothelial cells (HUVECs) treated with different concentrations and times of EGCG was detected by CCK-8 assay. The expression levels of ROS, NO and BH4 in HUVECs after treatment were detected by respective ELISA kits. The expression of p-eNOS, eNOS, NOX4, bcl2, bax, cleaved-caspase3, caspase3, p-PI3K, p-AKT, PI3K and AKT in HUVECs was detected by Western blot analysis. The apoptosis of HUVECs after treatment was analyzed by TUNEL assay.

Results: The viability of HUVECs was not obviously changed when treated with different concentrations and times of EGCG. The expression of ROS, NOX4 and eNOS (monomer) was increased, while the expression of NO, p-eNOS, eNOS, BH4 and eNOS (dimer) was decreased in HUVECs of HG group. EGCG could gradually reverse the effect of high glucose on HG-treated HUVECs from 10 μM to 50 μM. The apoptosis of HUVECs was also increased in HG group and EGCG decreased the apoptosis of HUVECs. PI3K/AKT signaling pathway was suppressed in HG-treated HUVECs while activated by EGCG treatment. When the PI3K/AKT signaling pathway was inhibited by LY294002 (AKT inhibitor), the protective effect of EGCG on HG-treated HUVECs was weakened.

Conclusion: EGCG could inhibit eNOS uncoupling and alleviate endothelial dysfunction and apoptosis of HG-treated HUVECs by activating the PI3K/AKT/eNOS pathway.

Keywords: (-)-epigallocatechin-3-gallate; apoptosis; eNOS uncoupling; endothelial dysfunction; human umbilical vein endothelial cells.


Conflict of interest statement

The authors declare they have no competing interests.

Figures

Figure 1
Figure 1
The viability of HUVECs was not affected by the different concentrations and times of EGCG. (A) The cell viability of HUVECs treated with different concentrations of EGCG was detected by CCK-8 assay. (B) The cell viability of HUVECs treated with 50 μM EGCG at different times was detected by CCK-8 assay.
Figure 2
Figure 2
EGCG alleviates endothelial dysfunction of hyperglycemia-induced vascular endothelial cells. (A) The ROS levels in HG-treated HUVECs affected by EGCG was detected by ROS ELISA assay. *P<0.05 and ***P<0.001 vs Normal group. ###P<0.001 vs HG group. P<0.05 and ∆∆∆P<0.001 vs EGCG10μM group. &P<0.05 vs EGCG20μM group. (B) The NO levels in HG-treated HUVECs affected by EGCG was detected by ROS ELISA assay. ***P<0.001 vs Normal group. ##P<0.01 and ###P<0.001 vs HG group. ∆∆∆P<0.001 vs EGCG10μM group. &&P<0.01 vs EGCG20μM group. (C) The expression of p-eNOS and eNOS in HG-treated HUVECs affected by EGCG was detected by Western blot analysis. *P<0.05 and ***P<0.001 vs Normal group. #P<0.05, ##P<0.01 and ###P<0.001 vs HG group. ∆∆∆P<0.001 vs EGCG10μM group. (D) The ROS levels in HG-treated HUVECs affected by EGCG was detected by fluorometric ROS assay.
Figure 3
Figure 3
EGCG increases the BH4 expression and inhibits the NOX4 expression and eNOS uncoupling. (A) The BH4 levels in HG-treated HUVECs affected by EGCG was determined by BH4 ELISA assay. **P<0.01 and ***P<0.001 vs Normal group. #P<0.05, ##P<0.01 and ###P<0.001 vs HG group. ∆∆∆P<0.001 vs EGCG10μM group. &&&P<0.001 vs EGCG20μM group. (B) The NOX4 expression in HG-treated HUVECs affected by EGCG was detected by Western blot analysis. ***P<0.001 vs Normal group. ###P<0.001 vs HG group. P<0.05 and ∆∆∆P<0.001 vs EGCG10μM group. &&&P<0.001 vs EGCG20μM group. (C) The expression of eNOS (dimer) and eNOS (monomer) in HG-treated HUVECs affected by EGCG was detected by Western blot analysis. *P<0.05 and ***P<0.001 vs Normal group. ###P<0.001 vs HG group. ∆∆P<0.01 and ∆∆∆P<0.001 vs EGCG10μM group. &&&P<0.001 vs EGCG20μM group.
Figure 4
Figure 4
EGCG alleviates the apoptosis of hyperglycemia-induced vascular endothelial cells. (A) The apoptosis of HG-treated HUVECs affected by EGCG was analyzed by TUNEL assay. (B) The expression of bcl2, bax, cleaved-caspase3 and caspase3 in HG-treated HUVECs affected by EGCG was detected by Western blot analysis. **P<0.01 and ***P<0.001 vs Normal group. #P<0.05, ##P<0.01 and ###P<0.001 vs HG group. ∆∆P<0.01 and ∆∆∆P<0.001 vs EGCG10μM group. &P<0.05 and &&&P<0.001 vs EGCG20μM group.
Figure 5
Figure 5
EGCG activates the PI3K/AKT pathway in hyperglycemia-induced vascular endothelial cells. The expression of P-PI3K, P-AKT, PI3K and AKT in HG-treated HUVECs affected by EGCG was detected by Western blot analysis. **P<0.01 and ***P<0.001 vs Normal group. ###P<0.001 vs HG group. ∆∆∆P<0.001 vs EGCG10μM group.
Figure 6
Figure 6
EGCG alleviates endothelial dysfunction of hyperglycemia-induced vascular endothelial cells by activating the PI3K/AKT pathway. (A) The expression of P-PI3K, P-AKT, PI3K and AKT in HG-treated HUVECs affected by EGCG and LY294002 was determined by Western blot analysis. **P<0.01 and ***P<0.001 vs Normal group. ##P<0.01 and ###P<0.001 vs HG group. ∆∆∆P<0.001 vs EGCG50μM group. (B) The ROS levels in HG-treated HUVECs affected by EGCG and LY294002 was detected by ROS ELISA assay. *P<0.05 and ***P<0.001 vs Normal group. ###P<0.001 vs HG group. ∆∆∆P<0.001 vs EGCG50μM group. (C) The ROS levels in HG-treated HUVECs affected by EGCG and LY294002 was detected by fluorometric ROS assay. (D) The NO levels in HG-treated HUVECs affected by EGCG and LY294002 was analyzed by ROS ELISA assay. *P<0.05 and ***P<0.001 vs Normal group. #P<0.05 and ###P<0.001 vs HG group. ∆∆∆P<0.001 vs EGCG50μM group. (E) The expression of p-eNOS and eNOS in HG-treated HUVECs affected by EGCG and LY294002 was determined by Western blot analysis. **P<0.01 and ***P<0.001 vs Normal group. ##P<0.01 and ###P<0.001 vs HG group. ∆∆P<0.01 vs EGCG50μM group.
Figure 7
Figure 7
EGCG increases the BH4 expression and inhibits the NOX4 expression and eNOS uncoupling by activating the PI3K/AKT pathway. (A) The BH4 levels in HG-treated HUVECs affected by EGCG and LY294002 was detected by BH4 ELISA assay. ***P<0.001 vs Normal group. ###P<0.001 vs HG group. ∆∆P<0.01 vs EGCG50μM group. (B) The NOX4 expression in HG-treated HUVECs affected by EGCG and LY294002 was determined by Western blot analysis. ***P<0.001 vs Normal group. #P<0.05 and ###P<0.001 vs HG group. ∆∆∆P<0.001 vs EGCG50μM group. (C) The expression of eNOS (dimer) and eNOS (monomer) in HG-treated HUVECs affected by EGCG and LY294002 was determined by Western blot analysis. ***P<0.001 vs Normal group. ##P<0.01 and ###P<0.001 vs HG group. ∆∆P<0.01 and ∆∆∆P<0.001 vs EGCG50μM group.
Figure 8
Figure 8
EGCG alleviates the apoptosis of hyperglycemia-induced vascular endothelial cells by activating the PI3K/AKT pathway. (A) The apoptosis of HG-treated HUVECs affected by EGCG and LY294002 was analyzed by TUNEL assay. (B) The expression of bcl2, bax, cleaved-caspase3 and caspase3 in HG-treated HUVECs affected by EGCG and LY294002 was detected by Western blot analysis. *P<0.05, **P<0.01 and ***P<0.001 vs Normal group. ##P<0.01 and ###P<0.001 vs HG group. ∆∆P<0.01 vs EGCG50μM group.

References

    1. Grundy SM, Benjamin IJ, Burke GL, et al. Diabetes and cardiovascular disease - A statement for healthcare professionals from the American heart association. Circulation. 1999;100(10):1134–1146. doi:10.1161/01.CIR.100.10.1134 - DOI - PubMed
    1. Matheus ASD, Tannus LRM, Cobas RA, Palma CCS, Negrato CA, Gomes MD. Impact of diabetes on cardiovascular disease: an update. Int J Hypertens. 2013;2013:1–15. doi:10.1155/2013/653789 - DOI - PMC - PubMed
    1. Favard C, Ortega N, Bayard F, Plouet J. Vascular endothelial growth factor and retinal neovascularisation: a new therapeutic approach for diabetic retinopathy. Diabetes Metab. 1996;22:268–273. - PubMed
    1. Lee IG, Chae SL, Kim JC. Involvement of circulating endothelial progenitor cells and vasculogenic factors in the pathogenesis of diabetic retinopathy. Eye. 2006;20(5):546–552. doi:10.1038/sj.eye.6701920 - DOI - PubMed
    1. Avogaro A, Albiero M, Menegazzo L, de Kreutzenberg S, Fadini GP. Endothelial dysfunction in diabetes the role of reparatory mechanisms. Diabetes Care. 2011;34:S285–S290. doi:10.2337/dc11-s239 - DOI - PMC - PubMed