. 2020 Jun 19;12(4):plaa028.
doi: 10.1093/aobpla/plaa028. eCollection 2020 Aug.

High leaf mass per area Oryza genotypes invest more leaf mass to cell wall and show a low mesophyll conductance

Affiliations

High leaf mass per area Oryza genotypes invest more leaf mass to cell wall and show a low mesophyll conductance

Miao Ye et al. AoB Plants. .

Abstract

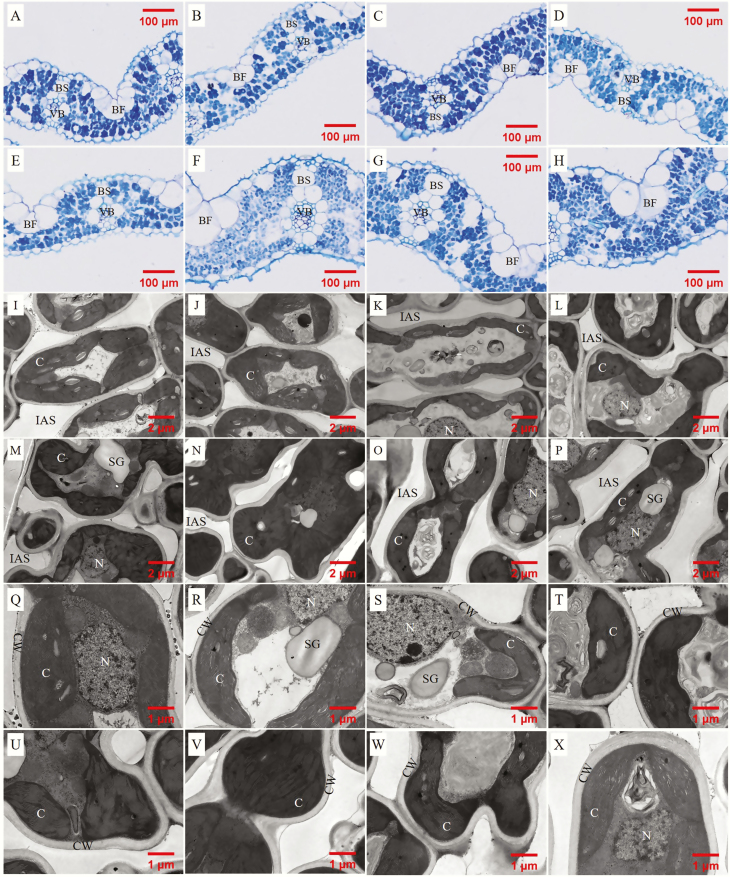
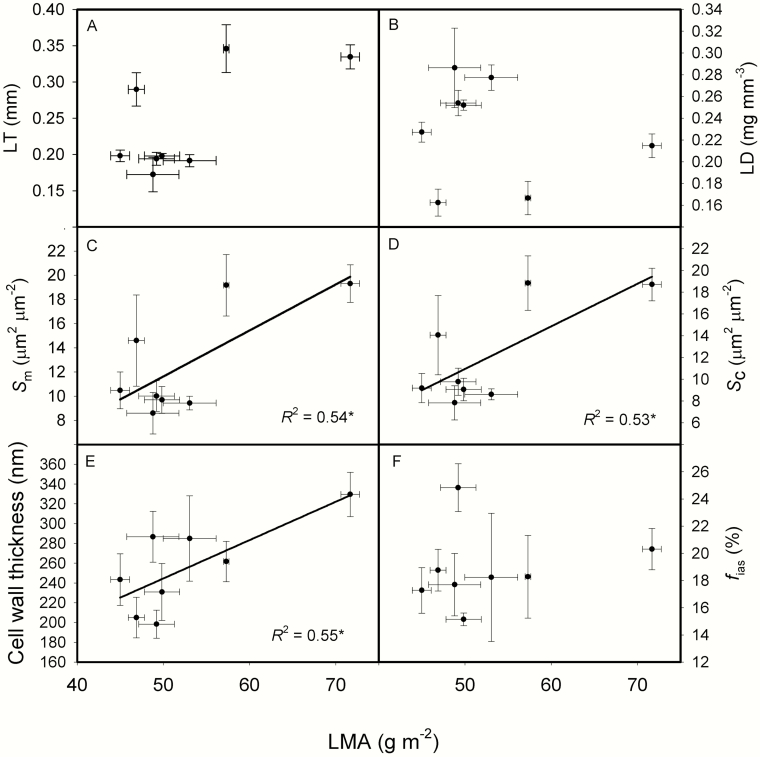
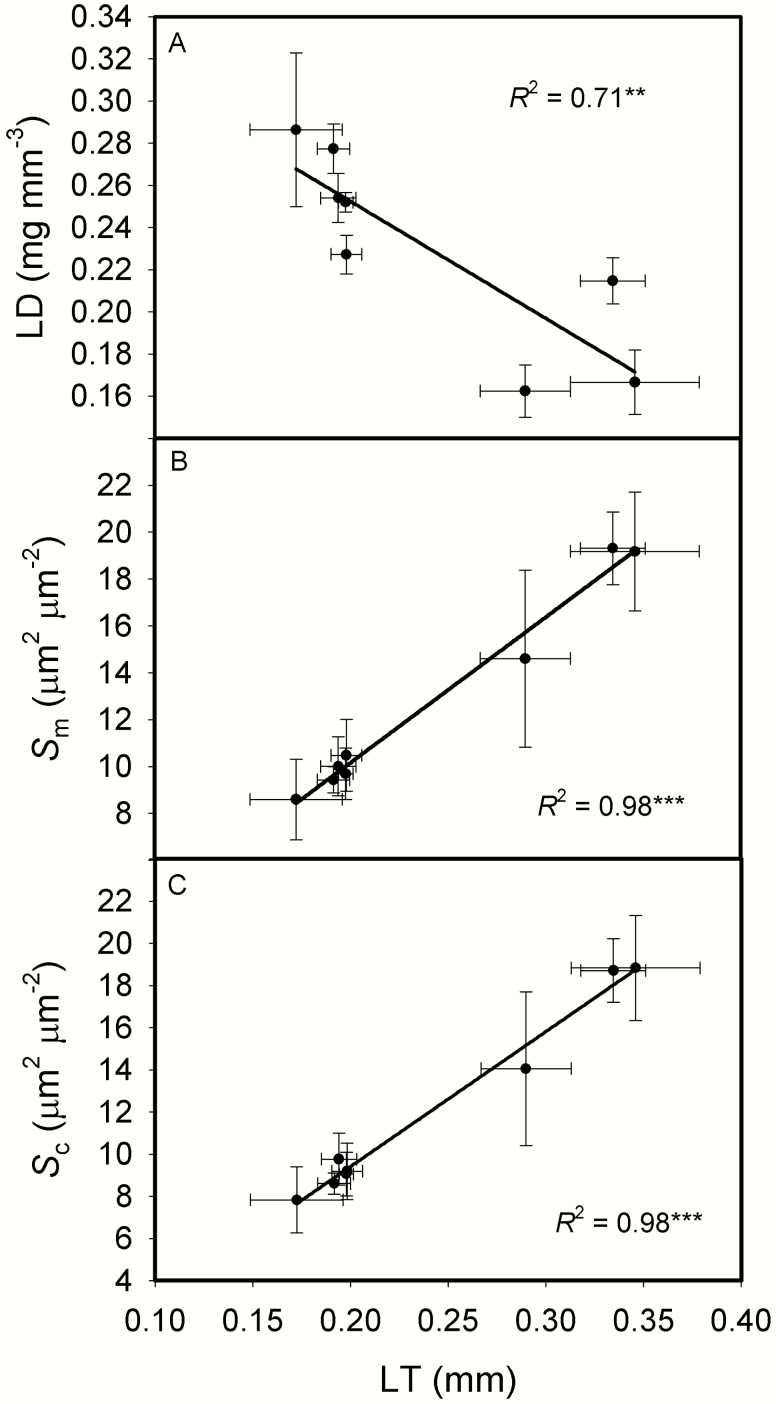
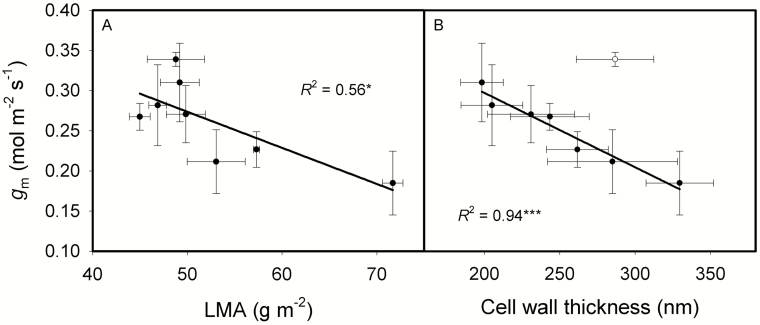
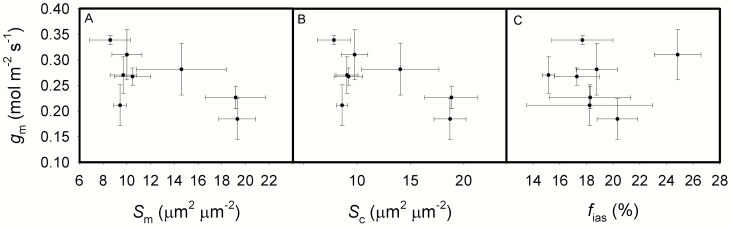
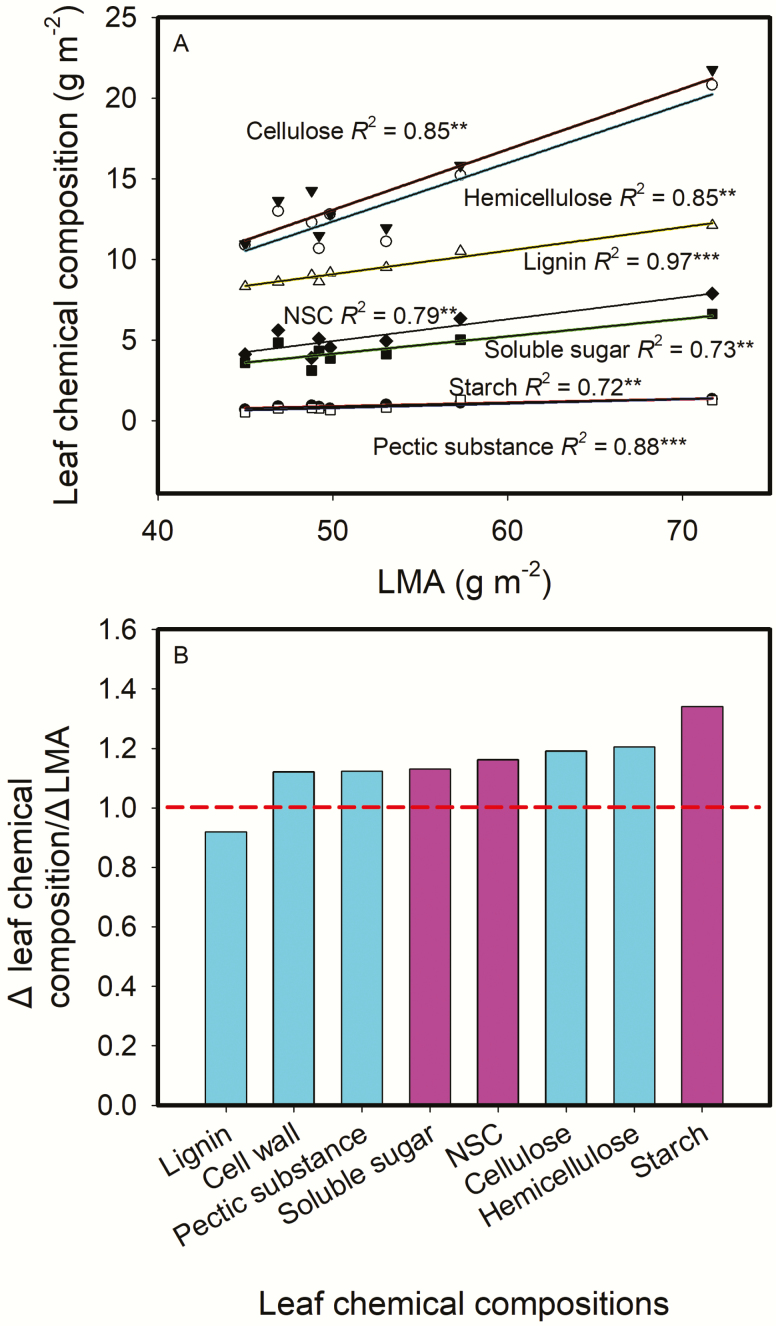
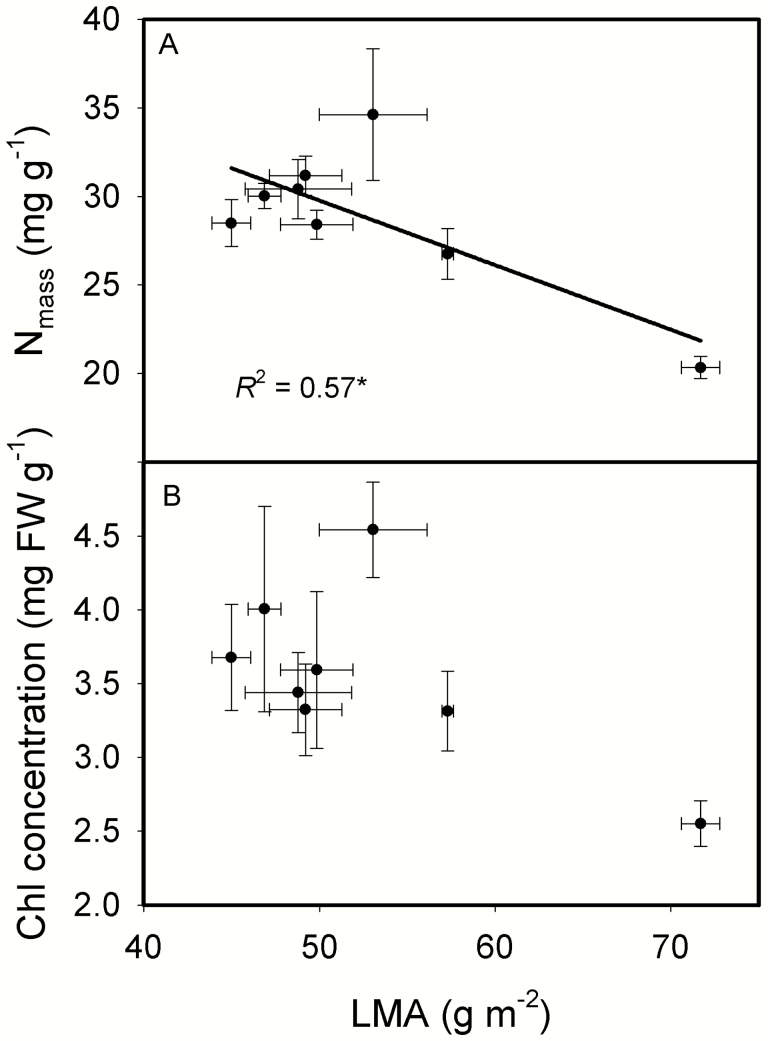
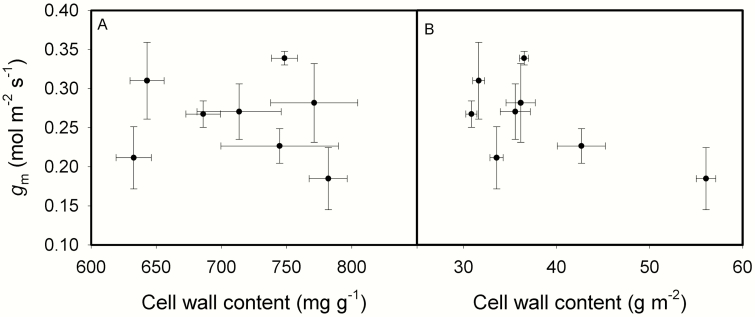
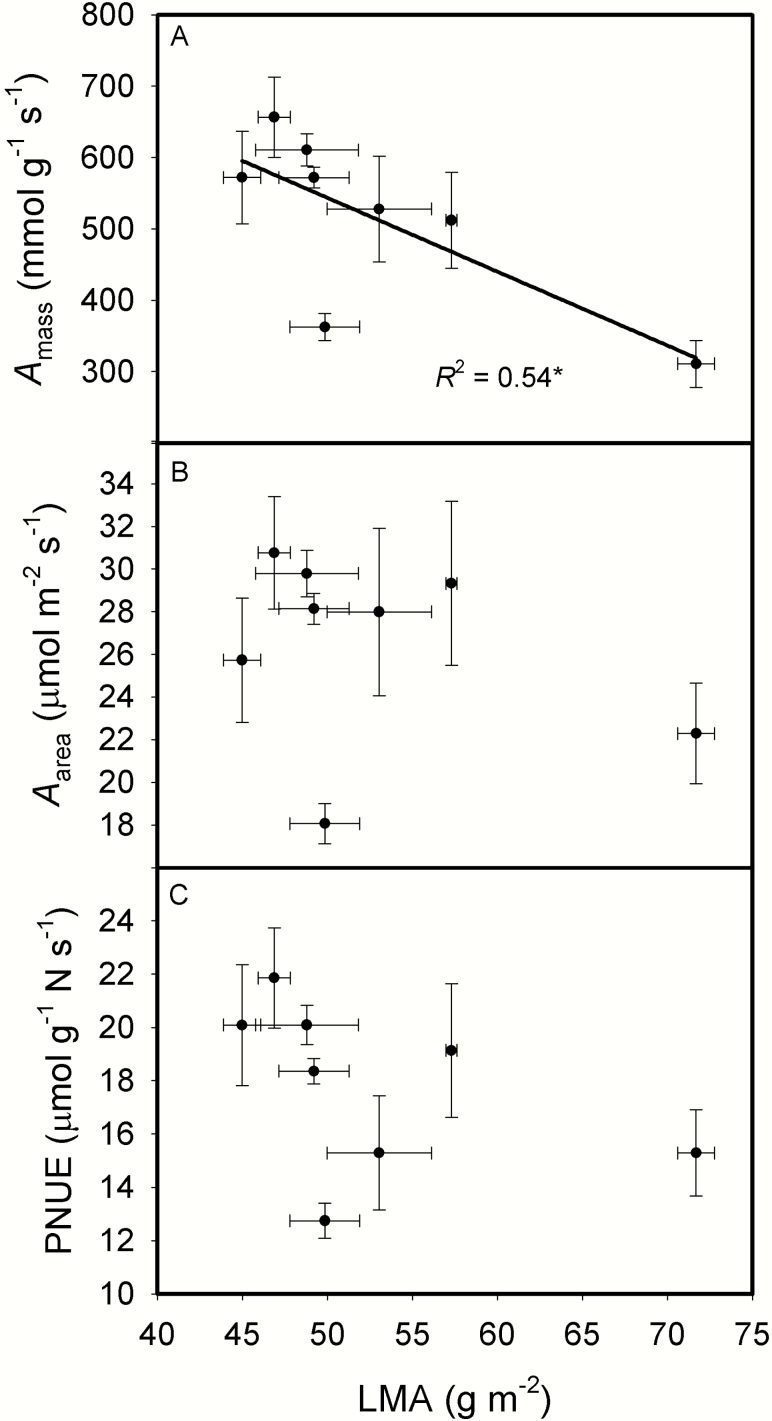
The intraspecific variations of leaf structure and anatomy in rice leaves and their impacts on gas diffusion are still unknown. Researches about the tradeoff between structural compositions and intracellular chemical components within rice leaves are still lacking. The objectives of the present study were to investigate the varietal differences in leaf structure and leaf chemical compositions, and the tradeoff between leaf structural tissues and intracellular chemical components in rice leaves. Leaf structure, leaf anatomy, leaf chemical composition concentrations and gas exchange parameters were measured on eight Oryza sativa L. genotypes to investigate the intraspecific variations in leaf structure and leaf anatomy and their impacts on gas exchange parameters, and to study the tradeoff between leaf structural compositions (cell wall compounds) and intracellular chemical components (non-structural carbohydrates, nitrogen, chlorophyll). Leaf thickness increased with leaf mass per area (LMA), while leaf density did not correlate with LMA. Mesophyll cell surface area exposed to intercellular airspace (IAS) per leaf area, the surface area of chloroplasts exposed to IAS and cell wall thickness increased with LMA. Cell wall compounds accounted for 71.5 % of leaf dry mass, while mass-based nitrogen and chlorophyll concentrations decreased with LMA. Mesophyll conductance was negatively correlated with LMA and cell wall thickness. High LMA rice genotypes invest more leaf mass to cell wall and possess a low mesophyll conductance.

Keywords: Cell wall; Oryza sativa L; leaf anatomy; leaf chemical compositions; leaf mass per area; tradeoff.


Figures

Fig. 1.
Fig. 1.
Light (A, B, C, D, E, F, G, H) and transmission electron (1700× (I, J, K, L, M, N, O, P), 3500× (Q, R, S, T, U, V, W, X)) microscope images of leaves detached from Sab Ini, Nucleoryza, Champa, Kirmizi Celtik, Huayou 675, Huanghuazhan, Teqing and Yongyou 12, respectively. IAS, intercellular air space; CW, cell wall; C, chloroplast.
Fig. 2.
Fig. 2.
The relationships between leaf mass per area (LMA) and leaf thickness (LT, A), leaf density (LD, B), the surface area of mesophyll cells exposed to intercellular airspaces per leaf area (Sm, C), the surface area of chloroplasts exposed to intercellular airspaces per leaf area (Sc, D), cell wall thickness (CWT, E) and the fraction of intercellular airspaces (fias, F) across the eight rice genotypes. Data are means ± SD of three replicates for LMA, LT, LD, Sm, Sc and fias. CWT of each genotype was measured with 5–13 pictures, and one mesophyll cell was measured in each image. *P < 0.05; **P < 0.01; ***P < 0.001.
Fig. 3.
Fig. 3.
The relationships between leaf thickness (LT) and leaf density (LD, A), the surface area of mesophyll cells exposed to intercellular airspaces per leaf area (Sm, B), the surface area of chloroplasts exposed to intercellular airspaces per leaf area (Sc, C) across the eight rice genotypes. Data are means ± SD of three replicates. *P < 0.05; **P < 0.01; ***P < 0.001.
Fig. 4.
Fig. 4.
The relationships between mesophyll conductance (gm) and leaf mass per area (LMA, A), cell wall thickness (B) across the eight rice genotypes. Data are means ± SD of three replicates for gm and LMA. Cell wall thickness of each genotype was measured with 5-13 pictures, and one mesophyll cell was measured in each picture. *P < 0.05; **P < 0.01; ***P < 0.001.
Fig. 5.
Fig. 5.
The relationships between mesophyll conductance (gm) and the mesophyll cells surface area exposed to intercellular airspaces per leaf area (Sm, A), the surface area of chloroplasts exposed to intercellular airspaces per leaf area (Sc, B), the fraction of intercellular airspaces (fias, C) across the eight rice genotypes. Data are means ± SD of three replicates. *P < 0.05; **P < 0.01; ***P < 0.001.
Fig. 6.
Fig. 6.
Relationships between leaf chemical compositions (based on leaf area) and leaf mass per area (LMA) across the eight rice genotypes (A), and the ratio of Δleaf chemical composition to ΔLMA (B). ΔLMA was calculated as the ratio of the maximum to the minimum LMA across the tested rice genotypes. The obtained regression equations in (A) were used to calculate leaf chemical compositions with the maximum and the minimum LMA, respectively, and Δ leaf chemical composition was calculated as the ratio of the maximum to the minimum leaf chemical compositions. Data are means of three replicates in (A). *P < 0.05; **P < 0.01; ***P < 0.001.
Fig. 7.
Fig. 7.
The relationships between leaf mass per area (LMA) and leaf N content based on leaf mass (Nmass, A), leaf chlorophyll content based on leaf mass (B) across the eight rice genotypes. Data are means ± SD of three replicates. *P < 0.05; **P < 0.01; ***P < 0.001.
Fig. 8.
Fig. 8.
The relationships between mesophyll conductance (gm) and mass-based cell wall content (A) and area-based cell wall content (B) across the eight rice genotypes. Data are means ± SD of three replicates.
Fig. 9.
Fig. 9.
The relationships between leaf mass per area (LMA) and mass-based net photosynthetic rate (Amass, A), area-based net photosynthetic rate (Aarea, B) and photosynthetic nitrogen use efficiency (PNUE, C) across the eight rice genotypes. Data are means ± SD of three replicates. *P < 0.05; **P < 0.01; ***P < 0.001.

References

    1. Adachi S, Nakae T, Uchida M, Soda K, Takai T, Oi T, Yamamoto T, Ookawa T, Miyake H, Yano M, Hirasawa T. 2013. The mesophyll anatomy enhancing CO2 diffusion is a key trait for improving rice photosynthesis. Journal of Experimental Botany 64:1061–1072. - PubMed
    1. Brooks A, Farquhar GD. 1985. Effect of temperature on the CO2/O2 specificity of ribulose-1,5-bisphosphate carboxylase/oxygenase and the rate of respiration in the light: estimates from gas-exchange measurements on spinach. Planta 165:397–406. - PubMed
    1. Castro-Díez P, Puyravaud JP, Cornelissen JH. 2000. Leaf structure and anatomy as related to leaf mass per area variation in seedlings of a wide range of woody plant species and types. Oecologia 124:476–486. - PubMed
    1. Choong MF, Lucas PW, Ong JSY, Pereira B, Tan HTW, Turner IM. 1992. Leaf fracture toughness and sclerophylly: their correlations and ecological implications. New Phytologist 121:597–610.
    1. Coley PD. 1983. Herbivory and defensive characteristics of tree species in a low land tropical forest. Ecological Monographs 53:209–233.