. 2020 Jul 22;6(30):eabb1708.
doi: 10.1126/sciadv.abb1708. eCollection 2020 Jul.

Enabling the assessment of trauma-induced hemorrhage via smart wearable systems

Affiliations

Enabling the assessment of trauma-induced hemorrhage via smart wearable systems

Jonathan Zia et al. Sci Adv. .

Abstract

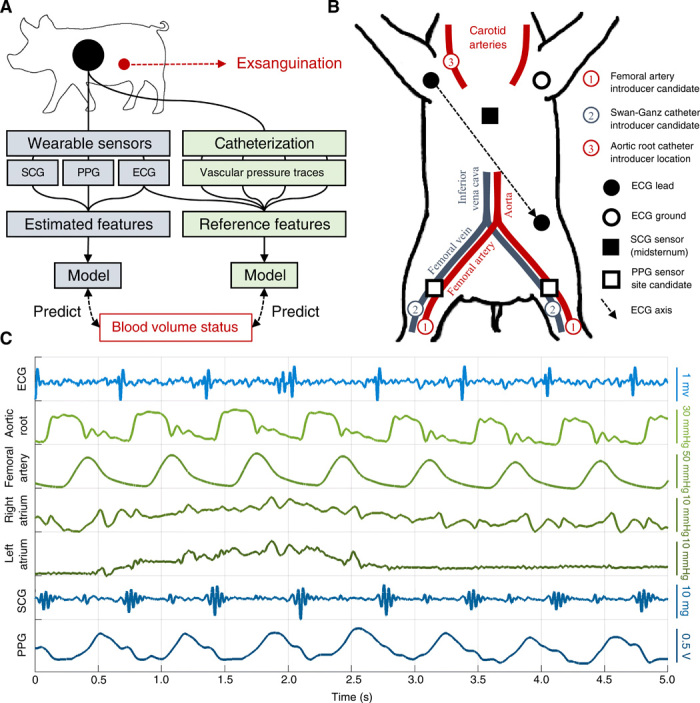
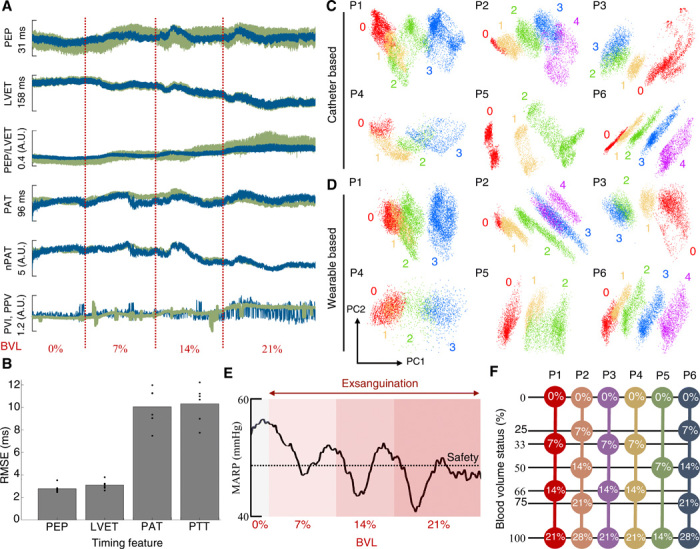
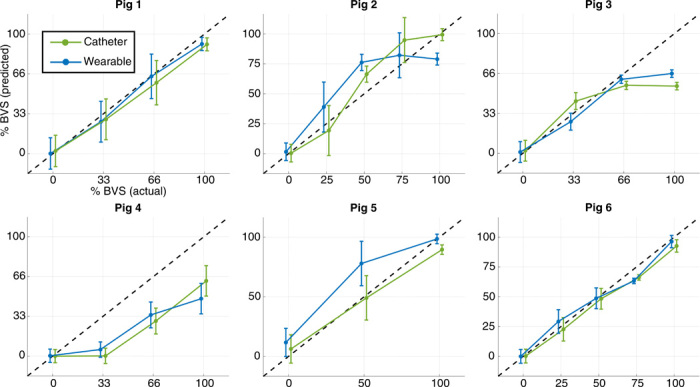
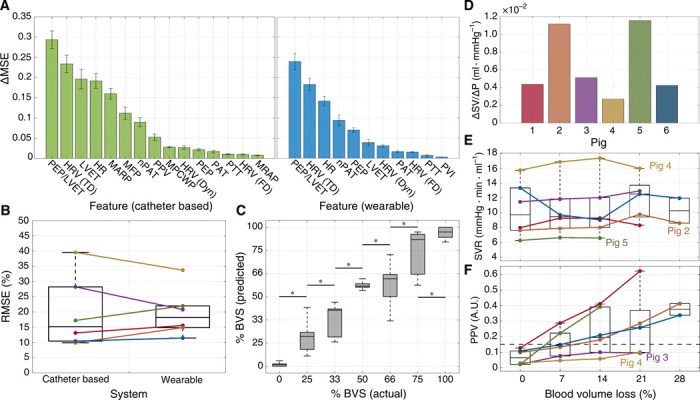
As the leading cause of trauma-related mortality, blood loss due to hemorrhage is notoriously difficult to triage and manage. To enable timely and appropriate care for patients with trauma, this work elucidates the externally measurable physiological features of exsanguination, which were used to develop a globalized model for assessing blood volume status (BVS) or the relative severity of blood loss. These features were captured via both a multimodal wearable system and a catheter-based reference and used to accurately infer BVS in a porcine model of hemorrhage (n = 6). Ultimately, high-level features of cardiomechanical function were shown to strongly predict progression toward cardiovascular collapse and used to estimate BVS with a median error of 15.17 and 18.17% for the catheter-based and wearable systems, respectively. Exploring the nexus of biomedical theory and practice, these findings lay the groundwork for digital biomarkers of hemorrhage severity and warrant further study in human subjects.


Figures

Fig. 1
Fig. 1. Overview of methods and data.
(A) Overall method used in this work. A wearable sensing system (blue) was used to develop a globalized model of BVS assessment, which was then compared with a catheter-based gold standard system (green). The catheter-based system directly measured aortic root, femoral artery, right atrial, and left atrial (via pulmonary capillary wedge) pressures. (B) Diagram of sensor placement during experiment. Each catheter was placed in one of the indicated candidate locations for each subject depending on artery and vein accessibility. The photoplethysmogram (PPG) sensor was then placed on the most accessible femoral artery branch. (C) Example traces obtained from wearable- (blue) and catheter-based (green) sensors during a single respiration cycle.
Fig. 2
Fig. 2. Physiological features during exsanguination.
(A) Example features derived from catheter-based (green) and wearable (blue) sensors during the experimental protocol for pig 1. All features were mean centered over the recording session for visualization. Features are plotted against blood volume loss (BVL), with the red dotted lines indicating the onset of each blood draw. nPAT, normalized PAT. (B) Error of timing features calculated from wearable-based signals with respect to the catheter-based reference. Overlaid scatter points represent individual animals. (C) Results of performing principal components analysis (PCA) on all catheter-based features from Table 1 over the recording session for pigs 1 to 6, respectively. Number labels represent the BVL corresponding to each data point: 0% (0), 7% (1), 14% (2), 21% (3), and 28% (4). (D) Results of PCA on all wearable-based features from Table 1 for pigs 1 to 6, respectively. (E) Heartbeat-by-heartbeat MAP for pig 1 over the experimental protocol. Progressive BVL is indicated by red shading, and the 20% safety threshold is overlaid (black, dotted). (F) Graphical representation of BVS calculation from raw BVL for each animal. PN, pig N; RMSE, root mean square error; A.U., arbitrary units. Detailed explanation is provided in the text.
Fig. 3
Fig. 3. BVS prediction results.
Results of performing random forest regression with cross-validation to predict BVS for each of the animals. Separate models were trained for this task using the catheter-based (green) and wearable (blue) systems. SD bars are shown for predicted BVS at each level; the 1:1 correspondence line between actual and predicted BVS is overlaid (black, dashed).
Fig. 4
Fig. 4. Analysis of physiological features during exsanguination.
(A) Feature importance for catheter-based (green) and wearable (blue) systems during random forest regression. SD error bars are shown. (B) RMSE between ground truth and estimated BVS using random forest regression (from Fig. 3). Colors for all figures correspond to the labeling in (D). (C) Actual versus predicted BVS aggregated across all animal subjects for the wearable system. Boxes denote the 25th to 75th percentile range, and whiskers denote the 5th to 95th percentiles. Asterisks indicate significant separation (P < 0.05) between the levels as determined by a Mann-Whitney U test. (D) Slope of linear fit between stroke volume (SV) and preload. (E) Average systemic vascular resistance (SVR) computed at each level of BVL. (F) Average PPV computed at each level of BVL. A reference line at 0.15 is overlaid (black, dashed). MSE, mean square error.

References

    1. Eastridge B. J., Hardin M., Cantrell J., Oetjen-Gerdes L., Zubko T., Mallak C., Wade C. E., Simmons J., Mace J., Mabry R., Bolenbaucher R., Blackbourne L. H., Died of wounds on the battlefield: Causation and implications for improving combat casualty care. J. Trauma 71, S4–S8 (2011). - PubMed
    1. Champion H. R., Bellamy R. F., Roberts C. P., Leppaniemi A., A profile of combat injury. J. Trauma 54, S13–S19 (2003). - PubMed
    1. Convertino V. A., Grudic G., Mulligan J., Moulton S., Estimation of individual-specific progression to impending cardiovascular instability using arterial waveforms. J. Appl. Physiol. 115, 1196–1202 (2013). - PubMed
    1. Schlotman T. E., Lehnhardt K. R., Abercromby A. F., Easter B. D., Downs M. E., Akers L. T. C. K. S., Convertino V. A., Bridging the gap between military prolonged field care monitoring and exploration spaceflight: The compensatory reserve. NPJ Microgravity 5, 29 (2019). - PMC - PubMed
    1. Acharya U. R., Joseph K. P., Kannathal N., Lim C. M., Suri J. S., Heart rate variability: A review. Med. Biol. Eng. Comput. 44, 1031–1051 (2006). - PubMed

Publication types