. 2020 Aug 28;40(8):BSR20201555.
doi: 10.1042/BSR20201555.

Identification of key genes of papillary thyroid carcinoma by integrated bioinformatics analysis

Affiliations

Identification of key genes of papillary thyroid carcinoma by integrated bioinformatics analysis

Gang Xue et al. Biosci Rep. .

Abstract

Background: Papillary thyroid carcinoma (PTC) is one of the fastest-growing malignant tumor types of thyroid cancer. Therefore, identifying the interaction of genes in PTC is crucial for elucidating its pathogenesis and finding more specific molecular biomarkers.

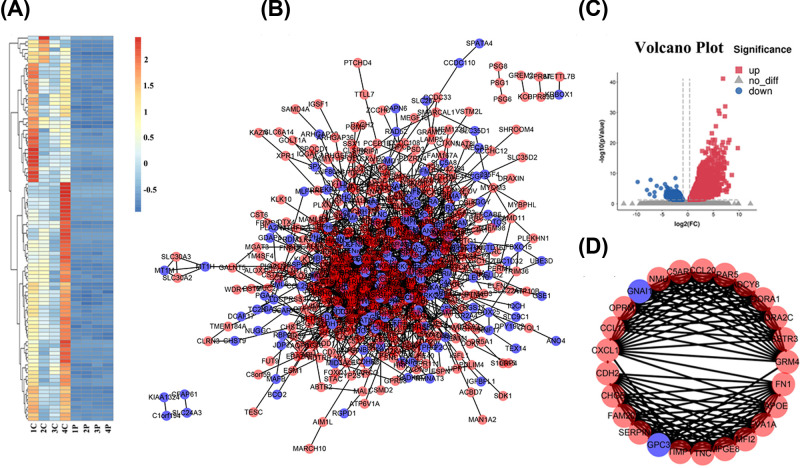
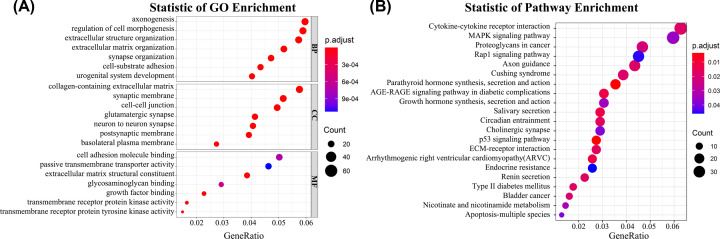
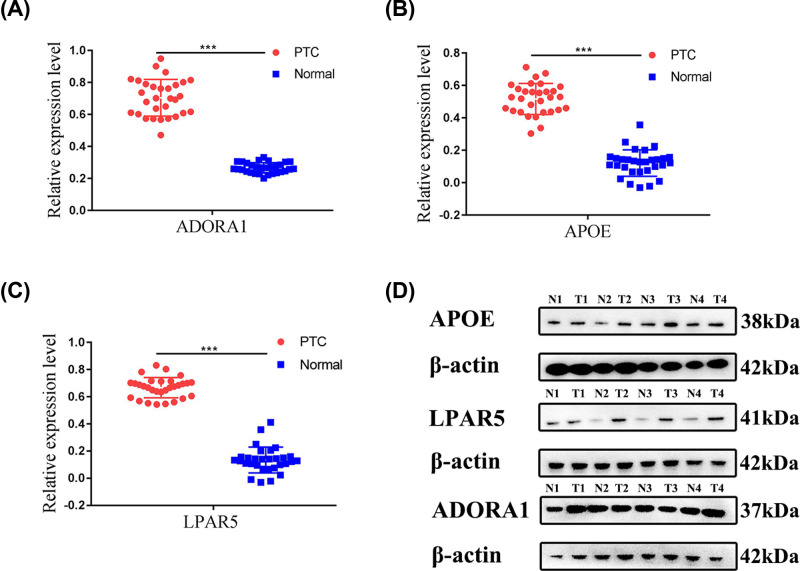
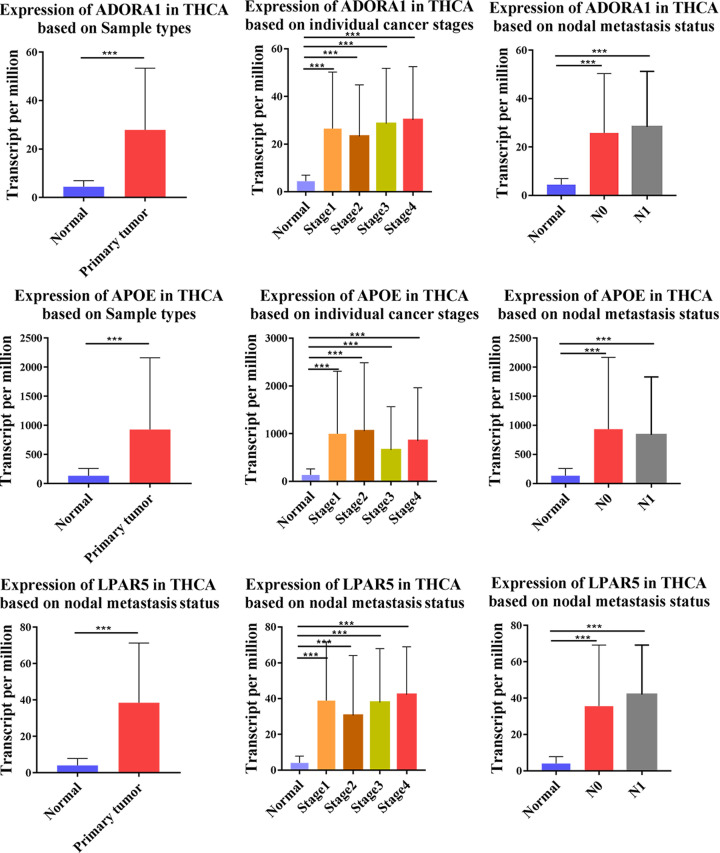
Methods: Four pairs of PTC tissues and adjacent tissues were sequenced using RNA-Seq, and 3745 differentially expressed genes were screened (P<0.05, |logFC|>1). The enrichment analysis indicated that the vast majority of differentially expressed genes (DEGs) may play a positive role in the development of cancer. Then, the significant modules were analyzed using Cytoscape software in the protein-protein interaction network. Survival analysis, TNM analysis, and immune infiltration analysis of key genes were analyzed. And the expression of ADORA1, APOE, and LPAR5 genes were verified by qPCR in PTC compared with matching adjacent tissues.

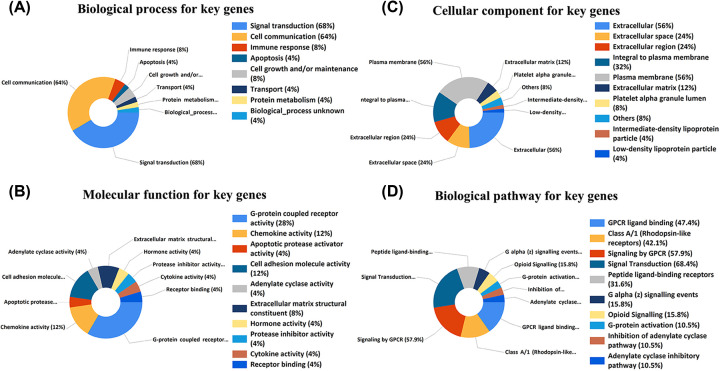
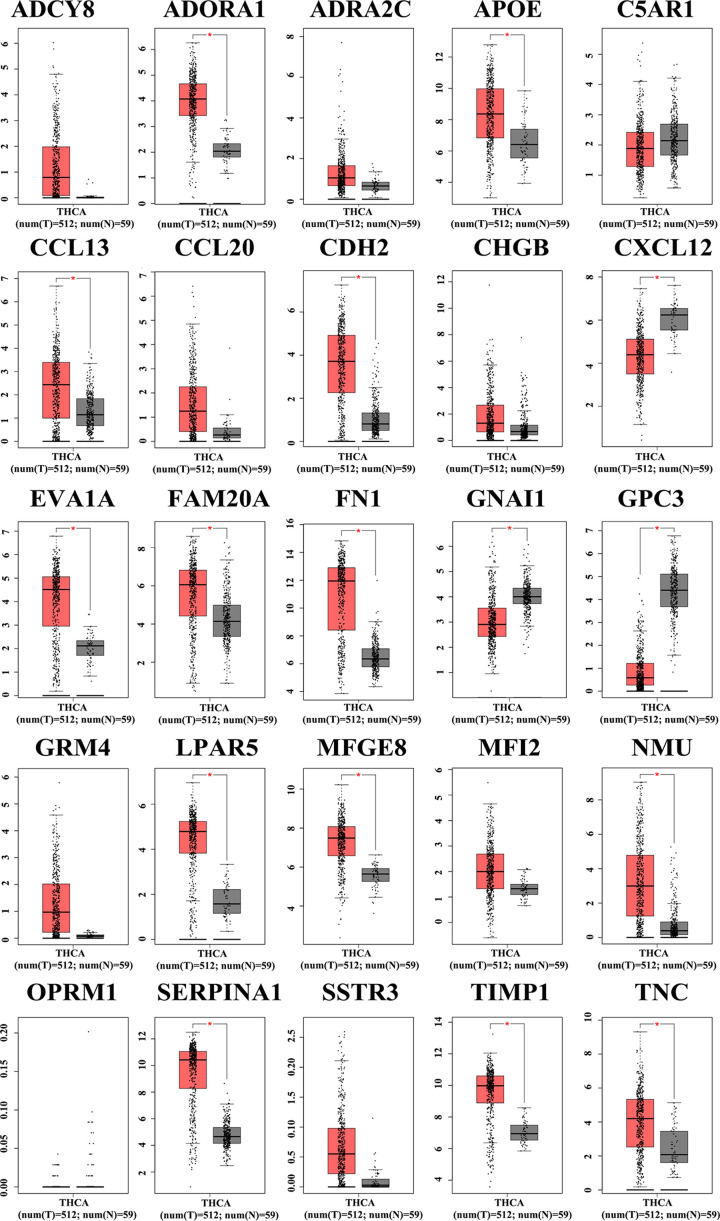
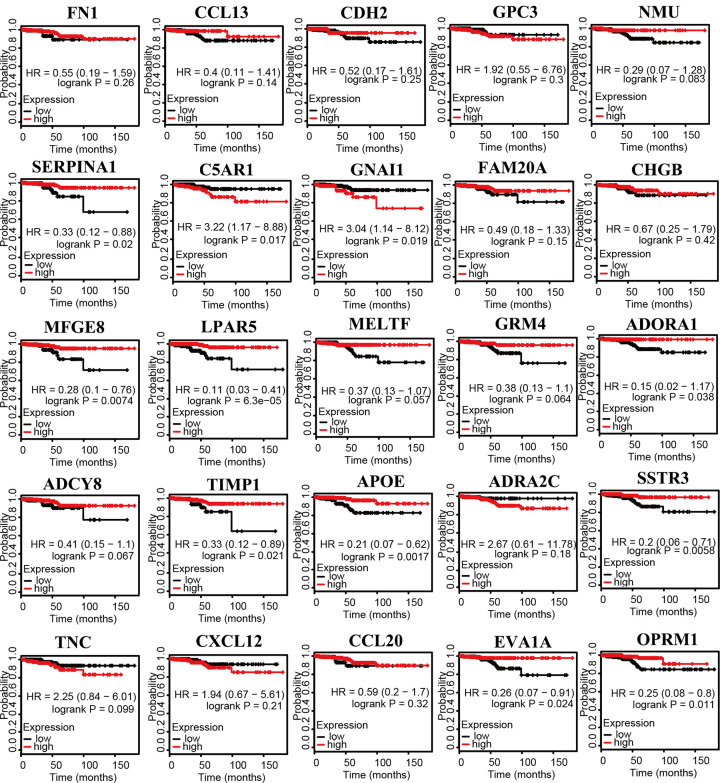
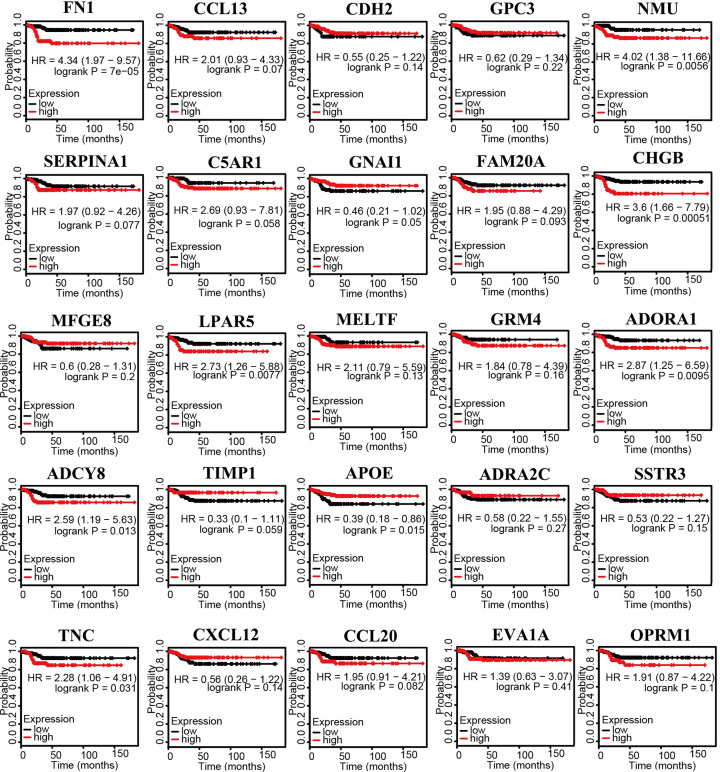
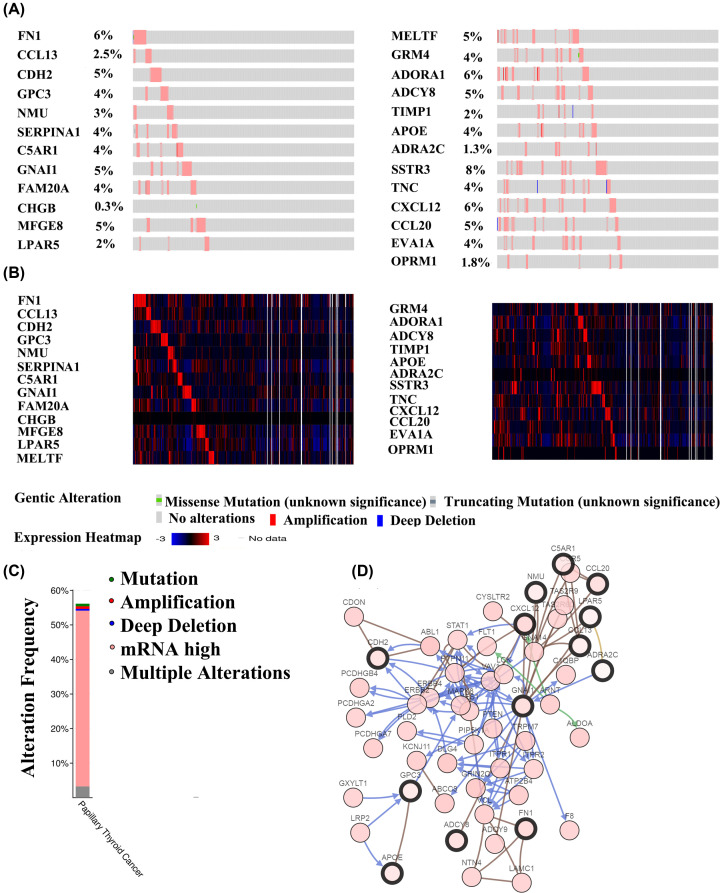
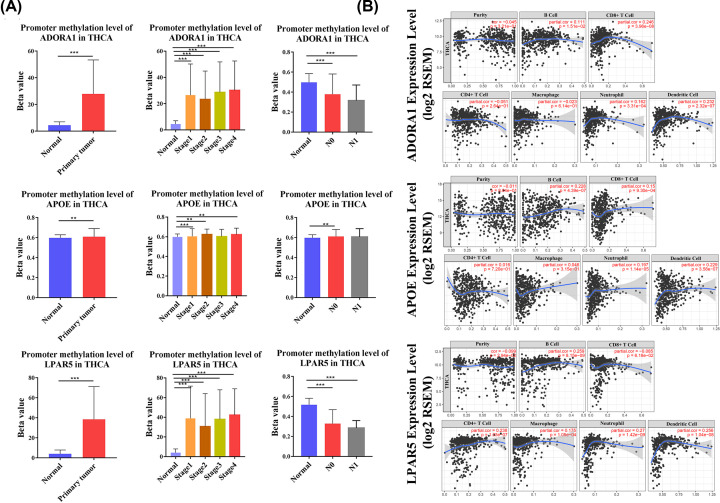
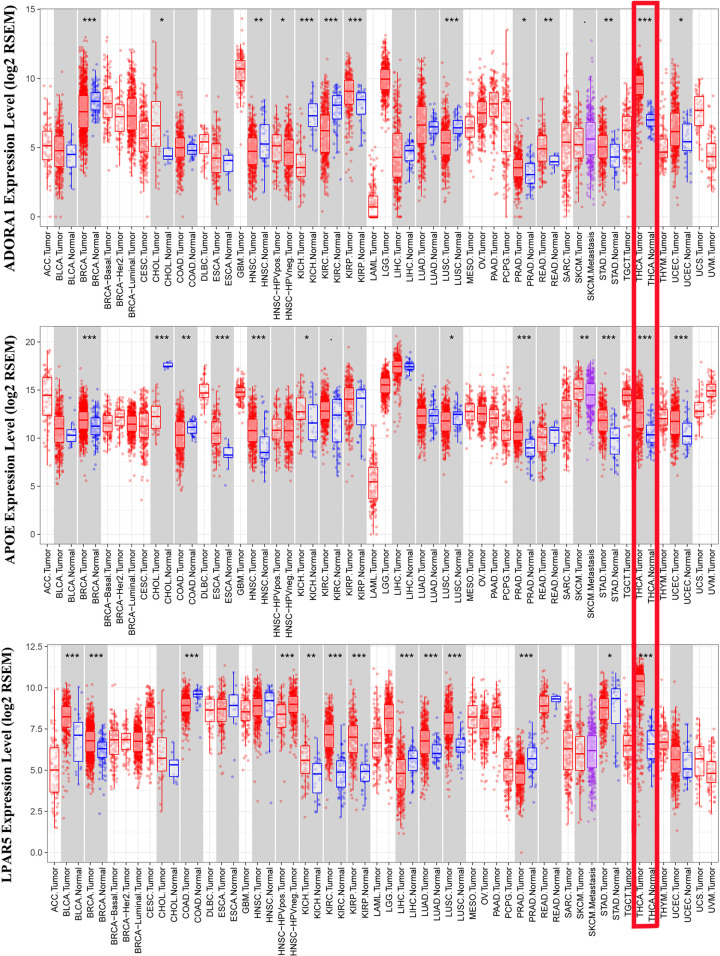
Results: Twenty-five genes were identified as hub genes with nodes greater than 10. The expression of 25 genes were verified by the GEPIA database, and the overall survival and disease-free survival analyses were conducted with Kaplan-Meier plotter. We found only three genes were confirmed with our validation and were statistically significant in PTC, namely ADORA1, APOE, and LPAR5. Further analysis found that the mRNA levels and methylation degree of these three genes were significantly correlated with the TNM staging of PTC. And these three genes were related to PTC immune infiltration. Verification of the expression of these three genes by RT-qPCR and Western blot further confirmed the reliability of our results.

Conclusion: Our study identified three genes that may play key regulatory roles in the development, metastasis, and immune infiltration of papillary thyroid carcinoma.

Keywords: RNA-Seq; bioinformatics; key gene; papillary thyroid carcinoma.


Conflict of interest statement

The authors declare that there are no competing interests associated with the manuscript.

Figures

Figure 1
Figure 1. Identification of DEGs by RNA-seq
The heat map (A) and PPI network of the DEGs (B). (C) The volcano plots of the DEGs. (D) The most significant module was selected by MCODE in Cytoscape. Red represents the up-regulated genes, and blue represents the down-regulated genes.
Figure 2
Figure 2. GO and KEGG pathway enrichment analysis of 3745 DEGs through RNA-Seq
(A) Bubble plot of Gene Ontology enrichment analysis of DEGs. (B) Bubble plot of Kyoto Encyclopaedia of Genes and Genomes pathway enrichment analysis of DEGs.
Figure 3
Figure 3. GO enrichment analysis and KEGG analysis for the key genes
(A) Top 10 elements involved in biological processes. (B) Top 10 elements involved in molecular function. (C) Top 10 elements involved in cellular components. (D) Top 10 pathways related to the 25 key genes through KEGG analysis.
Figure 4
Figure 4. Validation of the 25 key DEGs in the GEPIA database
ADORA1, APOE, CCL13, CDH2, CXCL12, EVA1A, FAM20A, FN1, GNAI1, LPAR5, MFGE8, NMU, SERPINA1, TIMP1, and TNC are overexpressed in PTC tissues compared with paracancerous tissue, while GNAI and GPC3 are down-regulated.
Figure 5
Figure 5. Overall survival analysis of 25 key genes in PTC using Kaplan–Meier plots
Expression levels of ADORA1, APOE, C5AR1, EVA1A, FAM20A, GNAI1, LPAR5, MFGE8, OPRM1, SERPINA1, SSTR3, and TIMP1 are related to the overall survival of patients with PTC.
Figure 6
Figure 6. Disease-free survival analysis of 25 key genes in PTC using Kaplan–Meier plots
Expression levels of ADCY8, ADORA1, APOE, CHGB, FN1, LPAR5, NMU, and TNC are significantly related to the disease-free survival of patients with PTC.
Figure 7
Figure 7. The 25 key genes expression and mutation analysis in PTC by the cBioPortal for Cancer Genomics
(A) The genetic alterations of 25 key genes of 399 PTC samples. Queried genes are altered in 224 (56%) of queried patients/samples. (B) The expression heatmap of 25 key genes. (C) The alteration frequency of 25 key genes in PTC. (D) Network of 25 key genes mutations and their 50 frequently altered neighboring genes in PTC.
Figure 8
Figure 8. The mRNA and protein expressions of ADORA1, APOE, and LPAR5 in PTC tissues
(A–C) Validation of expression levels of ADORA1, APOE, and LPAR5 by RT-qPCR in 30 cases of PTC and matched adjacent tissues. (D) ADORA1, APOE, and LPAR5 protein levels are increased in four cases of PTC and matched adjacent tissues, as measured by Western Blot; *** P<0.001.
Figure 9
Figure 9. Relative expression of ADORA1, APOE, and LPAR5 in normal thyroid tissues and PTC tissues, individual cancer stages and nodal metastasis status, respectively (UALCAN)
***P<0.001
Figure 10
Figure 10. Methylation level and immune infiltration level of ADORA1, APOE, and LPAR5
(A) Relative methylation level of ADORA1, APOE and LPAR5 based on normal thyroid tissues and PTC tissues, individual cancer stages and nodal metastasis status, respectively (UALCAN). (B) The correlation between the three genes and TIICs (TIMER); TIICs, tumor infiltrating immune cells.
Figure 11
Figure 11. The expression of ADORA1, APOE, and LPAR5 in thyroid cancer tissues and normal thyroid tissues
The three genes expression were analyzed in different kind of cancer tissues and normal tissues via the TIMER database; *P<0.05, **P<0.01, ***P<0.01.

References

    1. Kitahara C.M. and Sosa J.A. (2016) The changing incidence of thyroid cancer. Nat. Rev. Endocrinol. 12, 646–653 10.1038/nrendo.2016.110 - DOI - PMC - PubMed
    1. Aschebrook-Kilfoy B., Ward M.H., Sabra M.M. and Devesa S.S. (2011) Thyroid cancer incidence patterns in the United States by histologic type, 1992-2006. Thyroid 21, 125–134 10.1089/thy.2010.0021 - DOI - PMC - PubMed
    1. Pourseirafi S., Shishehgar M., Ashraf M.J. and Faramarzi M. (2018) Papillary Carcinoma of Thyroid with Nasal Cavity Metastases: A Case Report. Iran J. Med. Sci. 43, 90–93 - PMC - PubMed
    1. Ullmann T.M., Gray K.D., Moore M.D., Zarnegar R. and Fahey T.J. III (2018) Current controversies and future directions in the diagnosis and management of differentiated thyroid cancers. Gland Surg. 7, 473–486 10.21037/gs.2017.09.08 - DOI - PMC - PubMed
    1. Jin X., Deng B., Ye K. et al. . (2019) Comprehensive expression profiles and bioinformatics analysis reveal special circular RNA expression and potential predictability in the peripheral blood of humans with idiopathic membranous nephropathy. Mol. Med. Rep. 20, 4125–4139 10.3892/mmr.2019.10671 - DOI - PMC - PubMed

Publication types

MeSH terms