

Investigation of Pathophysiological Aspects of Aortic Growth, Remodeling, and Failure Using a Discrete-Fiber Microstructural Model
- PMID: 32766738
- PMCID: PMC7580844
- DOI: 10.1115/1.4048031
Investigation of Pathophysiological Aspects of Aortic Growth, Remodeling, and Failure Using a Discrete-Fiber Microstructural Model
Abstract
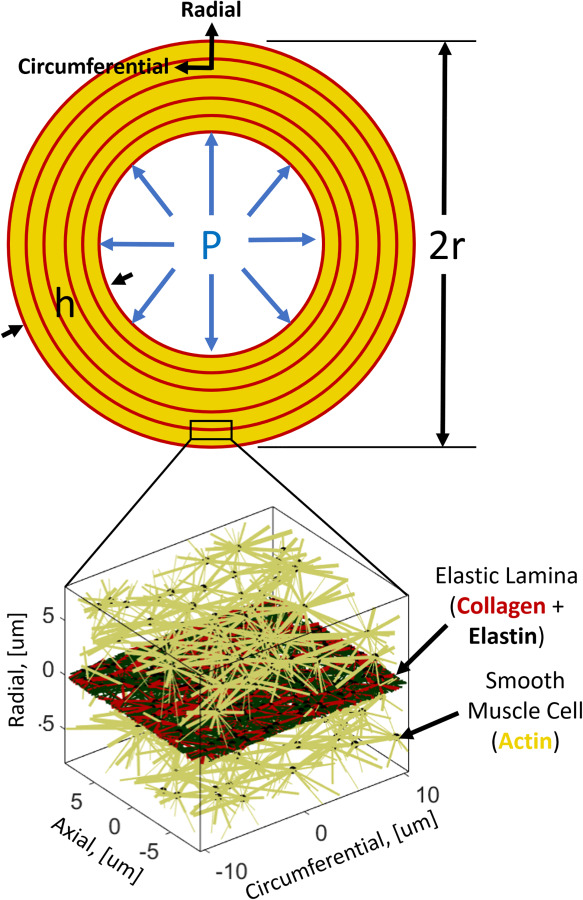
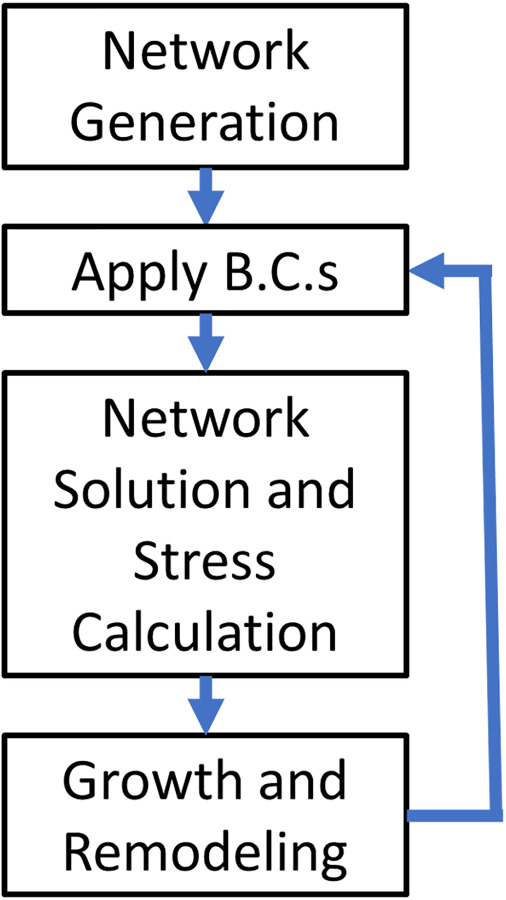
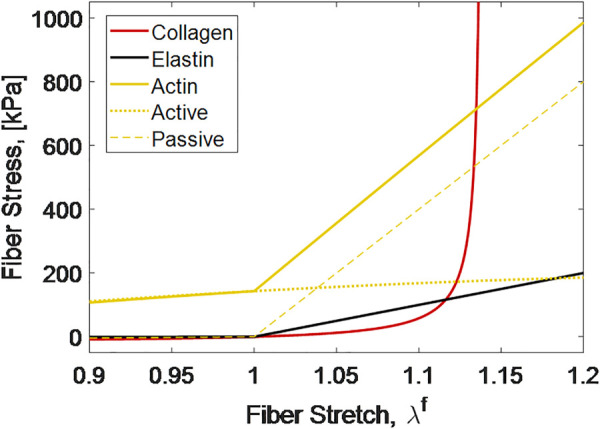
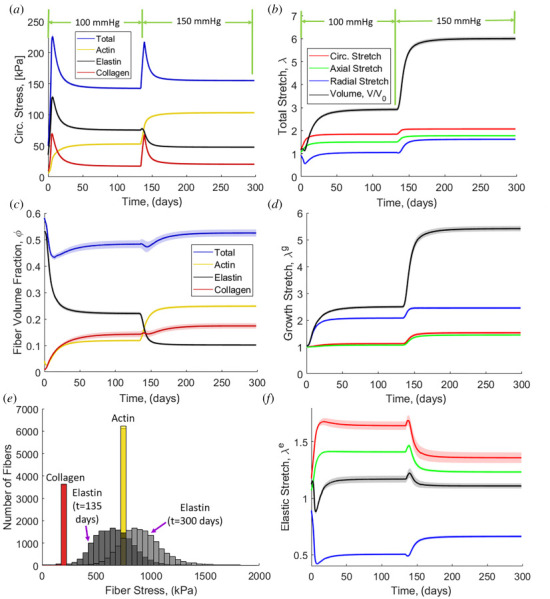
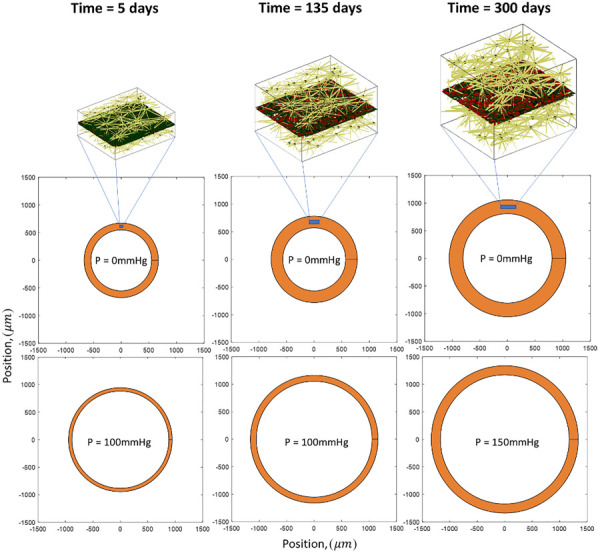
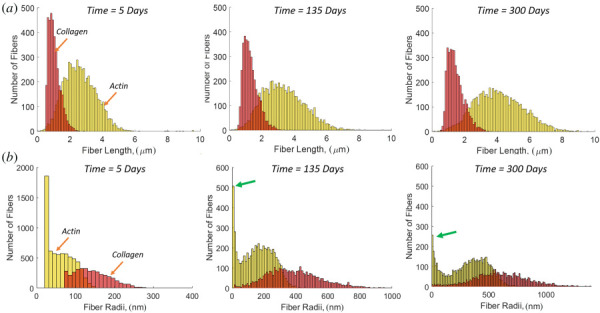
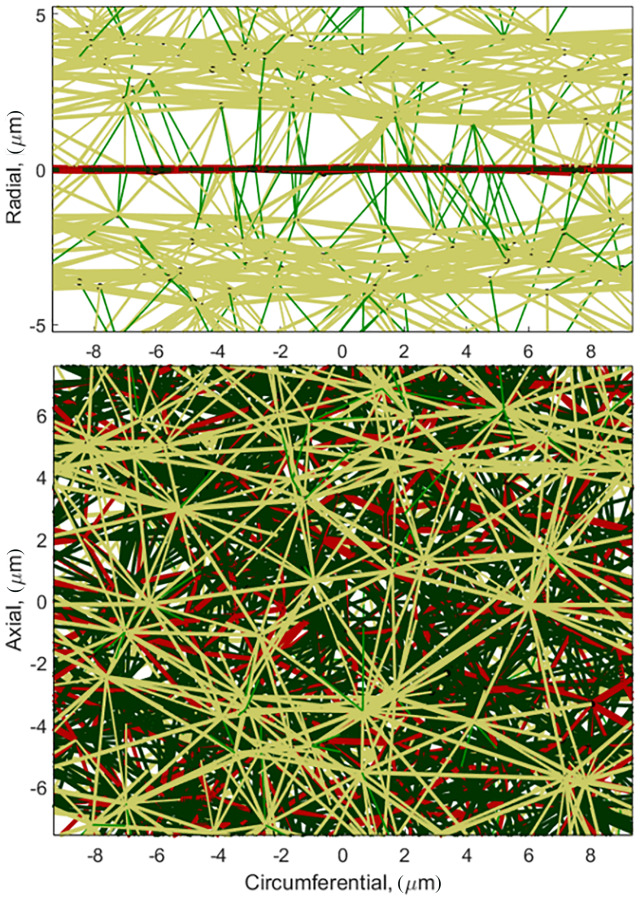
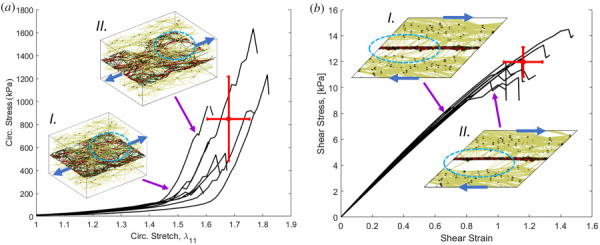
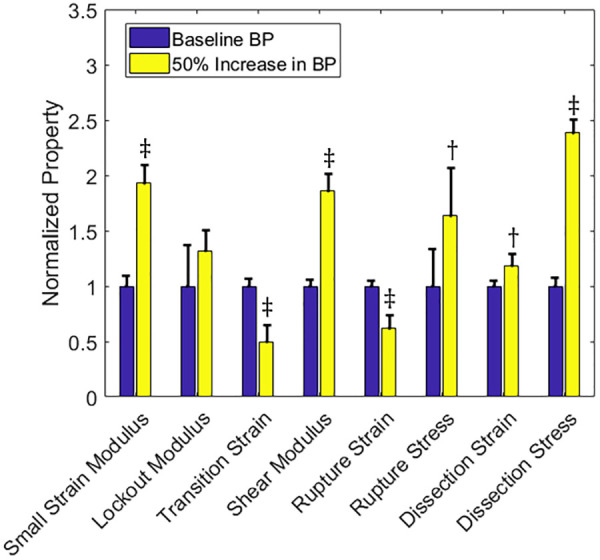
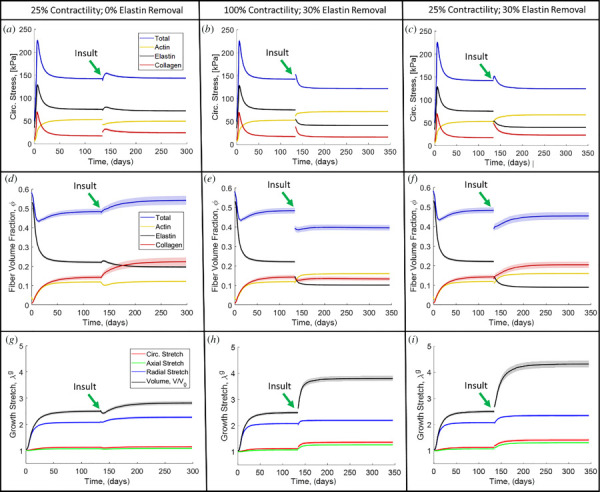
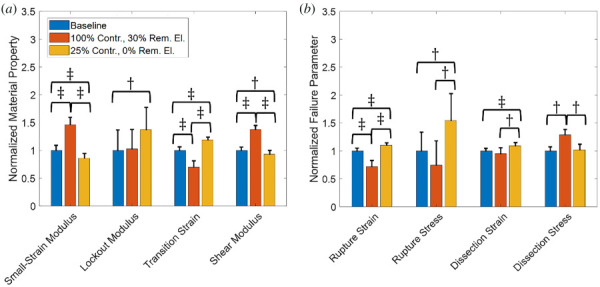
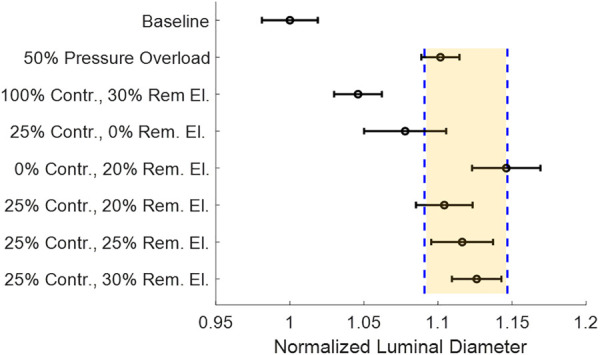
Aortic aneurysms are inherently unpredictable. One can never be sure whether any given aneurysm may rupture or dissect. Clinically, the criteria for surgical intervention are based on size and growth rate, but it remains difficult to identify a high-risk aneurysm, which may require intervention before the cutoff criteria, versus an aneurysm than can be treated safely by more conservative measures. In this work, we created a computational microstructural model of a medial lamellar unit (MLU) incorporating (1) growth and remodeling laws applied directly to discrete, individual fibers, (2) separate but interacting fiber networks for collagen, elastin, and smooth muscle, (3) active and passive smooth-muscle cell mechanics, and (4) failure mechanics for all three fiber types. The MLU model was then used to study different pathologies and microstructural anomalies that may play a role in vascular growth and failure. Our model recapitulated many aspects of arterial remodeling under hypertension with no underlying genetic syndrome including remodeling dynamics, tissue mechanics, and failure. Syndromic effects (smooth muscle cell (SMC) dysfunction or elastin fragmentation) drastically changed the simulated remodeling process, tissue behavior, and tissue strength. Different underlying pathologies were able to produce similarly dilatated vessels with different failure properties, providing a partial explanation for the imperfect nature of aneurysm size as a predictor of outcome.
Copyright © 2020 by ASME.
Figures
Similar articles
-
The three-dimensional micro- and nanostructure of the aortic medial lamellar unit measured using 3D confocal and electron microscopy imaging.Matrix Biol. 2008 Apr;27(3):171-81. doi: 10.1016/j.matbio.2007.10.008. Epub 2007 Nov 13. Matrix Biol. 2008. PMID: 18248974 Free PMC article.
-
Smooth muscle cell deletion of low-density lipoprotein receptor-related protein 1 augments angiotensin II-induced superior mesenteric arterial and ascending aortic aneurysms.Arterioscler Thromb Vasc Biol. 2015 Jan;35(1):155-62. doi: 10.1161/ATVBAHA.114.304683. Epub 2014 Nov 13. Arterioscler Thromb Vasc Biol. 2015. PMID: 25395615 Free PMC article.
-
Captopril treatment during development alleviates mechanically induced aortic remodeling in newborn elastin knockout mice.Biomech Model Mechanobiol. 2020 Feb;19(1):99-112. doi: 10.1007/s10237-019-01198-2. Epub 2019 Jul 3. Biomech Model Mechanobiol. 2020. PMID: 31270728 Free PMC article.
-
Aortic Aneurysms and Dissections Series.Arterioscler Thromb Vasc Biol. 2020 Mar;40(3):e37-e46. doi: 10.1161/ATVBAHA.120.313991. Epub 2020 Feb 26. Arterioscler Thromb Vasc Biol. 2020. PMID: 32101472 Free PMC article. Review.
-
Review of the Techniques Used for Investigating the Role Elastin and Collagen Play in Arterial Wall Mechanics.IEEE Rev Biomed Eng. 2021;14:256-269. doi: 10.1109/RBME.2020.3005448. Epub 2021 Jan 22. IEEE Rev Biomed Eng. 2021. PMID: 32746366 Review.
Cited by
-
A multiscale discrete fiber model of failure in heterogeneous tissues: Applications to remodeled cerebral aneurysms.J Biomech. 2025 Jan;178:112343. doi: 10.1016/j.jbiomech.2024.112343. Epub 2024 Sep 24. J Biomech. 2025. PMID: 39341733
-
A computational bridge between traction force microscopy and tissue contraction.J Appl Phys. 2023 Aug 21;134(7):074901. doi: 10.1063/5.0157507. Epub 2023 Aug 15. J Appl Phys. 2023. PMID: 37593660 Free PMC article.
-
Transport across the thoracic aortic wall: implications for aneurysm pathobiology, diagnosis, and treatment.Am J Physiol Heart Circ Physiol. 2025 May 1;328(5):H1113-H1129. doi: 10.1152/ajpheart.00886.2024. Epub 2025 Apr 7. Am J Physiol Heart Circ Physiol. 2025. PMID: 40192071 Free PMC article. Review.
-
Experimental and Mouse-Specific Computational Models of the Fbln4SMKO Mouse to Identify Potential Biomarkers for Ascending Thoracic Aortic Aneurysm.Cardiovasc Eng Technol. 2022 Aug;13(4):558-572. doi: 10.1007/s13239-021-00600-4. Epub 2022 Jan 22. Cardiovasc Eng Technol. 2022. PMID: 35064559 Free PMC article.
-
Elucidating the signal for contact guidance contained in aligned fibrils with a microstructural-mechanical model.J R Soc Interface. 2022 May;19(190):20210951. doi: 10.1098/rsif.2021.0951. Epub 2022 May 18. J R Soc Interface. 2022. PMID: 35582810 Free PMC article.
References
-
- Milewicz, D. M. , Guo, D.-C. , Tran-Fadulu, V. , Lafont, A. L. , Papke, C. L. , Inamoto, S. , Kwartler, C. S. , and Pannu, H. , 2008, “ Genetic Basis of Thoracic Aortic Aneurysms and Dissections: Focus on Smooth Muscle Cell Contractile Dysfunction,” Annu. Rev. Genomics Hum. Genet., 9(1), pp. 283–302.10.1146/annurev.genom.8.080706.092303 - DOI - PubMed
-
- National Center for Chronic Disease Prevention and Health Promotion, Division for Heart Disease and Stroke Prevention, 2019, “ Aortic Aneurysm,” CDC, Atlanta, GA, accessed Mar. 9, 2020, https://www.cdc.gov/heartdisease/aortic_aneurysm.htm
-
- O'Connell, M. , Murthy, S. , Phan, S. , Xu, C. , Buchanan, J. , Spilker, R. , Dalman, R. , Zarins, C. , Denk, W. , and Taylor, C. , 2008, “ The Three-Dimensional Micro- and Nanostructure of the Aortic Medial Lamellar Unit Measured Using 3D Confocal and Electron Microscopy Imaging,” Matrix Biol., 27(3), pp. 171–181.10.1016/j.matbio.2007.10.008 - DOI - PMC - PubMed
-
- Humphrey, J. D. , 2002, Cardiovascular Solid Mechanics, Springer, New York.
-
- Treuting, P. M. , Dintzis, S. M. , and Montine, K. S. , 2012, Comparative Anatomy and Histology, Elsevier, San Diego, CA.
MeSH terms
Substances
Grants and funding
LinkOut - more resources
Full Text Sources
