Quantitative perfusion mapping with induced transient hypoxia using BOLD MRI
- PMID: 32767413
- PMCID: PMC7728454
- DOI: 10.1002/mrm.28422
Quantitative perfusion mapping with induced transient hypoxia using BOLD MRI
Abstract
Purpose: Gadolinium-based dynamic susceptibility contrast (DSC) is commonly used to characterize blood flow in patients with stroke and brain tumors. Unfortunately, gadolinium contrast administration has been associated with adverse reactions and long-term accumulation in tissues. In this work, we propose an alternative deoxygenation-based DSC (dDSC) method that uses a transient hypoxia gas paradigm to deliver a bolus of paramagnetic deoxygenated hemoglobin to the cerebral vasculature for perfusion imaging.
Methods: Through traditional DSC tracer kinetic modeling, the MR signal change induced by this hypoxic bolus can be used to generate regional perfusion maps of cerebral blood flow, cerebral blood volume, and mean transit time. This gas paradigm and blood-oxygen-level-dependent (BOLD)-MRI were performed concurrently on a cohort of 66 healthy and chronically anemic subjects (age 23.5 ± 9.7, female 64%).
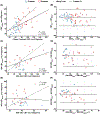
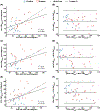
Results: Our results showed reasonable global and regional agreement between dDSC and other flow techniques, such as phase contrast and arterial spin labeling.
Conclusion: In this proof-of-concept study, we demonstrated the feasibility of using transient hypoxia to generate a contrast bolus that mimics the effect of gadolinium and yields reasonable perfusion estimates. Looking forward, optimization of the hypoxia boluses and measurement of the arterial-input function is necessary to improve the accuracy of dDSC. Additionally, a cross-validation study of dDSC and DSC in brain tumor and ischemic stroke subjects is warranted to evaluate the clinical diagnostic utility of this approach.
Keywords: arterial spin labeling; deoxyhemoglobin contrast; dynamic susceptibility contrast; phase contrast; transient hypoxia.
© 2020 International Society for Magnetic Resonance in Medicine.
Figures


References
-
- Shiroishi MS, Castellazzi G, Boxerman JL, et al. Principles of T2*-weighted dynamic susceptibility contrast MRI technique in brain tumor imaging. J Magn Reson Imaging. 2015;41:296–313. - PubMed
-
- Yamada K, Wu O, Gonzalez RG, et al. Magnetic resonance perfusion-weighted imaging of acute cerebral infarction: effect of the calculation methods and underlying vasculopathy. Stroke. 2002;33:87–94. - PubMed
-
- Young GS. Advanced MRI of adult brain tumors. Neurol Clin. 2007;25:947–973. - PubMed
-
- Beaumont A, Fatouros P, Gennarelli T, Corwin F, Marmarou A. Bolus tracer delivery measured by MRI confirms edema without blood-brain barrier permeability in diffuse traumatic brain injury. Acta Neurochir Suppl. 2006;96:171–174. - PubMed
Publication types
MeSH terms
Substances
Grants and funding
LinkOut - more resources
Full Text Sources
Other Literature Sources
Medical

